| Param | Original file | Final file |
|---|---|---|
| Filename | modeM0/AS1A05_108T02_9000002676_17980cztM0_level2.evt | modeM0/AS1A05_108T02_9000002676_17980cztM0_level2_quad_clean.evt |
| Size (bytes) | 548,700,480 | 95,973,120 |
| Size | 523.3 MB | 91.5 MB |
| Events in quadrant A | 4,446,488 | 596,850 |
| Events in quadrant B | 3,598,856 | 621,150 |
| Events in quadrant C | 3,595,978 | 599,273 |
| Events in quadrant D | 4,490,613 | 590,830 |
| Mode SS | |||
|---|---|---|---|
| Quadrant | BADHDUFLAG | Total packets | Discarded packets |
| A | 0 | 148 | 0 |
| B | 0 | 148 | 0 |
| C | 0 | 148 | 0 |
| D | 0 | 148 | 0 |
| Mode M9 | |||
|---|---|---|---|
| Quadrant | BADHDUFLAG | Total packets | Discarded packets |
| A | 0 | 19 | 0 |
| B | 0 | 19 | 0 |
| C | 0 | 19 | 0 |
| D | 0 | 19 | 0 |
| Mode M0 | |||
|---|---|---|---|
| Quadrant | BADHDUFLAG | Total packets | Discarded packets |
| A | 0 | 18014 | 2 |
| B | 0 | 15441 | 2 |
| C | 0 | 15268 | 2 |
| D | 0 | 18344 | 2 |
| Quadrant | Total seconds | Saturated seconds | Saturation percentage |
|---|---|---|---|
| A | 7153 | 288 | 4.026283% |
| B | 7154 | 109 | 1.523623% |
| C | 7153 | 117 | 1.635677% |
| D | 7153 | 299 | 4.180064% |
Noise dominated data is calculated using 1-second bins in cleaned event files. If a bin has >2000 counts, and if more than 50% of those come from <1% of pixels, then it is considered to be noise-dominated and hence unusable.
| Quadrant | # 1 sec bins | Bins with >0 counts | Bins with >2000 counts | High rate bins dominated by noise | Noise dominated (total time) | Noise dominated (detector-on time) | Marked lightcurve |
|---|---|---|---|---|---|---|---|
| A | 9083 | 7155 | 153 | 153 | 1.68% | 2.14% | 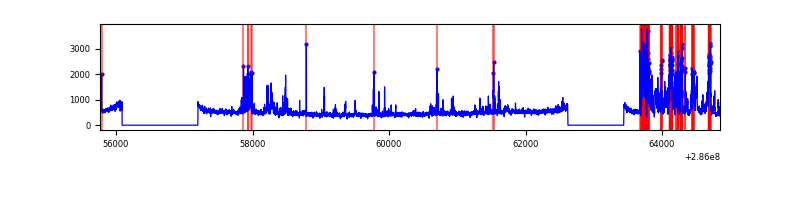 |
| B | 9084 | 7156 | 6 | 6 | 0.07% | 0.08% | 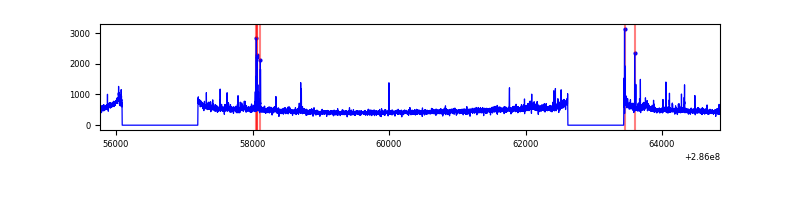 |
| C | 9083 | 7155 | 0 | 0 | 0.00% | 0.00% |  |
| D | 9083 | 7154 | 159 | 159 | 1.75% | 2.22% | 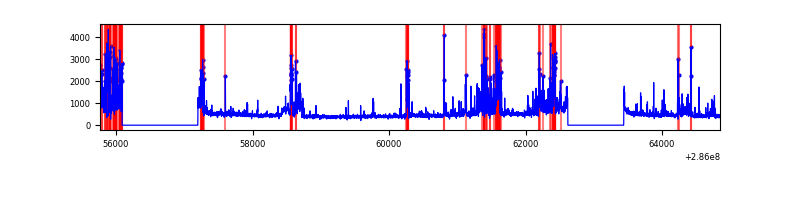 |
Top three noisy pixels from each quadrant. If the there are fewer than three noisy pixels in the level2.evt file, extra rows are filled as -1
| Pixel properties | Quadrant properties | ||||||
|---|---|---|---|---|---|---|---|
| Quadrant | DetID | PixID | Counts | Sigma | Mean | Median | Sigma |
| A | 14 | 237 | 1072218 | 6091.62 | 870 | 849 | 175.9 |
| A | 15 | 174 | 31155 | 172.31 | 870 | 849 | 175.9 |
| A | 0 | 226 | 7664 | 38.75 | 870 | 849 | 175.9 |
| B | 0 | 197 | 51060 | 296.0 | 882 | 859 | 169.6 |
| B | 0 | 189 | 20310 | 114.69 | 882 | 859 | 169.6 |
| B | 12 | 111 | 19868 | 112.08 | 882 | 859 | 169.6 |
| C | 3 | 233 | 153586 | 763.52 | 849 | 854 | 200.0 |
| C | 14 | 238 | 129382 | 642.52 | 849 | 854 | 200.0 |
| C | 13 | 61 | 6048 | 25.97 | 849 | 854 | 200.0 |
| D | 5 | 222 | 620318 | 2854.45 | 841 | 820 | 217.0 |
| D | 11 | 176 | 339378 | 1559.97 | 841 | 820 | 217.0 |
| D | 7 | 238 | 258580 | 1187.68 | 841 | 820 | 217.0 |
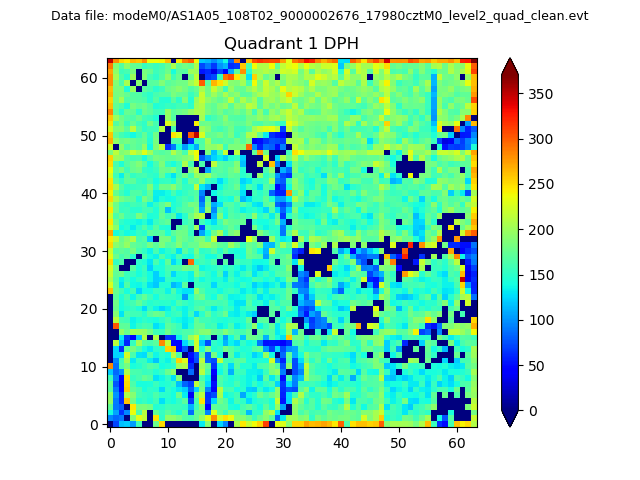
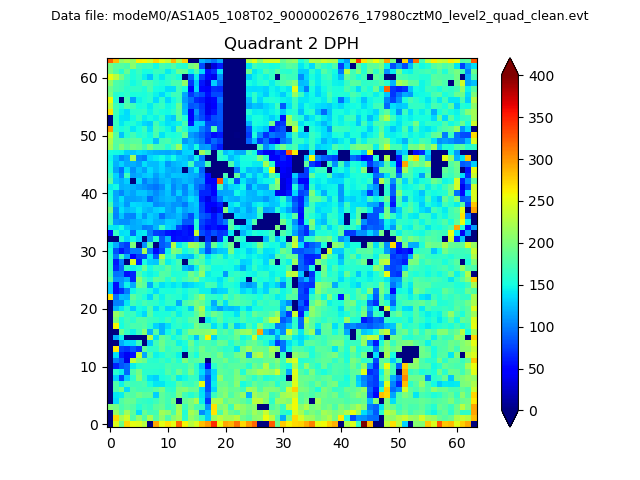
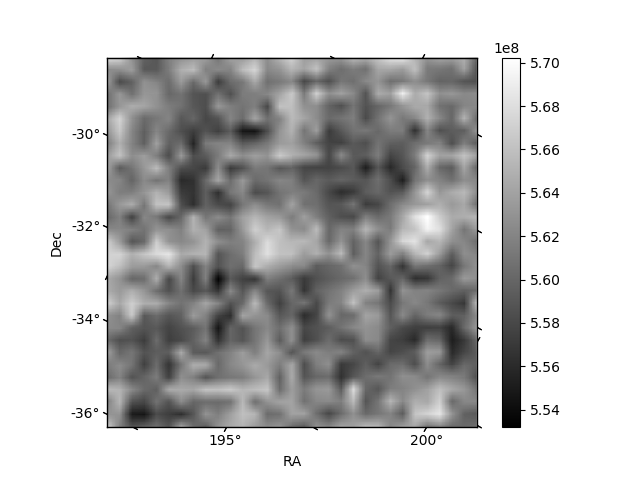
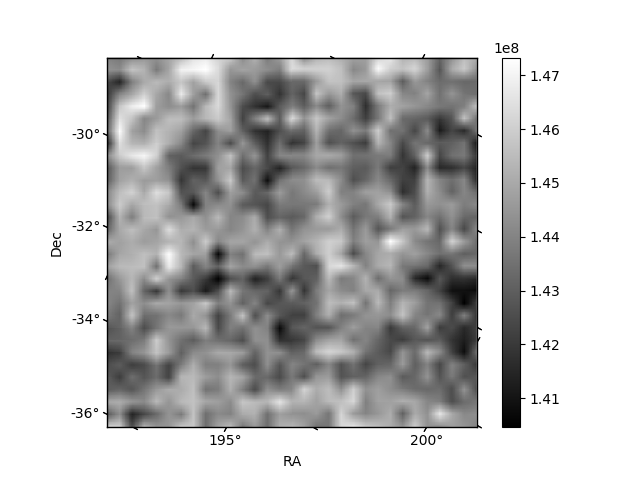
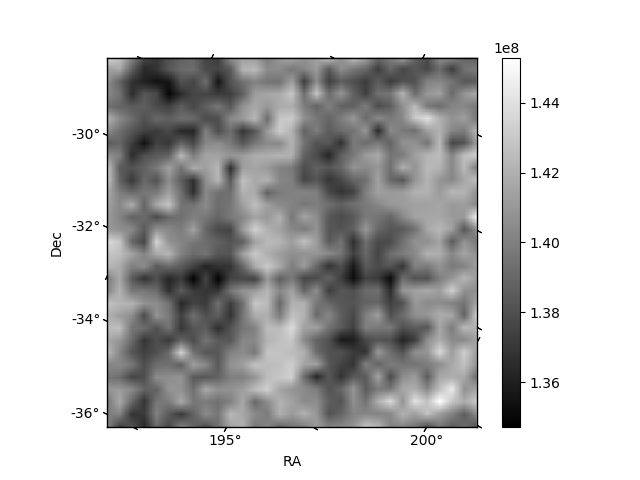
Histogram calculated using DETX and DETY for each event in the final _common_clean file
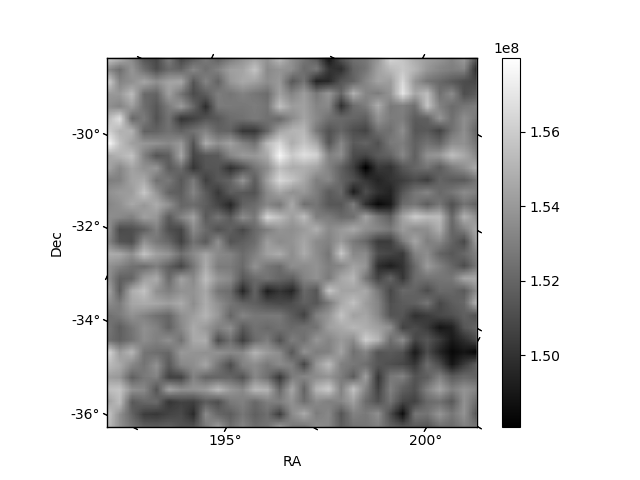
| Quadrant A | 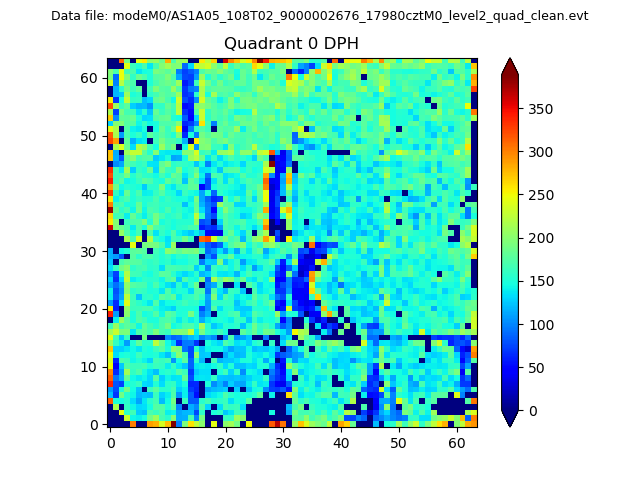 |
 |
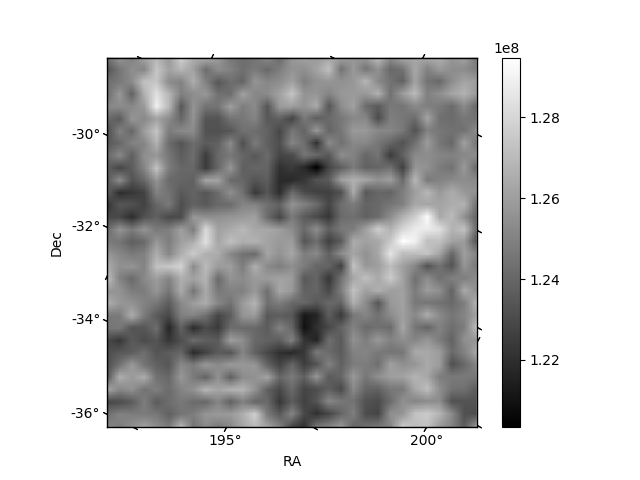
Quadrant B |
|---|---|---|---|
| Quadrant D | 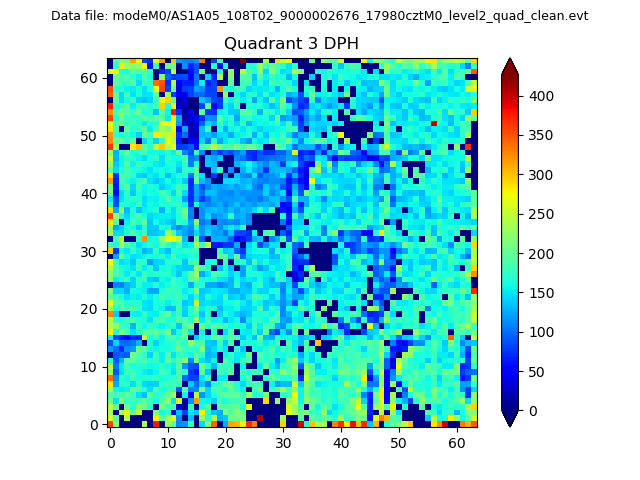 |
 |
Quadrant C |
| Plot type | Count rate plots | Images |
|---|---|---|
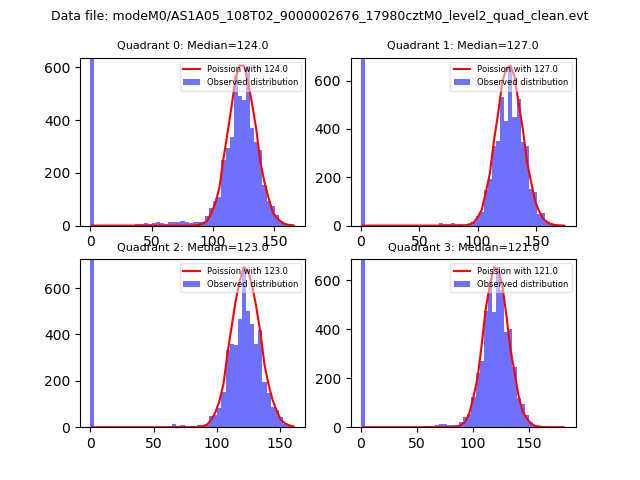
| Comparison with Poisson distribution Blue bars denote a histogram of data divided into 1 sec bins. Red curve is a Poisson curve with rate = median count rate of data. |
 |
 |
| Quadrant-wise count rates Data is divided into 100 sec bins |
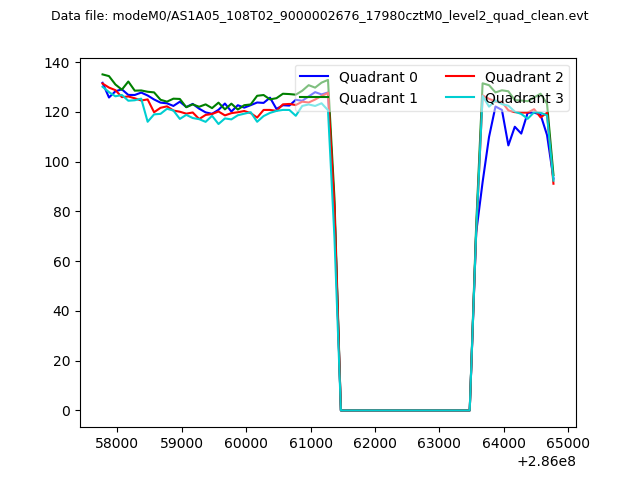 |
|
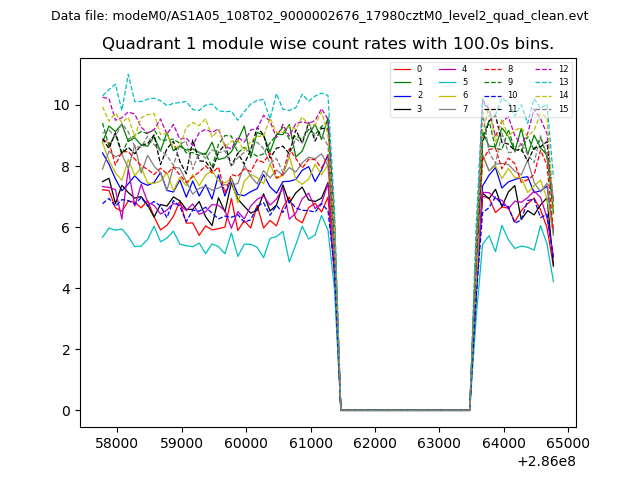
| Module-wise count rates for Quadrant A Data is divided into 100 sec bins |
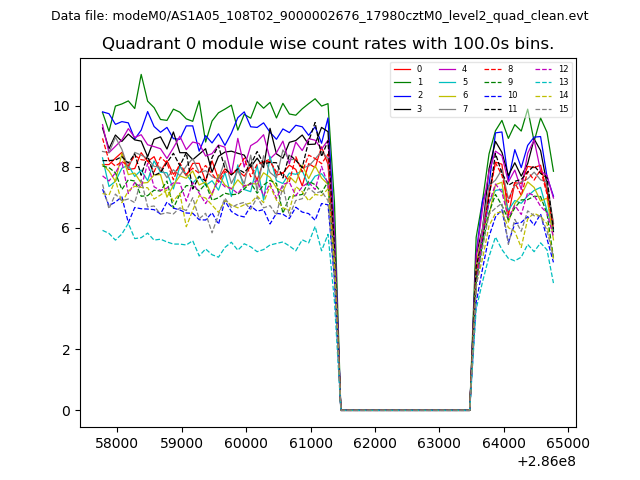 |
 |
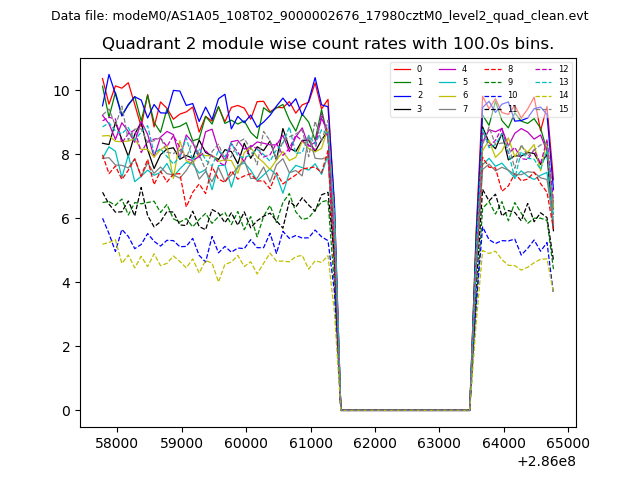
| Module-wise count rates for Quadrant B Data is divided into 100 sec bins |
 |
 |
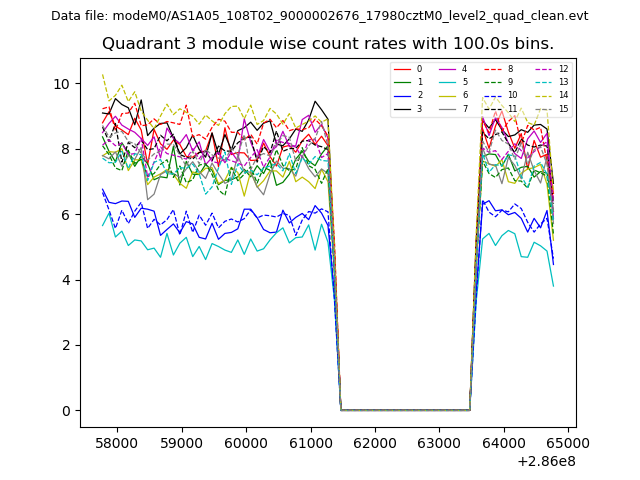
| Module-wise count rates for Quadrant C Data is divided into 100 sec bins |
 |
 |
| Module-wise count rates for Quadrant D Data is divided into 100 sec bins |
 |
 |
| Parameter | Plot |
|---|---|
| CZT HV Monitor | 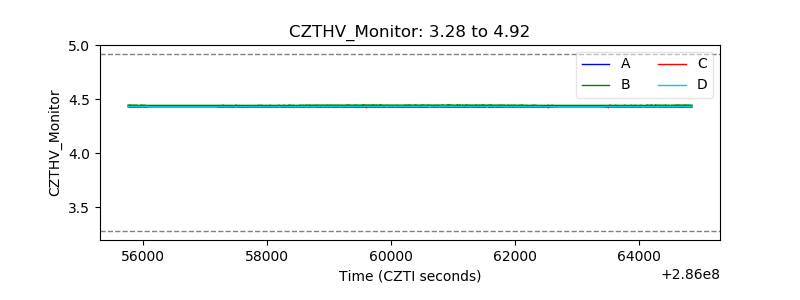 |
| D_VDD | 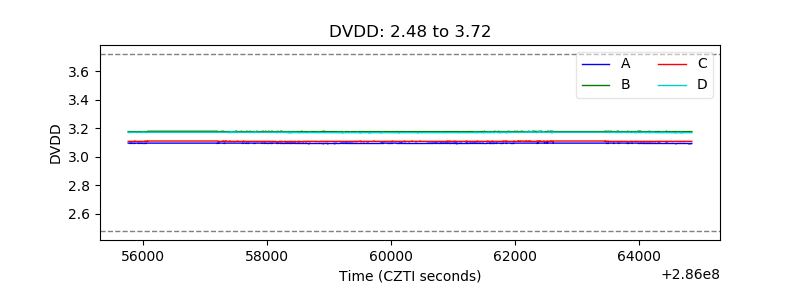 |
| Temperature 1 | 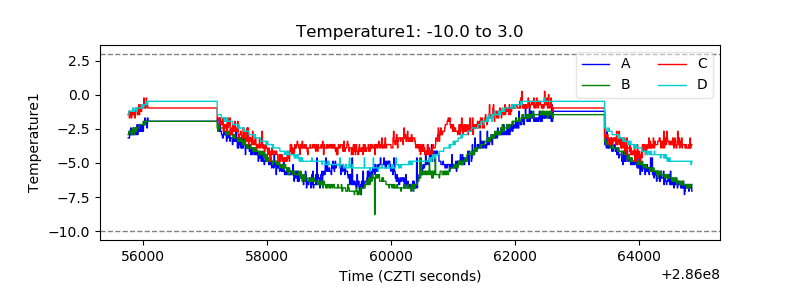 |
| Veto HV Monitor | 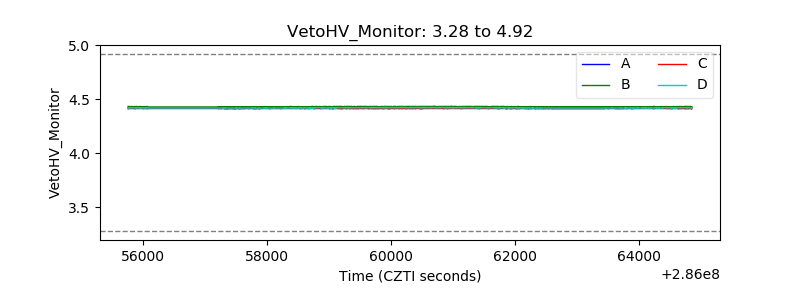 |
| Veto LLD | 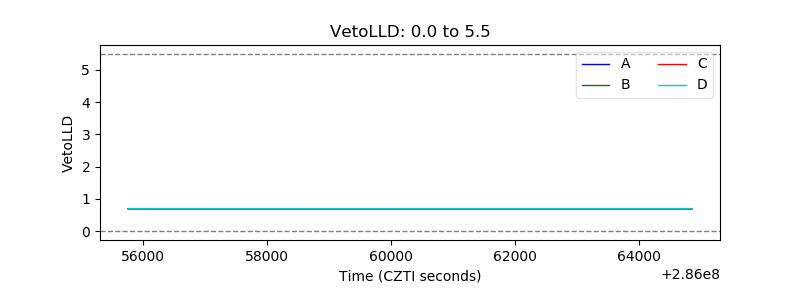 |
| Alpha Counter | 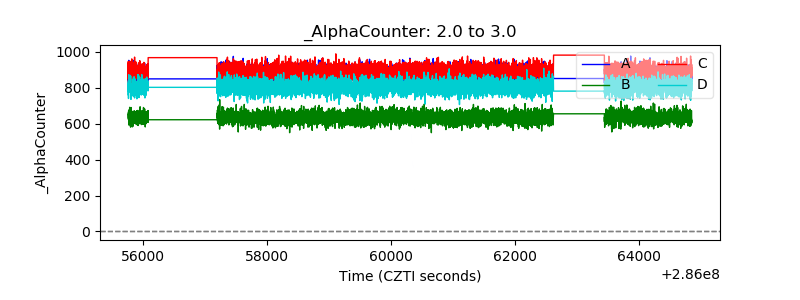 |
| _CPM_Rate | 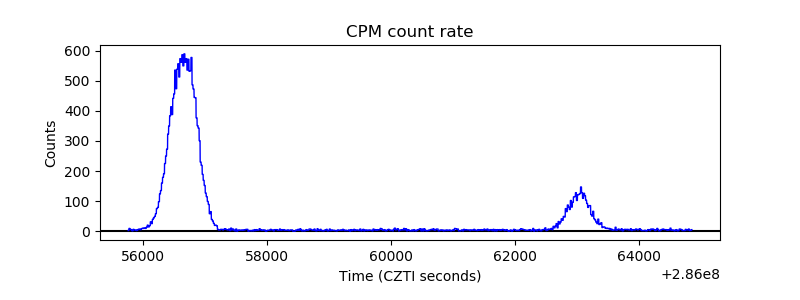 |
| CZT Counter | 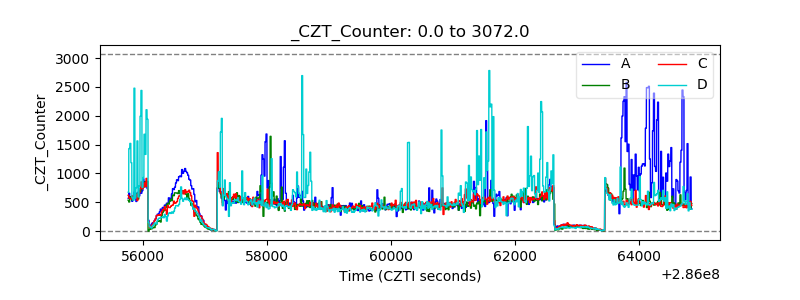 |
| +2.5 Volts monitor |  |
| +5 Volts monitor |  |
| _ROLL_ROT | 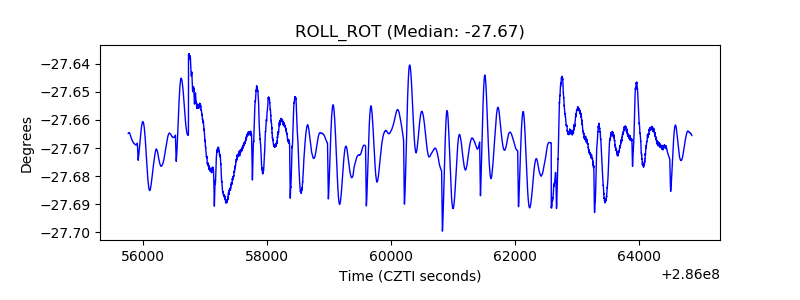 |
| _Roll_DEC | 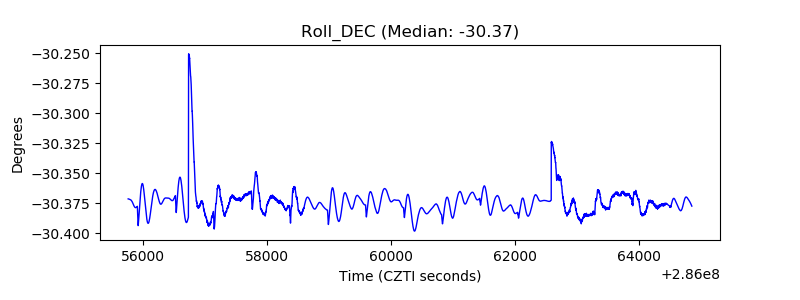 |
| _Roll_RA | 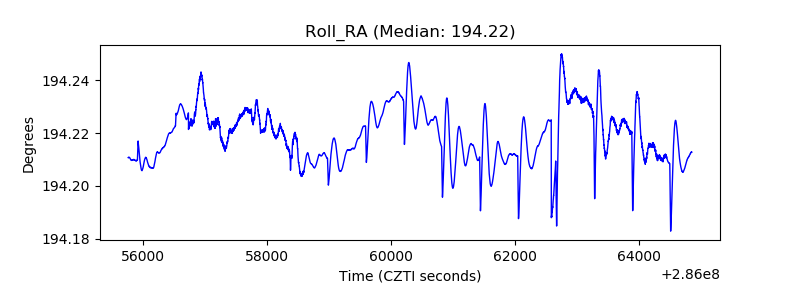 |
| Veto Counter | 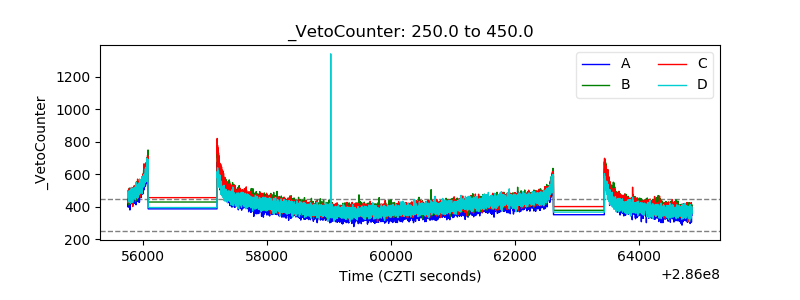 |