| Param | Original file | Final file |
|---|---|---|
| Filename | modeM0/AS1A05_108T02_9000002676_17981cztM0_level2.evt | modeM0/AS1A05_108T02_9000002676_17981cztM0_level2_quad_clean.evt |
| Size (bytes) | 641,286,720 | 97,663,680 |
| Size | 611.6 MB | 93.1 MB |
| Events in quadrant A | 7,024,907 | 575,439 |
| Events in quadrant B | 3,792,558 | 636,751 |
| Events in quadrant C | 3,753,792 | 613,294 |
| Events in quadrant D | 4,340,406 | 608,063 |
| Mode SS | |||
|---|---|---|---|
| Quadrant | BADHDUFLAG | Total packets | Discarded packets |
| A | 0 | 156 | 0 |
| B | 0 | 156 | 0 |
| C | 0 | 156 | 0 |
| D | 0 | 156 | 0 |
| Mode M9 | |||
|---|---|---|---|
| Quadrant | BADHDUFLAG | Total packets | Discarded packets |
| A | 0 | 12 | 0 |
| B | 0 | 12 | 0 |
| C | 0 | 12 | 0 |
| D | 0 | 12 | 0 |
| Mode M0 | |||
|---|---|---|---|
| Quadrant | BADHDUFLAG | Total packets | Discarded packets |
| A | 0 | 25797 | 2 |
| B | 0 | 16384 | 2 |
| C | 0 | 16041 | 3 |
| D | 0 | 18154 | 2 |
| Quadrant | Total seconds | Saturated seconds | Saturation percentage |
|---|---|---|---|
| A | 7522 | 912 | 12.124435% |
| B | 7523 | 105 | 1.395720% |
| C | 7522 | 112 | 1.488966% |
| D | 7522 | 125 | 1.661792% |
Noise dominated data is calculated using 1-second bins in cleaned event files. If a bin has >2000 counts, and if more than 50% of those come from <1% of pixels, then it is considered to be noise-dominated and hence unusable.
| Quadrant | # 1 sec bins | Bins with >0 counts | Bins with >2000 counts | High rate bins dominated by noise | Noise dominated (total time) | Noise dominated (detector-on time) | Marked lightcurve |
|---|---|---|---|---|---|---|---|
| A | 8767 | 7524 | 648 | 648 | 7.39% | 8.61% | 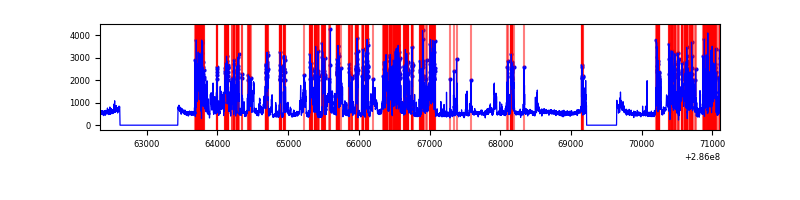 |
| B | 8768 | 7525 | 10 | 10 | 0.11% | 0.13% | 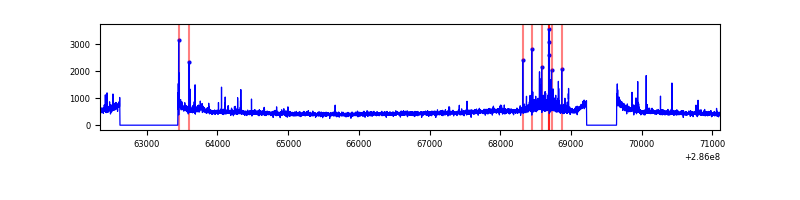 |
| C | 8767 | 7524 | 1 | 1 | 0.01% | 0.01% | 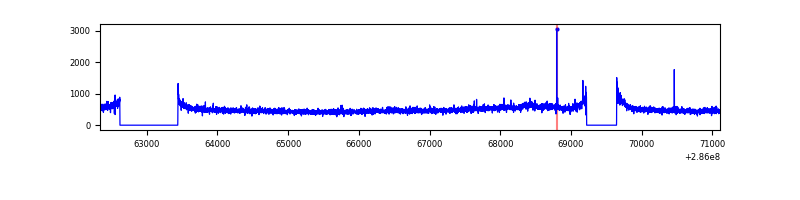 |
| D | 8767 | 7524 | 56 | 56 | 0.64% | 0.74% | 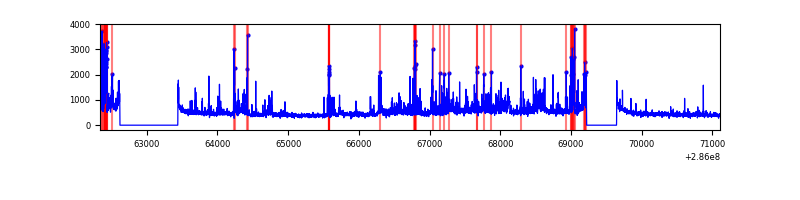 |
Top three noisy pixels from each quadrant. If the there are fewer than three noisy pixels in the level2.evt file, extra rows are filled as -1
| Pixel properties | Quadrant properties | ||||||
|---|---|---|---|---|---|---|---|
| Quadrant | DetID | PixID | Counts | Sigma | Mean | Median | Sigma |
| A | 14 | 237 | 3486104 | 19405.98 | 878 | 860 | 179.6 |
| A | 15 | 174 | 152382 | 843.68 | 878 | 860 | 179.6 |
| A | 4 | 2 | 12544 | 65.06 | 878 | 860 | 179.6 |
| B | 7 | 220 | 86156 | 481.63 | 915 | 894 | 177.0 |
| B | 5 | 172 | 31094 | 170.59 | 915 | 894 | 177.0 |
| B | 0 | 197 | 25672 | 139.97 | 915 | 894 | 177.0 |
| C | 3 | 233 | 182297 | 878.26 | 878 | 884 | 206.6 |
| C | 14 | 238 | 134935 | 648.97 | 878 | 884 | 206.6 |
| C | 0 | 207 | 8614 | 37.42 | 878 | 884 | 206.6 |
| D | 5 | 222 | 697281 | 3068.22 | 883 | 862 | 227.0 |
| D | 7 | 238 | 110136 | 481.43 | 883 | 862 | 227.0 |
| D | 11 | 176 | 93971 | 410.21 | 883 | 862 | 227.0 |
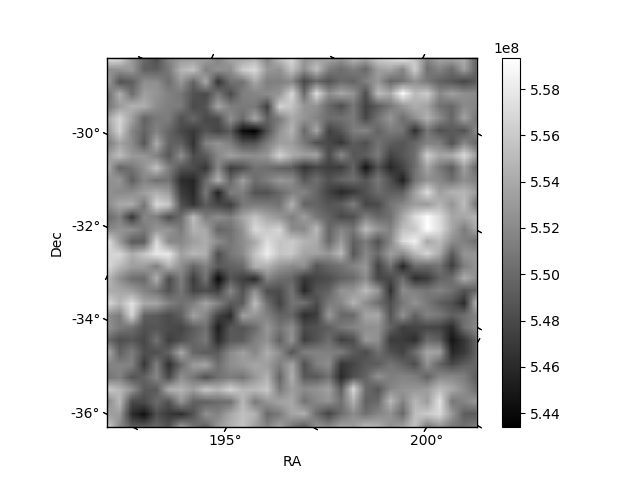
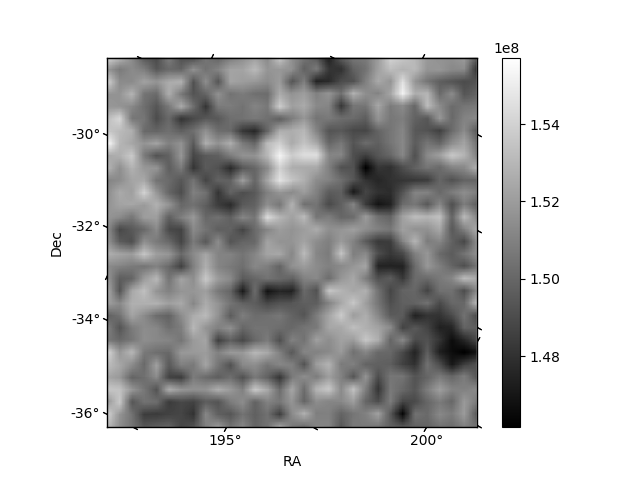
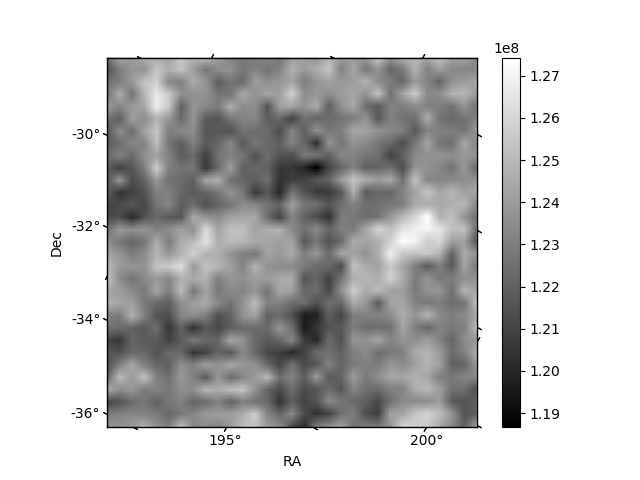
Histogram calculated using DETX and DETY for each event in the final _common_clean file
| Quadrant A | 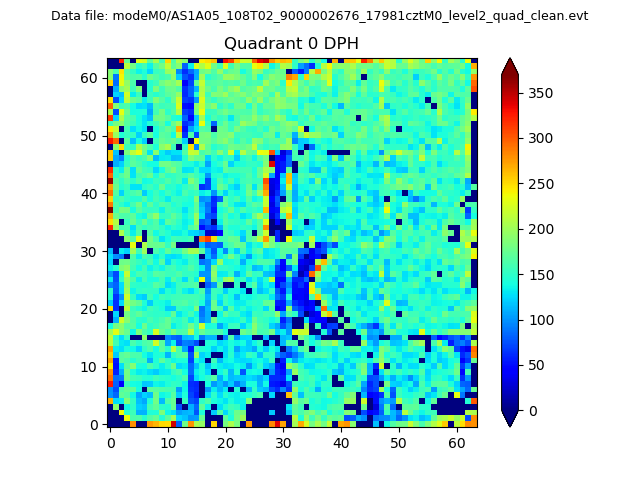 |
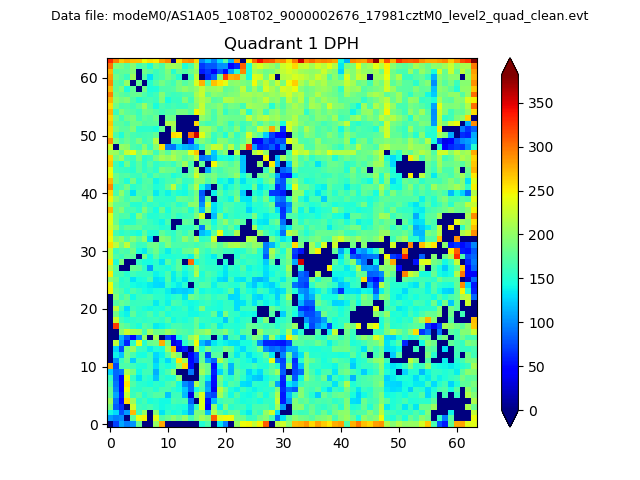 |
Quadrant B |
|---|---|---|---|
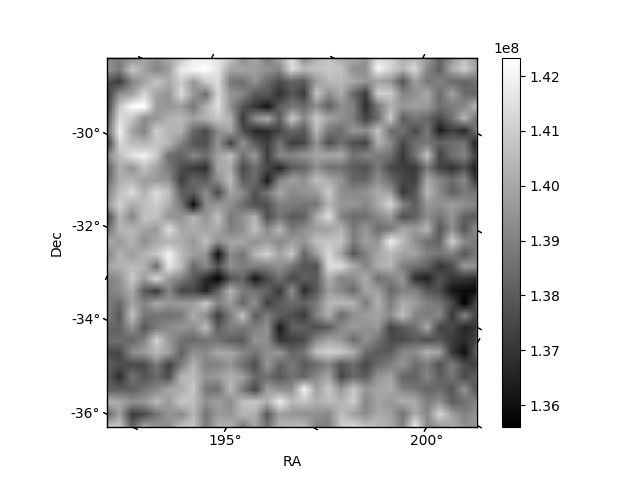
| Quadrant D | 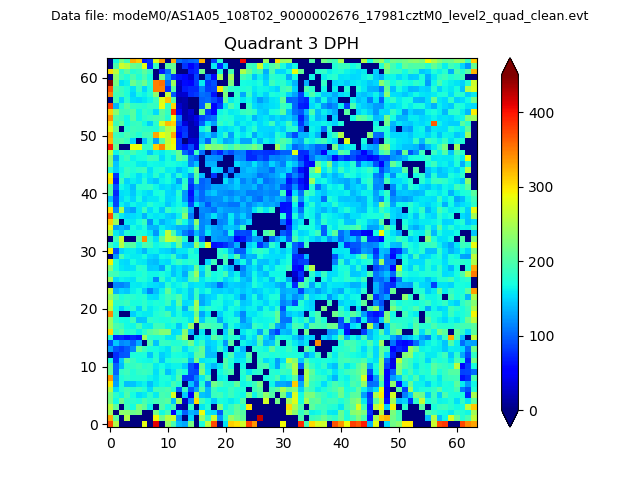 |
 |
Quadrant C |
| Plot type | Count rate plots | Images |
|---|---|---|
| Comparison with Poisson distribution Blue bars denote a histogram of data divided into 1 sec bins. Red curve is a Poisson curve with rate = median count rate of data. |
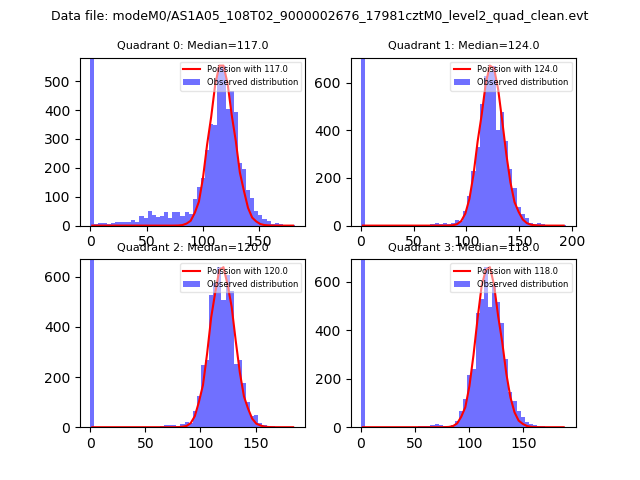 |
 |
| Quadrant-wise count rates Data is divided into 100 sec bins |
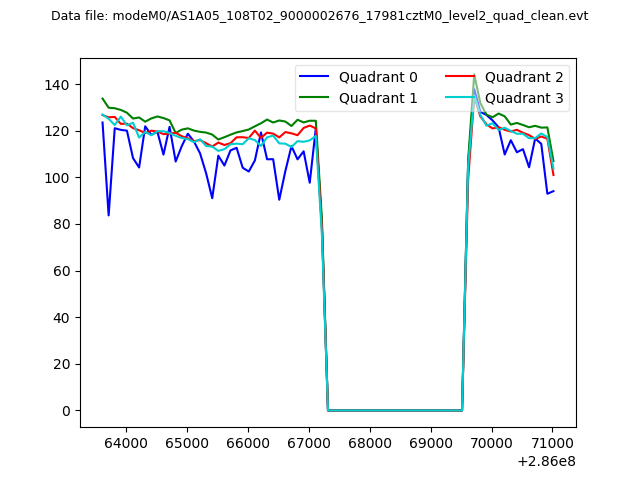 |
|
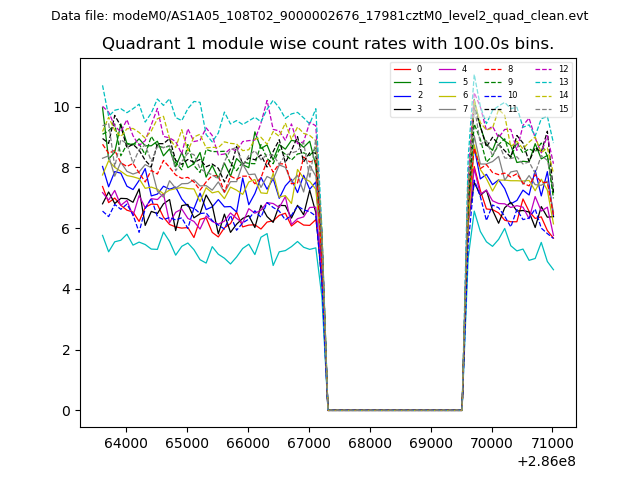
| Module-wise count rates for Quadrant A Data is divided into 100 sec bins |
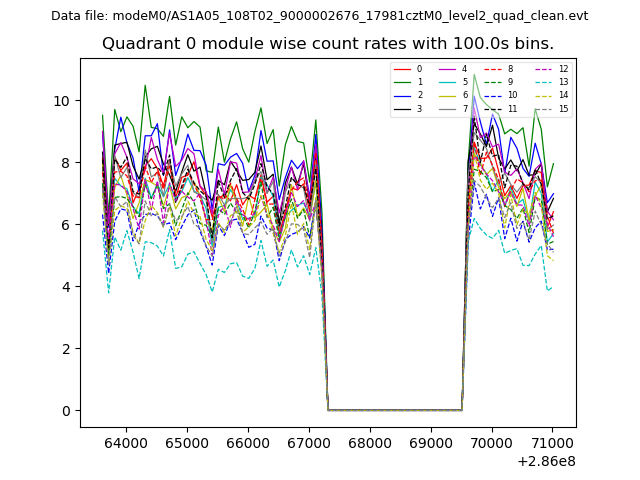 |
 |
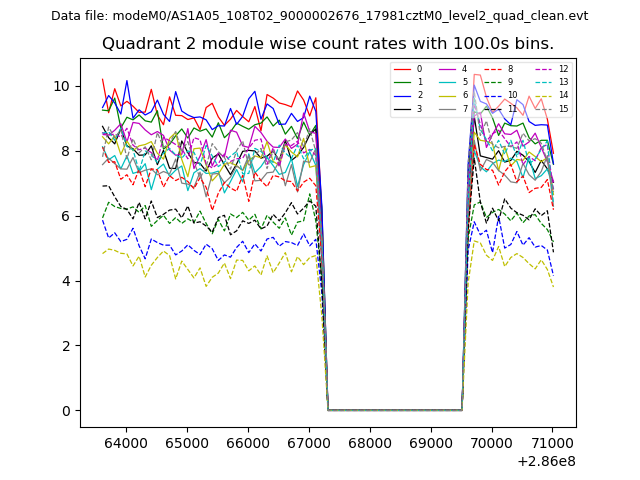
| Module-wise count rates for Quadrant B Data is divided into 100 sec bins |
 |
 |
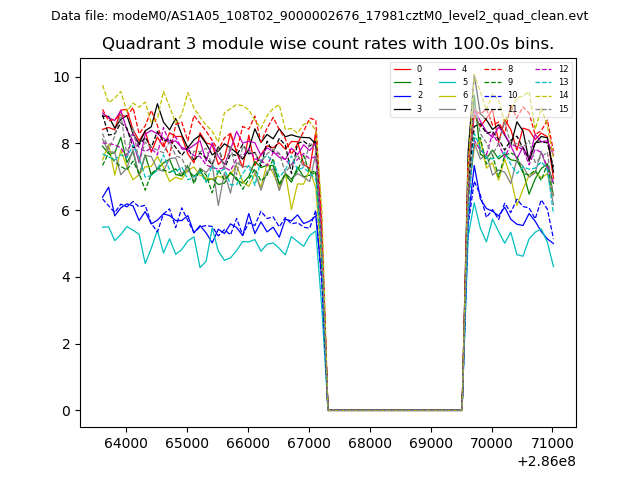
| Module-wise count rates for Quadrant C Data is divided into 100 sec bins |
 |
 |
| Module-wise count rates for Quadrant D Data is divided into 100 sec bins |
 |
 |
| Parameter | Plot |
|---|---|
| CZT HV Monitor | 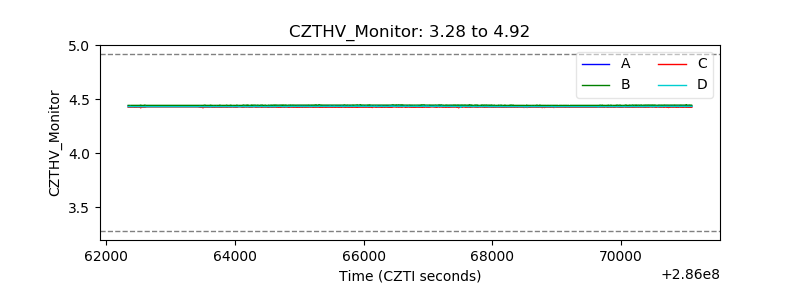 |
| D_VDD | 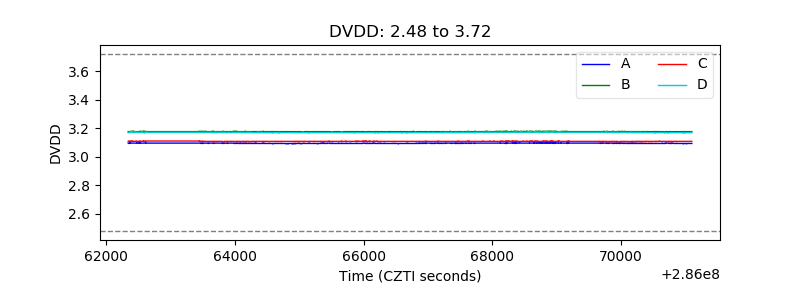 |
| Temperature 1 | 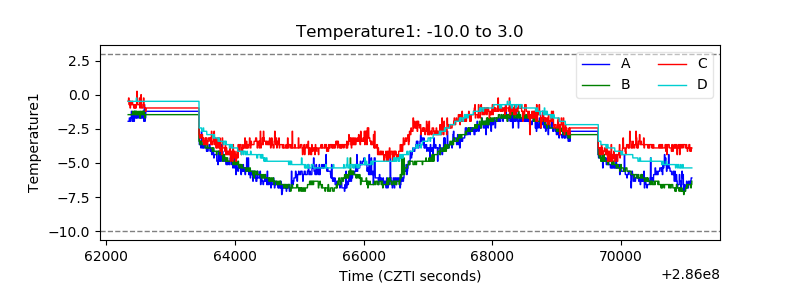 |
| Veto HV Monitor | 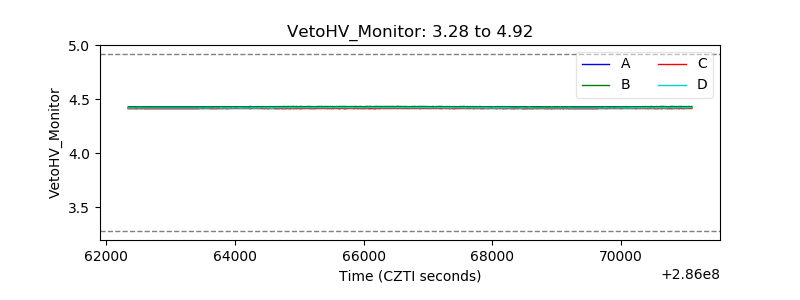 |
| Veto LLD | 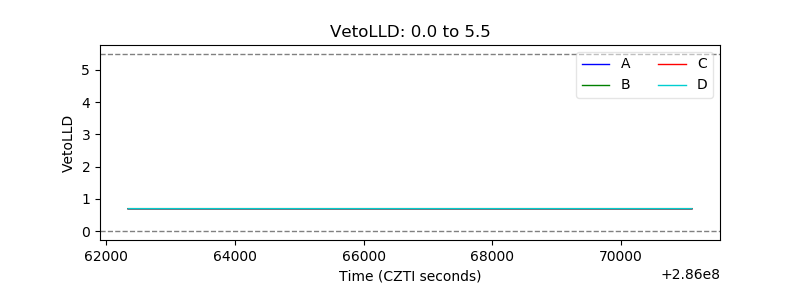 |
| Alpha Counter | 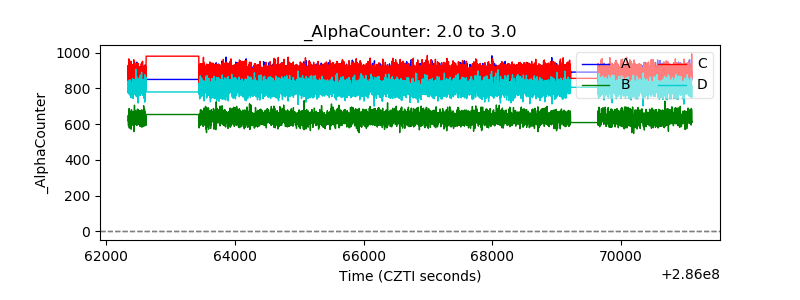 |
| _CPM_Rate | 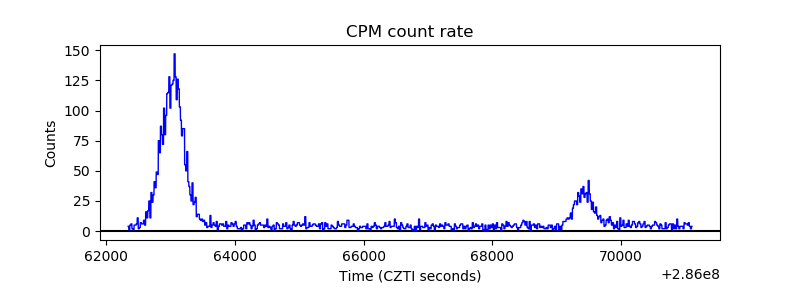 |
| CZT Counter |  |
| +2.5 Volts monitor |  |
| +5 Volts monitor |  |
| _ROLL_ROT | 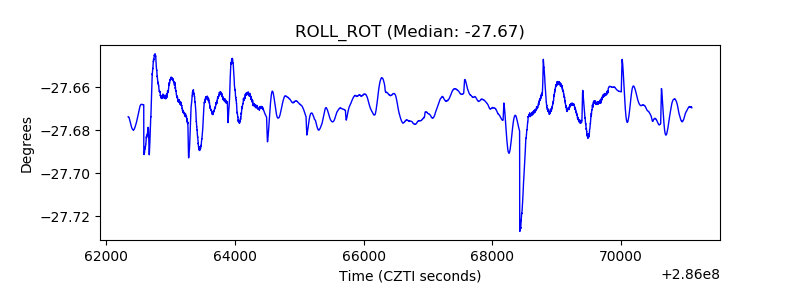 |
| _Roll_DEC | 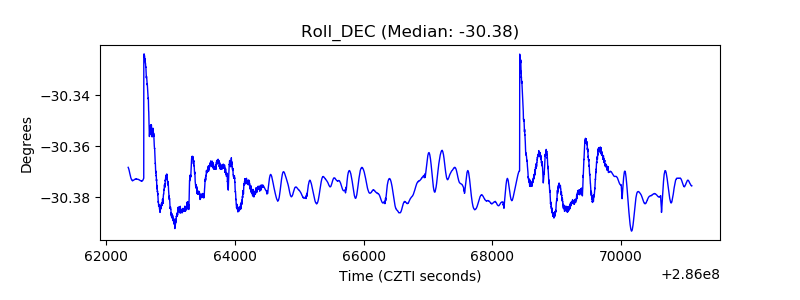 |
| _Roll_RA | 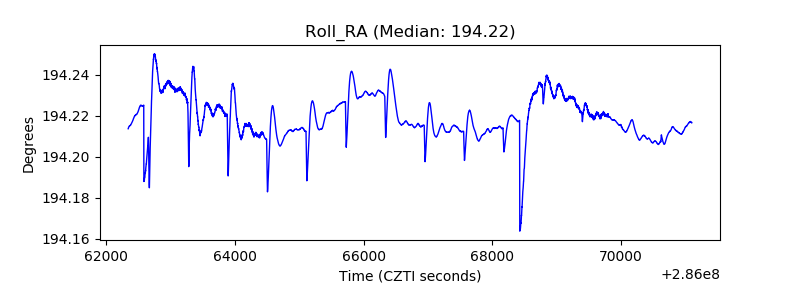 |
| Veto Counter | 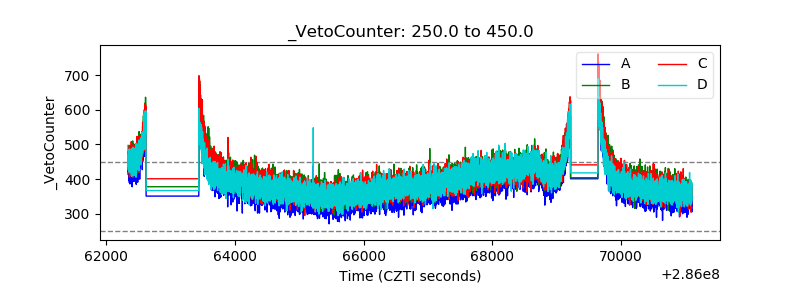 |