| Param | Original file | Final file |
|---|---|---|
| Filename | modeM0/AS1A05_108T02_9000002676_17986cztM0_level2.evt | modeM0/AS1A05_108T02_9000002676_17986cztM0_level2_quad_clean.evt |
| Size (bytes) | 1,096,041,600 | 171,982,080 |
| Size | 1.0 GB | 164.0 MB |
| Events in quadrant A | 10,358,759 | 1,041,244 |
| Events in quadrant B | 6,802,880 | 1,098,477 |
| Events in quadrant C | 6,856,336 | 1,060,602 |
| Events in quadrant D | 8,229,493 | 1,041,115 |
| Mode SS | |||
|---|---|---|---|
| Quadrant | BADHDUFLAG | Total packets | Discarded packets |
| A | 0 | 286 | 0 |
| B | 0 | 286 | 0 |
| C | 0 | 288 | 0 |
| D | 0 | 288 | 0 |
| Mode M9 | |||
|---|---|---|---|
| Quadrant | BADHDUFLAG | Total packets | Discarded packets |
| A | 0 | 11 | 0 |
| B | 0 | 11 | 0 |
| C | 0 | 11 | 0 |
| D | 0 | 11 | 0 |
| Mode M0 | |||
|---|---|---|---|
| Quadrant | BADHDUFLAG | Total packets | Discarded packets |
| A | 0 | 39834 | 3 |
| B | 0 | 29571 | 3 |
| C | 0 | 29164 | 3 |
| D | 0 | 34392 | 3 |
| Quadrant | Total seconds | Saturated seconds | Saturation percentage |
|---|---|---|---|
| A | 13999 | 853 | 6.093292% |
| B | 13999 | 149 | 1.064362% |
| C | 13999 | 207 | 1.478677% |
| D | 14000 | 520 | 3.714286% |
Noise dominated data is calculated using 1-second bins in cleaned event files. If a bin has >2000 counts, and if more than 50% of those come from <1% of pixels, then it is considered to be noise-dominated and hence unusable.
| Quadrant | # 1 sec bins | Bins with >0 counts | Bins with >2000 counts | High rate bins dominated by noise | Noise dominated (total time) | Noise dominated (detector-on time) | Marked lightcurve |
|---|---|---|---|---|---|---|---|
| A | 15164 | 14002 | 608 | 608 | 4.01% | 4.34% | 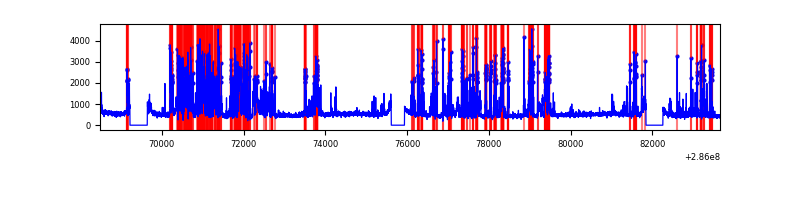 |
| B | 15164 | 14002 | 10 | 10 | 0.07% | 0.07% | 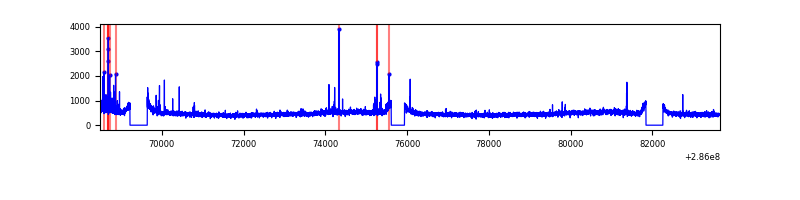 |
| C | 15164 | 14002 | 4 | 4 | 0.03% | 0.03% | 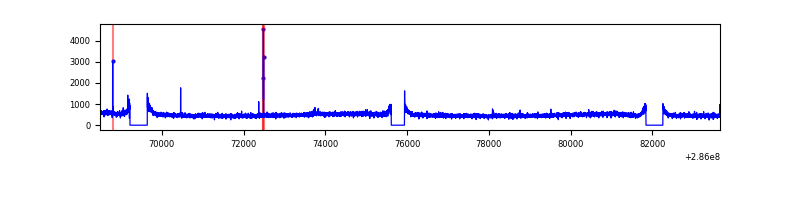 |
| D | 15165 | 14003 | 386 | 386 | 2.55% | 2.76% | 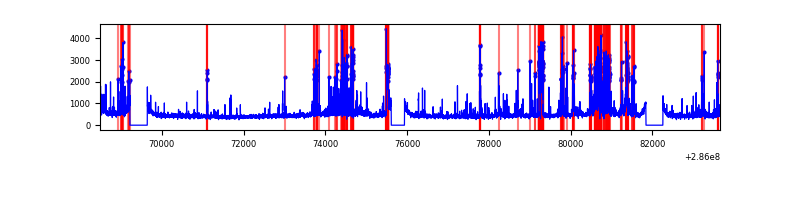 |
Top three noisy pixels from each quadrant. If the there are fewer than three noisy pixels in the level2.evt file, extra rows are filled as -1
| Pixel properties | Quadrant properties | ||||||
|---|---|---|---|---|---|---|---|
| Quadrant | DetID | PixID | Counts | Sigma | Mean | Median | Sigma |
| A | 14 | 237 | 3837066 | 11438.87 | 1655 | 1616 | 335.3 |
| A | 15 | 174 | 139761 | 412.0 | 1655 | 1616 | 335.3 |
| A | 4 | 2 | 24930 | 69.53 | 1655 | 1616 | 335.3 |
| B | 7 | 220 | 69762 | 209.4 | 1684 | 1637 | 325.3 |
| B | 12 | 111 | 39395 | 116.06 | 1684 | 1637 | 325.3 |
| B | 11 | 111 | 33825 | 98.94 | 1684 | 1637 | 325.3 |
| C | 14 | 238 | 248821 | 645.88 | 1627 | 1642 | 382.7 |
| C | 3 | 233 | 235986 | 612.34 | 1627 | 1642 | 382.7 |
| C | 9 | 160 | 18619 | 44.36 | 1627 | 1642 | 382.7 |
| D | 7 | 238 | 906363 | 2215.49 | 1612 | 1571 | 408.4 |
| D | 5 | 222 | 514234 | 1255.31 | 1612 | 1571 | 408.4 |
| D | 11 | 176 | 479572 | 1170.44 | 1612 | 1571 | 408.4 |
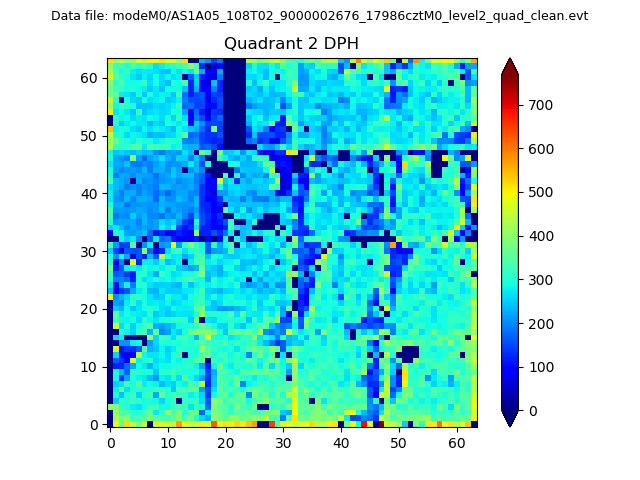
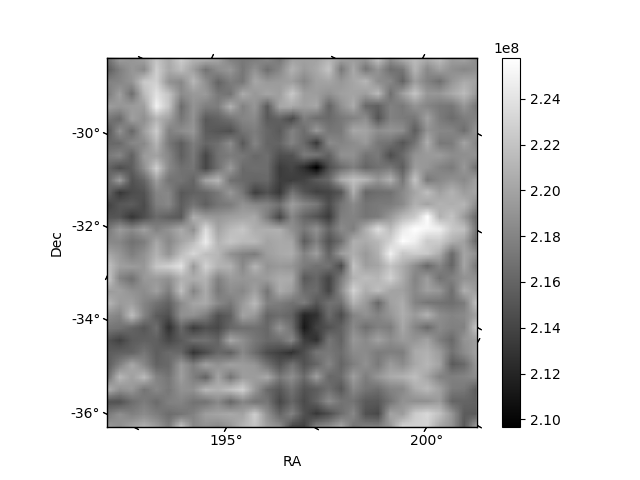
Histogram calculated using DETX and DETY for each event in the final _common_clean file
| Quadrant A | 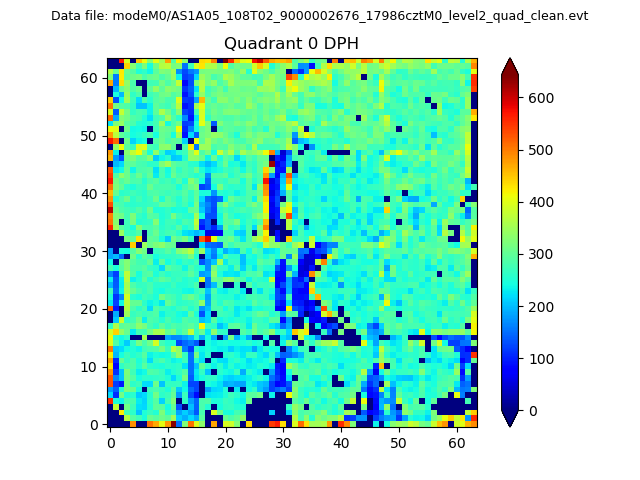 |
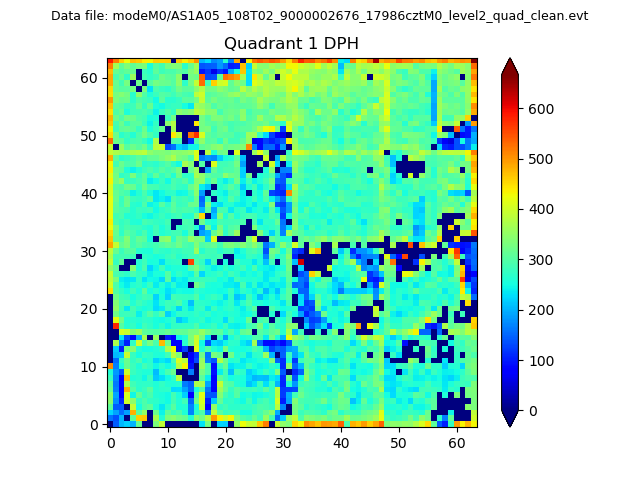 |
Quadrant B |
|---|---|---|---|
| Quadrant D | 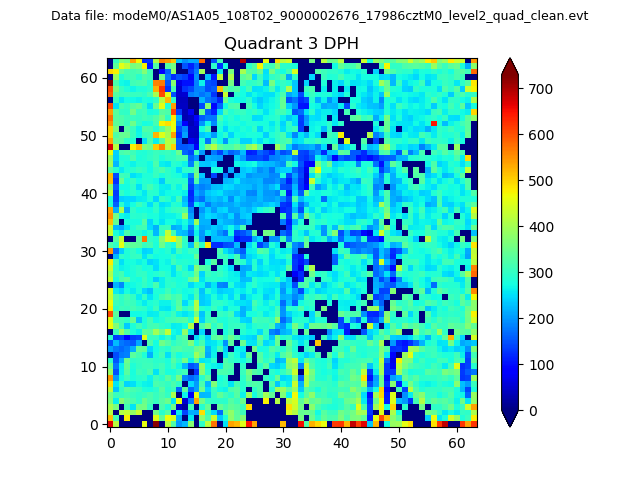 |
 |
Quadrant C |
| Plot type | Count rate plots | Images |
|---|---|---|
| Comparison with Poisson distribution Blue bars denote a histogram of data divided into 1 sec bins. Red curve is a Poisson curve with rate = median count rate of data. |
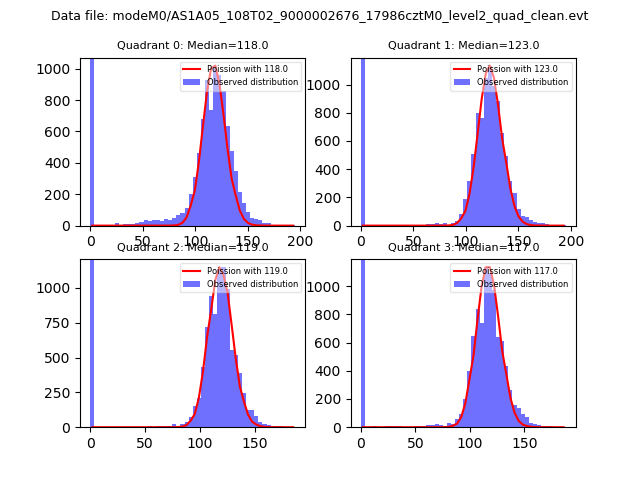 |
 |
| Quadrant-wise count rates Data is divided into 100 sec bins |
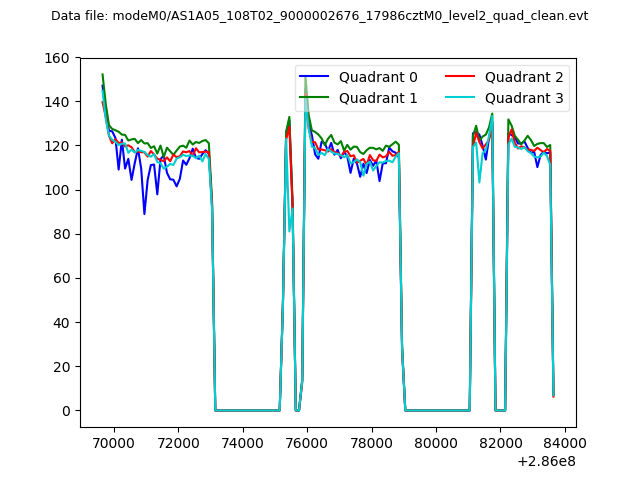 |
|
| Module-wise count rates for Quadrant A Data is divided into 100 sec bins |
 |
 |
| Module-wise count rates for Quadrant B Data is divided into 100 sec bins |
 |
 |
| Module-wise count rates for Quadrant C Data is divided into 100 sec bins |
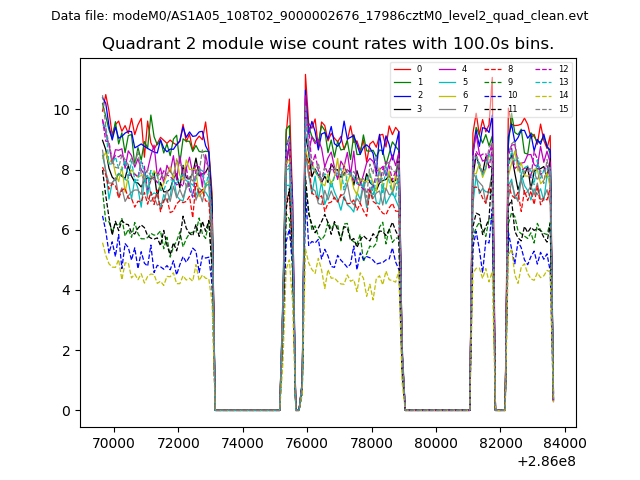 |
 |
| Module-wise count rates for Quadrant D Data is divided into 100 sec bins |
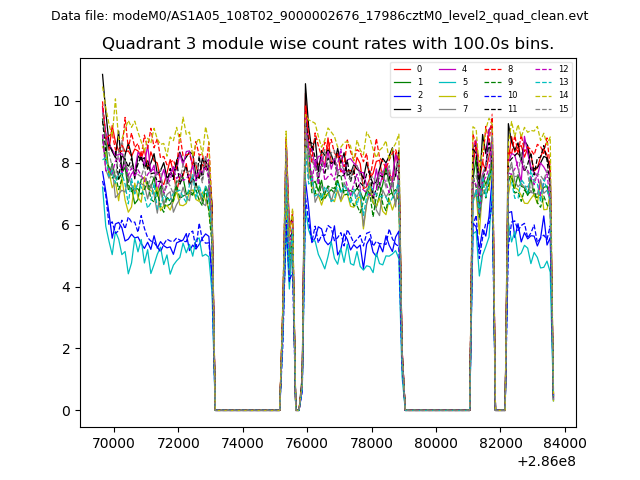 |
 |
| Parameter | Plot |
|---|---|
| CZT HV Monitor | 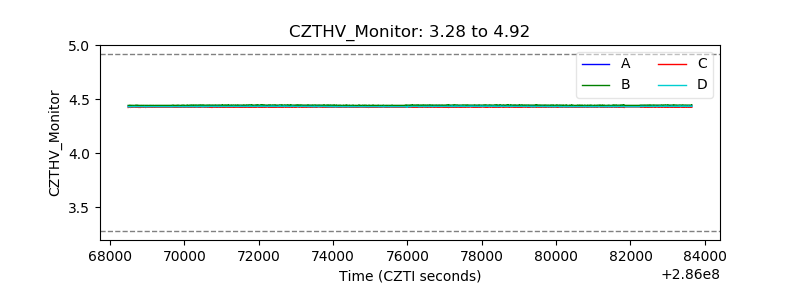 |
| D_VDD | 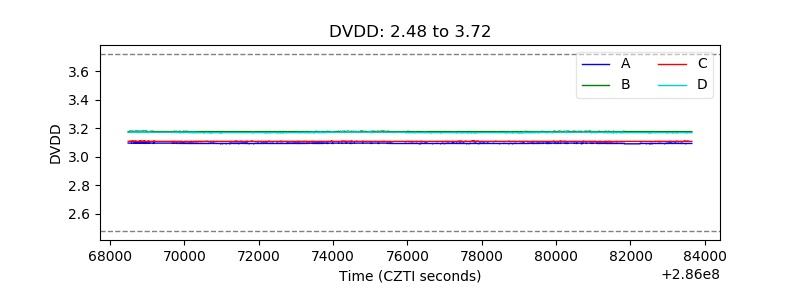 |
| Temperature 1 | 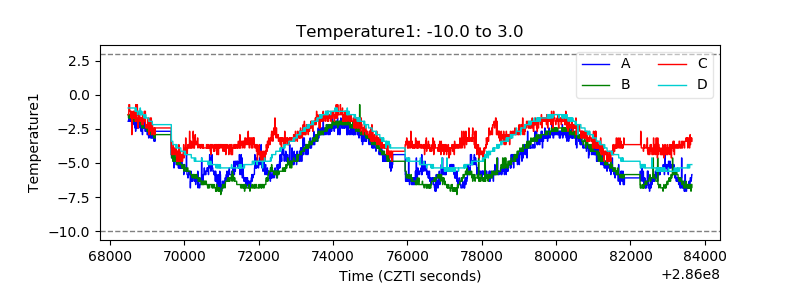 |
| Veto HV Monitor | 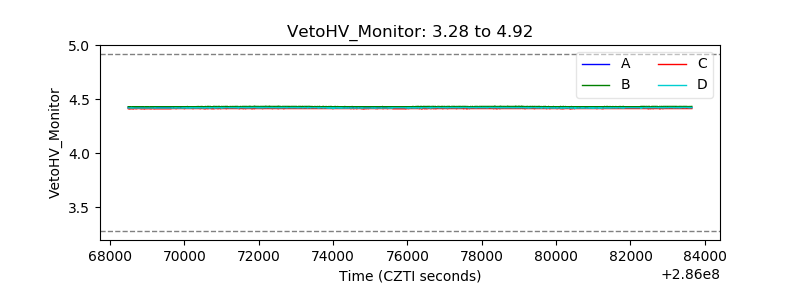 |
| Veto LLD | 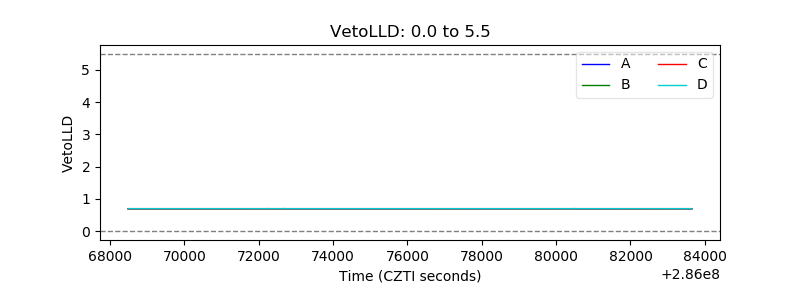 |
| Alpha Counter | 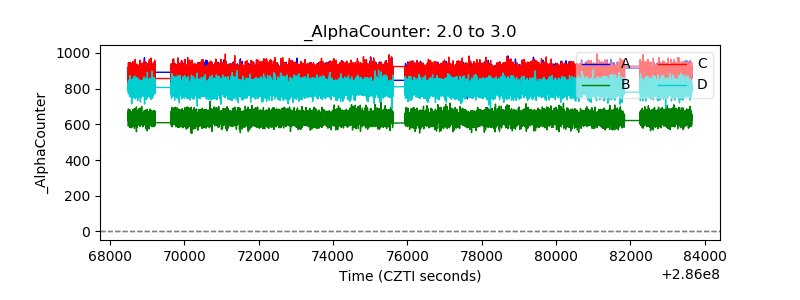 |
| _CPM_Rate | 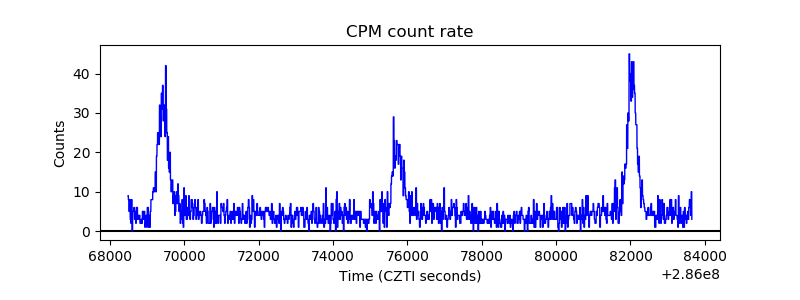 |
| CZT Counter | 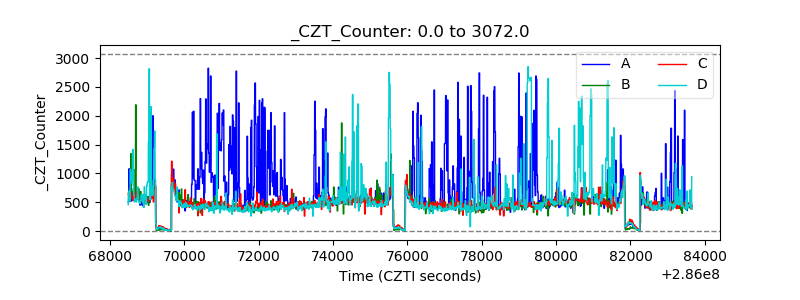 |
| +2.5 Volts monitor | 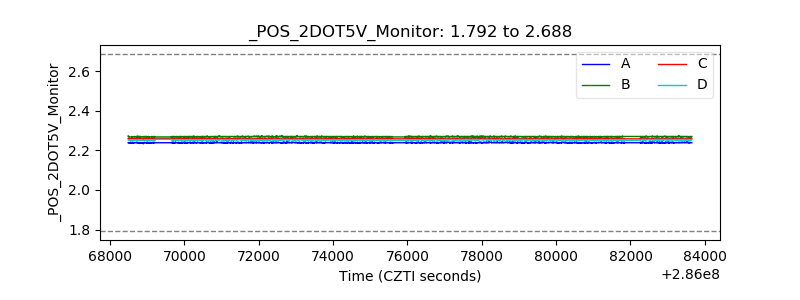 |
| +5 Volts monitor |  |
| _ROLL_ROT | 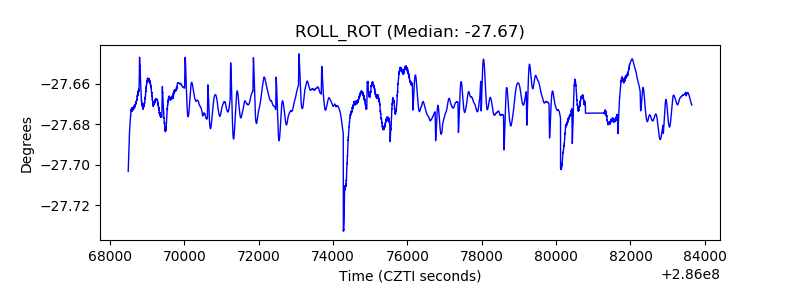 |
| _Roll_DEC | 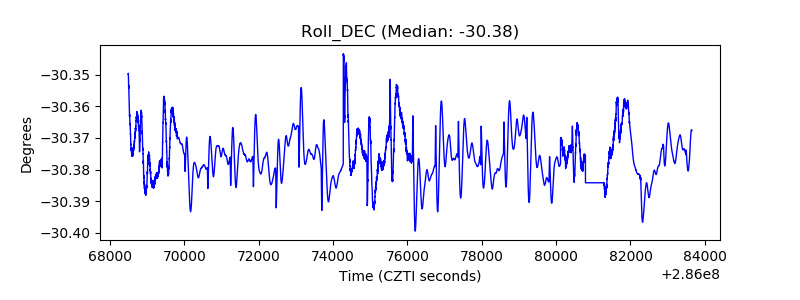 |
| _Roll_RA | 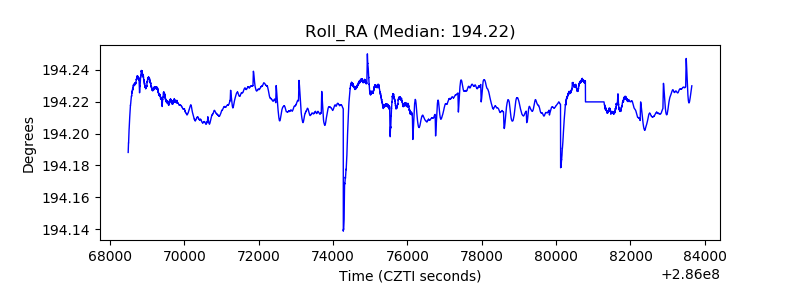 |
| Veto Counter | 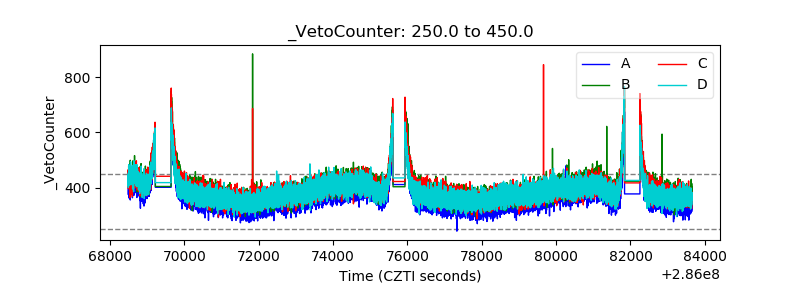 |