| Param | Original file | Final file |
|---|---|---|
| Filename | modeM0/AS1A05_108T02_9000002676_17987cztM0_level2.evt | modeM0/AS1A05_108T02_9000002676_17987cztM0_level2_quad_clean.evt |
| Size (bytes) | 1,566,930,240 | 264,856,320 |
| Size | 1.5 GB | 252.6 MB |
| Events in quadrant A | 12,137,002 | 1,631,812 |
| Events in quadrant B | 10,449,597 | 1,673,674 |
| Events in quadrant C | 10,779,948 | 1,609,302 |
| Events in quadrant D | 12,590,786 | 1,581,229 |
| Mode SS | |||
|---|---|---|---|
| Quadrant | BADHDUFLAG | Total packets | Discarded packets |
| A | 0 | 454 | 0 |
| B | 0 | 454 | 0 |
| C | 0 | 454 | 0 |
| D | 0 | 454 | 0 |
| Mode M9 | |||
|---|---|---|---|
| Quadrant | BADHDUFLAG | Total packets | Discarded packets |
| A | 0 | 30 | 0 |
| B | 0 | 30 | 0 |
| C | 0 | 30 | 0 |
| D | 0 | 30 | 0 |
| Mode M0 | |||
|---|---|---|---|
| Quadrant | BADHDUFLAG | Total packets | Discarded packets |
| A | 0 | 50554 | 4 |
| B | 0 | 45256 | 4 |
| C | 0 | 45932 | 4 |
| D | 0 | 52147 | 4 |
| Quadrant | Total seconds | Saturated seconds | Saturation percentage |
|---|---|---|---|
| A | 22152 | 458 | 2.067533% |
| B | 22153 | 196 | 0.884756% |
| C | 22153 | 328 | 1.480612% |
| D | 22153 | 476 | 2.148693% |
Noise dominated data is calculated using 1-second bins in cleaned event files. If a bin has >2000 counts, and if more than 50% of those come from <1% of pixels, then it is considered to be noise-dominated and hence unusable.
| Quadrant | # 1 sec bins | Bins with >0 counts | Bins with >2000 counts | High rate bins dominated by noise | Noise dominated (total time) | Noise dominated (detector-on time) | Marked lightcurve |
|---|---|---|---|---|---|---|---|
| A | 25307 | 22155 | 213 | 213 | 0.84% | 0.96% | 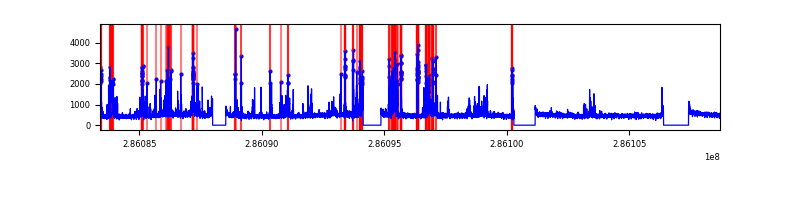 |
| B | 25308 | 22156 | 3 | 3 | 0.01% | 0.01% | 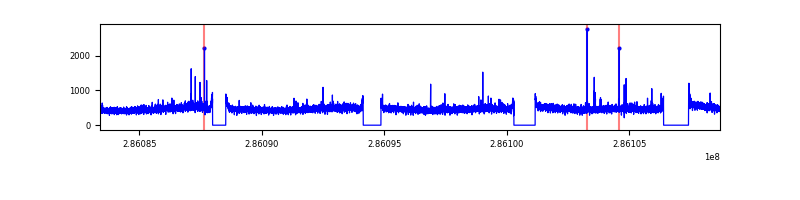 |
| C | 25308 | 22156 | 24 | 24 | 0.09% | 0.11% | 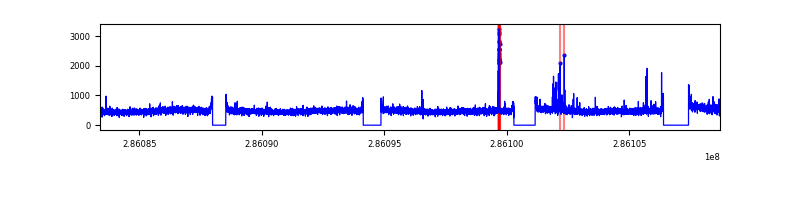 |
| D | 25308 | 22156 | 272 | 272 | 1.07% | 1.23% | 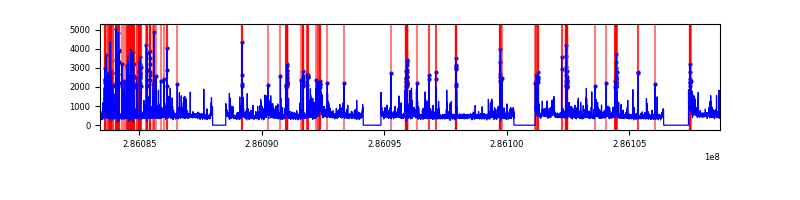 |
Top three noisy pixels from each quadrant. If the there are fewer than three noisy pixels in the level2.evt file, extra rows are filled as -1
| Pixel properties | Quadrant properties | ||||||
|---|---|---|---|---|---|---|---|
| Quadrant | DetID | PixID | Counts | Sigma | Mean | Median | Sigma |
| A | 14 | 237 | 1934480 | 3632.24 | 2645 | 2584 | 531.9 |
| A | 4 | 2 | 35024 | 60.99 | 2645 | 2584 | 531.9 |
| A | 0 | 226 | 23042 | 38.46 | 2645 | 2584 | 531.9 |
| B | 12 | 111 | 61999 | 117.56 | 2651 | 2584 | 505.4 |
| B | 11 | 111 | 53859 | 101.45 | 2651 | 2584 | 505.4 |
| B | 14 | 111 | 45568 | 85.05 | 2651 | 2584 | 505.4 |
| C | 14 | 238 | 396660 | 654.02 | 2572 | 2586 | 602.5 |
| C | 0 | 207 | 196874 | 322.45 | 2572 | 2586 | 602.5 |
| C | 3 | 233 | 146159 | 238.28 | 2572 | 2586 | 602.5 |
| D | 5 | 222 | 957279 | 1397.97 | 2577 | 2528 | 683.0 |
| D | 7 | 238 | 801519 | 1169.9 | 2577 | 2528 | 683.0 |
| D | 11 | 176 | 719517 | 1049.84 | 2577 | 2528 | 683.0 |
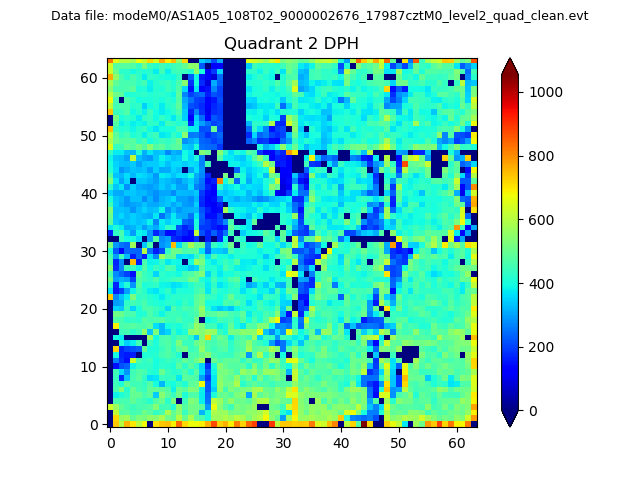
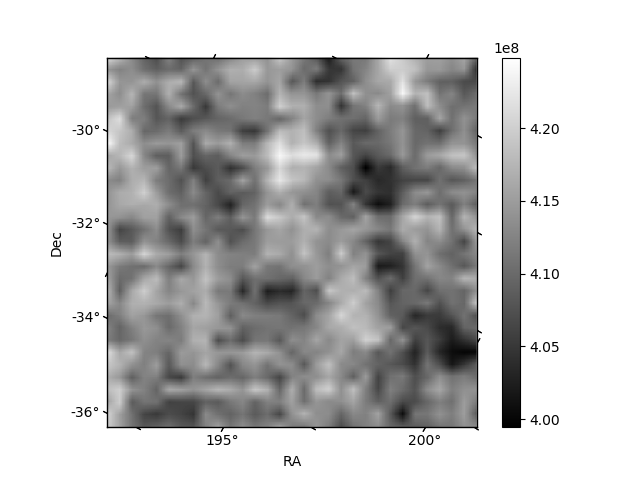
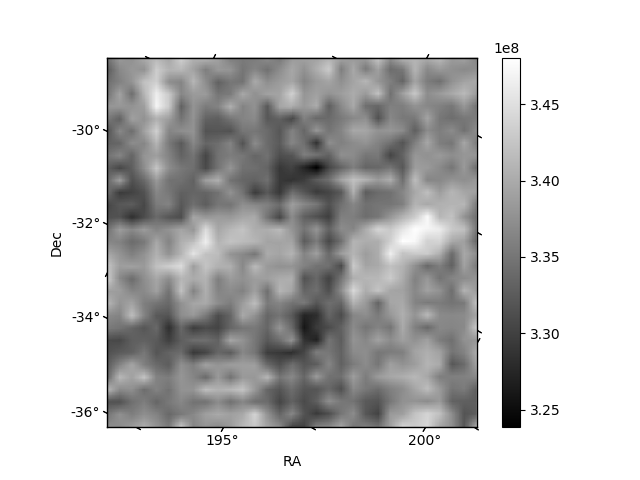
Histogram calculated using DETX and DETY for each event in the final _common_clean file
| Quadrant A | 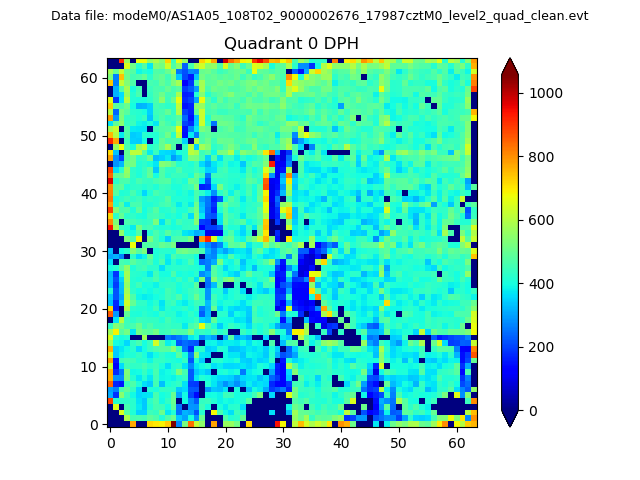 |
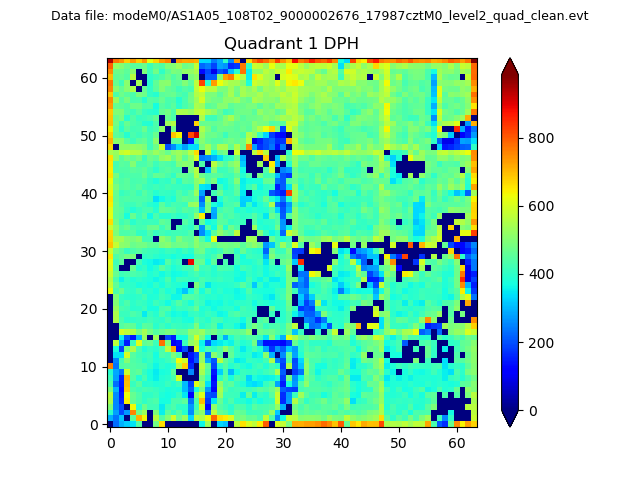 |
Quadrant B |
|---|---|---|---|
| Quadrant D | 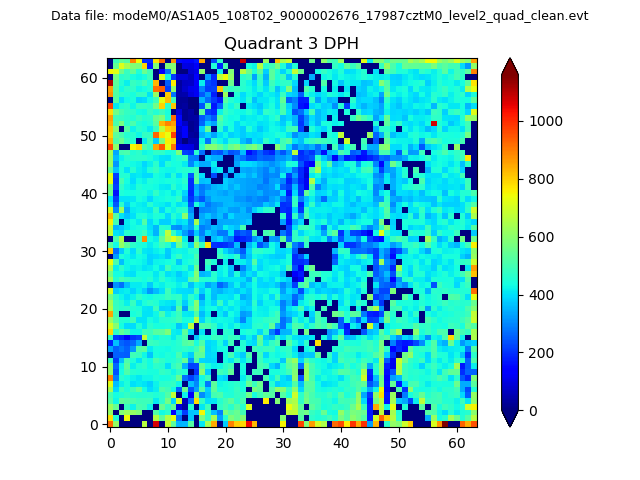 |
 |
Quadrant C |
| Plot type | Count rate plots | Images |
|---|---|---|
| Comparison with Poisson distribution Blue bars denote a histogram of data divided into 1 sec bins. Red curve is a Poisson curve with rate = median count rate of data. |
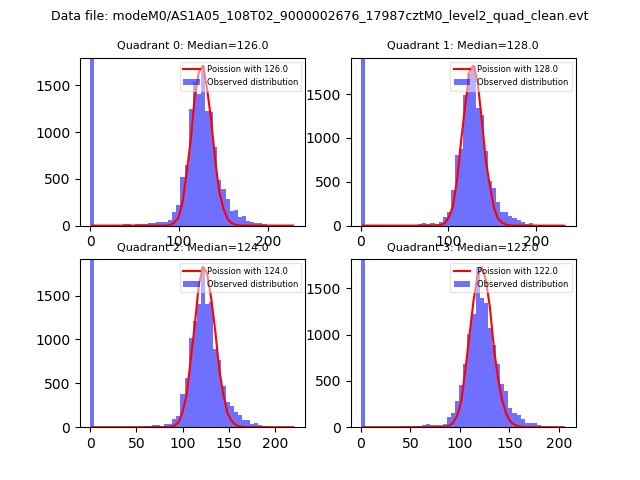 |
 |
| Quadrant-wise count rates Data is divided into 100 sec bins |
 |
|
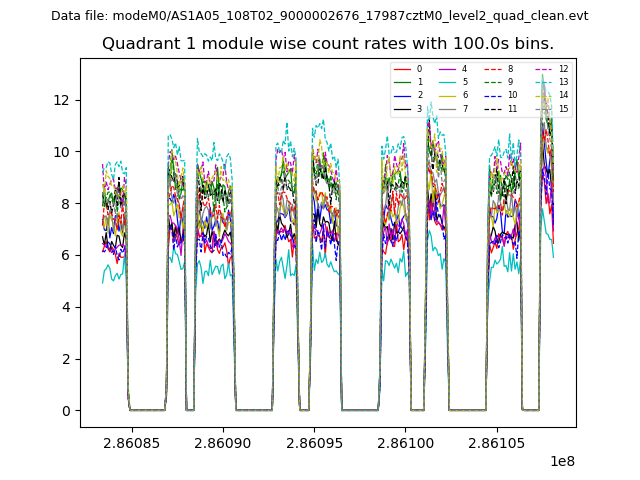
| Module-wise count rates for Quadrant A Data is divided into 100 sec bins |
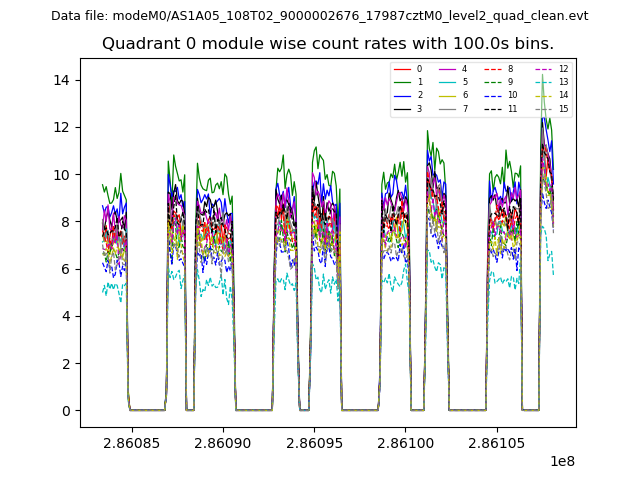 |
 |
| Module-wise count rates for Quadrant B Data is divided into 100 sec bins |
 |
 |
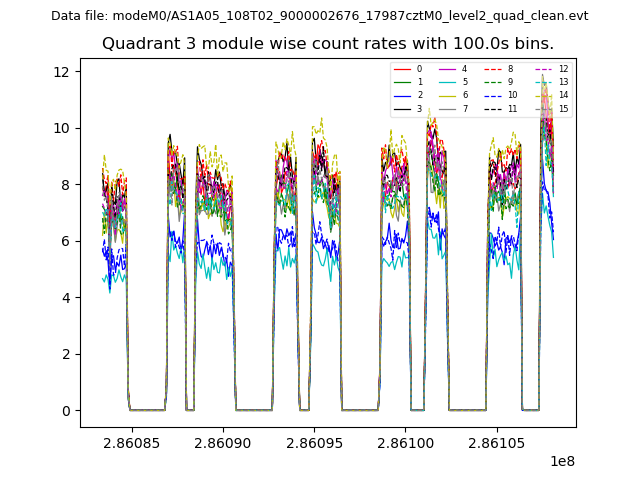
| Module-wise count rates for Quadrant C Data is divided into 100 sec bins |
 |
 |
| Module-wise count rates for Quadrant D Data is divided into 100 sec bins |
 |
 |
| Parameter | Plot |
|---|---|
| CZT HV Monitor |  |
| D_VDD | 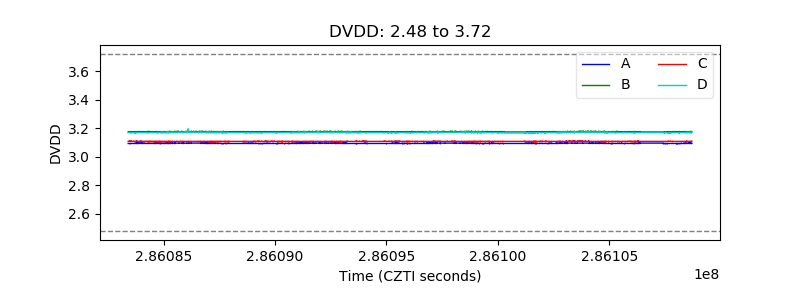 |
| Temperature 1 | 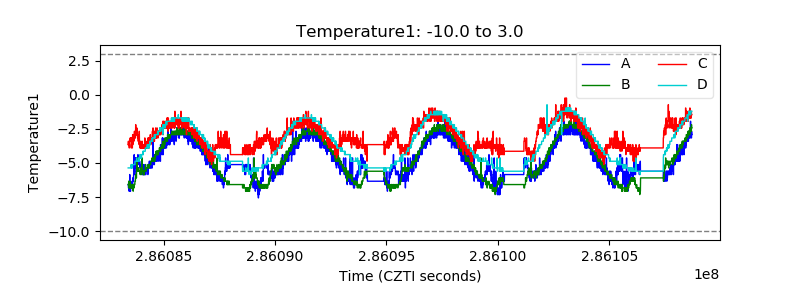 |
| Veto HV Monitor | 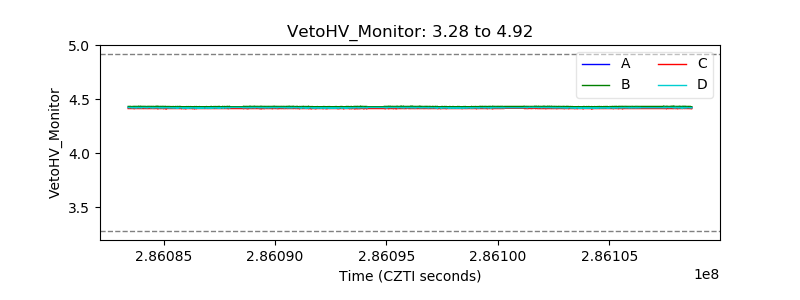 |
| Veto LLD | 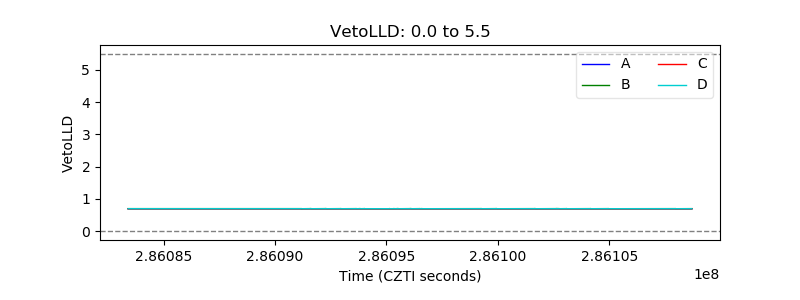 |
| Alpha Counter | 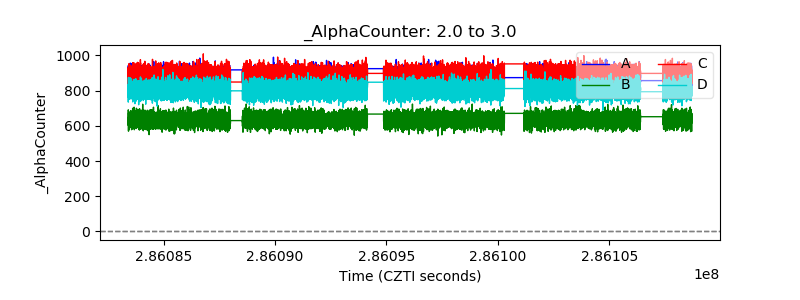 |
| _CPM_Rate | 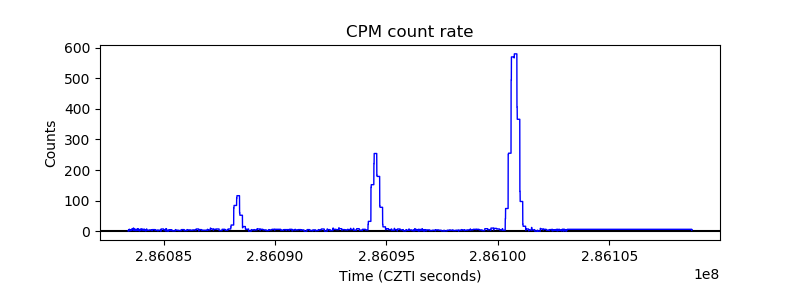 |
| CZT Counter | 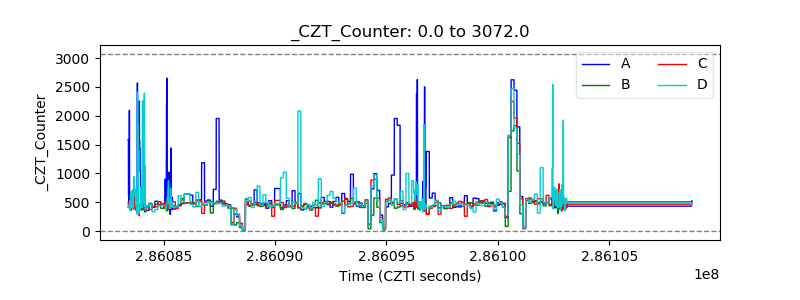 |
| +2.5 Volts monitor |  |
| +5 Volts monitor |  |
| _ROLL_ROT | 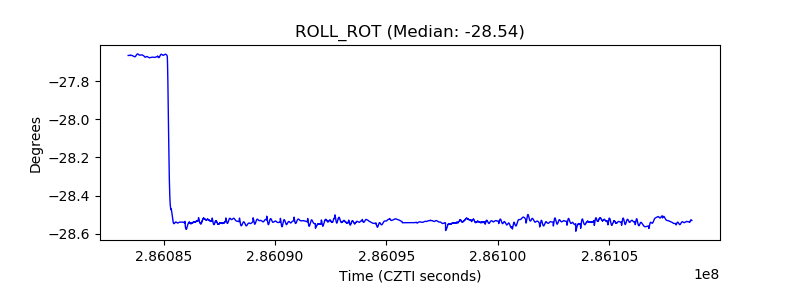 |
| _Roll_DEC | 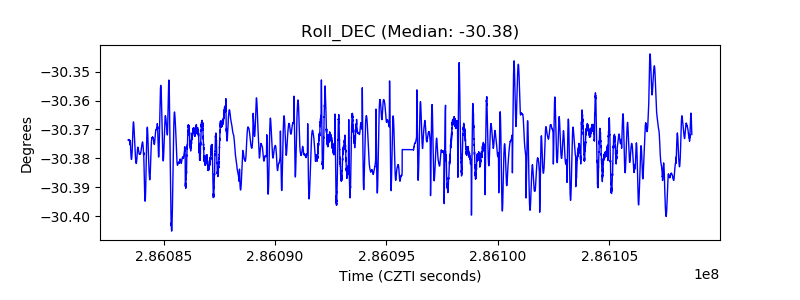 |
| _Roll_RA | 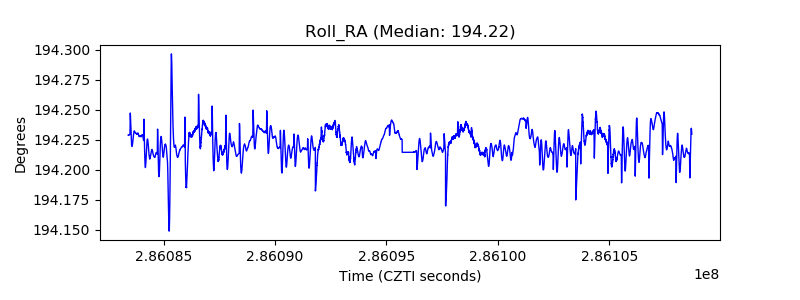 |
| Veto Counter |  |