| Param | Original file | Final file |
|---|---|---|
| Filename | modeM0/AS1A05_108T02_9000002676_17989cztM0_level2.evt | modeM0/AS1A05_108T02_9000002676_17989cztM0_level2_quad_clean.evt |
| Size (bytes) | 496,422,720 | 76,029,120 |
| Size | 473.4 MB | 72.5 MB |
| Events in quadrant A | 3,352,527 | 472,213 |
| Events in quadrant B | 3,361,107 | 477,839 |
| Events in quadrant C | 3,538,035 | 455,192 |
| Events in quadrant D | 4,346,397 | 448,379 |
| Mode SS | |||
|---|---|---|---|
| Quadrant | BADHDUFLAG | Total packets | Discarded packets |
| A | 0 | 130 | 0 |
| B | 0 | 130 | 0 |
| C | 0 | 128 | 0 |
| D | 0 | 128 | 0 |
| Mode M9 | |||
|---|---|---|---|
| Quadrant | BADHDUFLAG | Total packets | Discarded packets |
| A | 0 | 15 | 0 |
| B | 0 | 16 | 0 |
| C | 0 | 16 | 0 |
| D | 0 | 16 | 0 |
| Mode M0 | |||
|---|---|---|---|
| Quadrant | BADHDUFLAG | Total packets | Discarded packets |
| A | 0 | 14050 | 2 |
| B | 0 | 13985 | 2 |
| C | 0 | 14497 | 2 |
| D | 0 | 17094 | 2 |
| Quadrant | Total seconds | Saturated seconds | Saturation percentage |
|---|---|---|---|
| A | 6433 | 91 | 1.414581% |
| B | 6433 | 100 | 1.554485% |
| C | 6432 | 177 | 2.751866% |
| D | 6432 | 279 | 4.337687% |
Noise dominated data is calculated using 1-second bins in cleaned event files. If a bin has >2000 counts, and if more than 50% of those come from <1% of pixels, then it is considered to be noise-dominated and hence unusable.
| Quadrant | # 1 sec bins | Bins with >0 counts | Bins with >2000 counts | High rate bins dominated by noise | Noise dominated (total time) | Noise dominated (detector-on time) | Marked lightcurve |
|---|---|---|---|---|---|---|---|
| A | 7563 | 6433 | 5 | 5 | 0.07% | 0.08% | 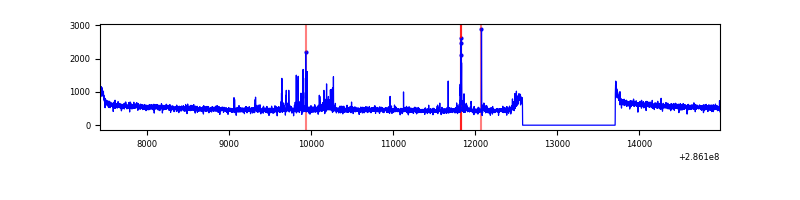 |
| B | 7563 | 6434 | 2 | 2 | 0.03% | 0.03% | 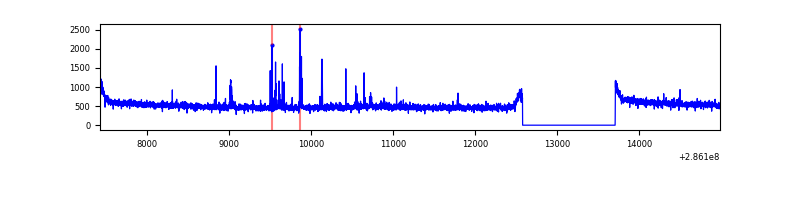 |
| C | 7562 | 6432 | 17 | 17 | 0.22% | 0.26% | 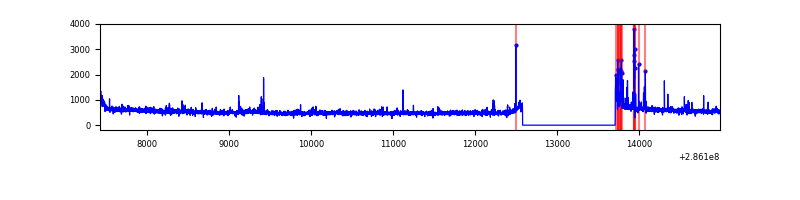 |
| D | 7562 | 6432 | 173 | 173 | 2.29% | 2.69% | 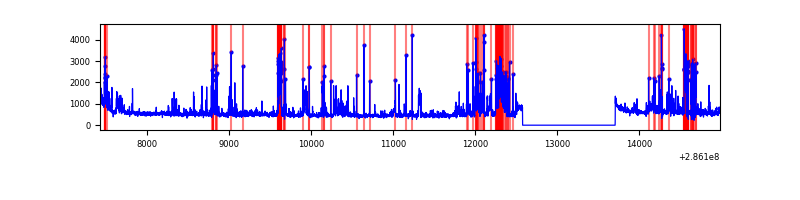 |
Top three noisy pixels from each quadrant. If the there are fewer than three noisy pixels in the level2.evt file, extra rows are filled as -1
| Pixel properties | Quadrant properties | ||||||
|---|---|---|---|---|---|---|---|
| Quadrant | DetID | PixID | Counts | Sigma | Mean | Median | Sigma |
| A | 14 | 237 | 109636 | 644.87 | 842 | 823 | 168.7 |
| A | 0 | 226 | 7445 | 39.24 | 842 | 823 | 168.7 |
| A | 12 | 194 | 6079 | 31.15 | 842 | 823 | 168.7 |
| B | 7 | 220 | 42117 | 260.23 | 835 | 812 | 158.7 |
| B | 10 | 247 | 19952 | 120.59 | 835 | 812 | 158.7 |
| B | 12 | 111 | 18266 | 109.96 | 835 | 812 | 158.7 |
| C | 0 | 207 | 155027 | 825.92 | 804 | 810 | 186.7 |
| C | 14 | 238 | 124578 | 662.84 | 804 | 810 | 186.7 |
| C | 3 | 233 | 107927 | 573.67 | 804 | 810 | 186.7 |
| D | 5 | 222 | 590428 | 2700.9 | 808 | 793 | 218.3 |
| D | 7 | 238 | 295266 | 1348.87 | 808 | 793 | 218.3 |
| D | 11 | 176 | 228136 | 1041.38 | 808 | 793 | 218.3 |
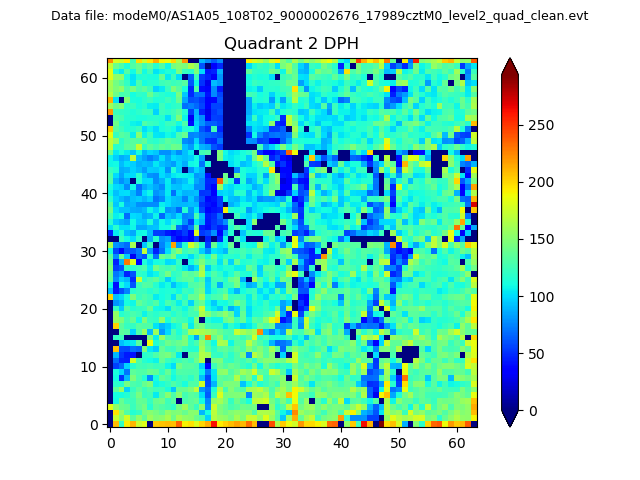
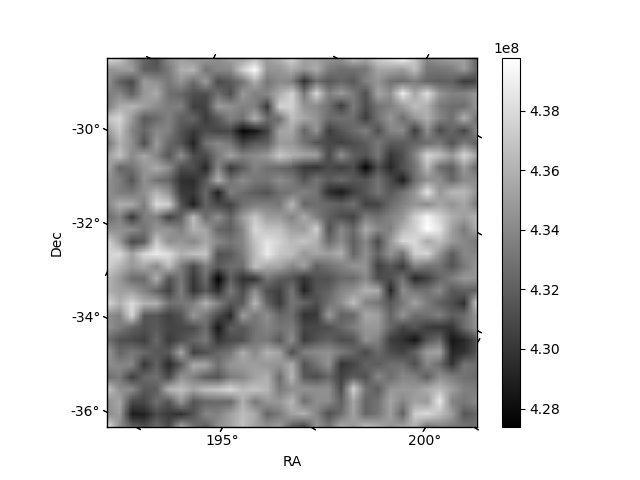
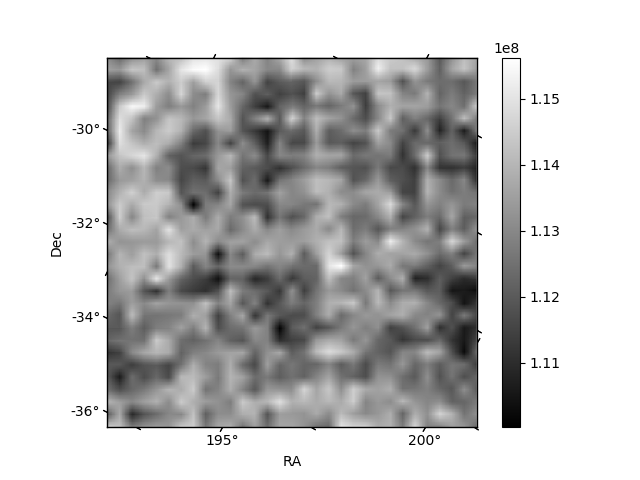
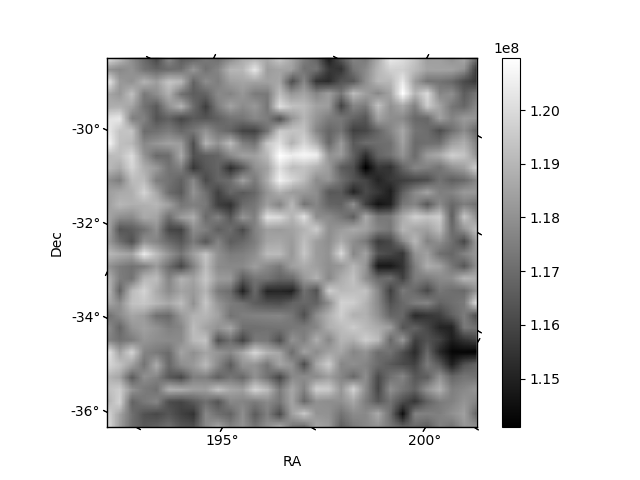
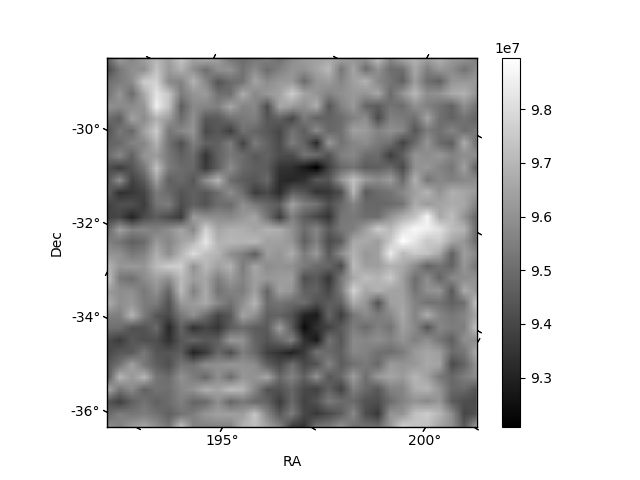
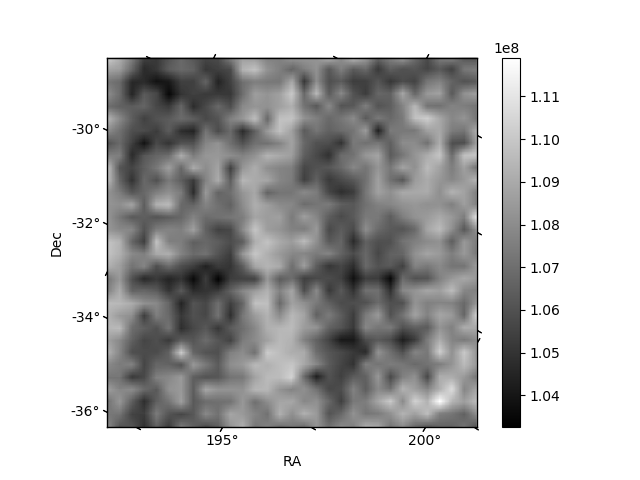
Histogram calculated using DETX and DETY for each event in the final _common_clean file
| Quadrant A | 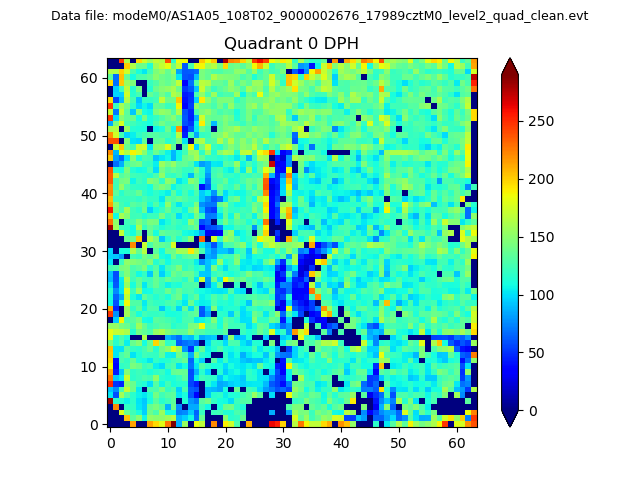 |
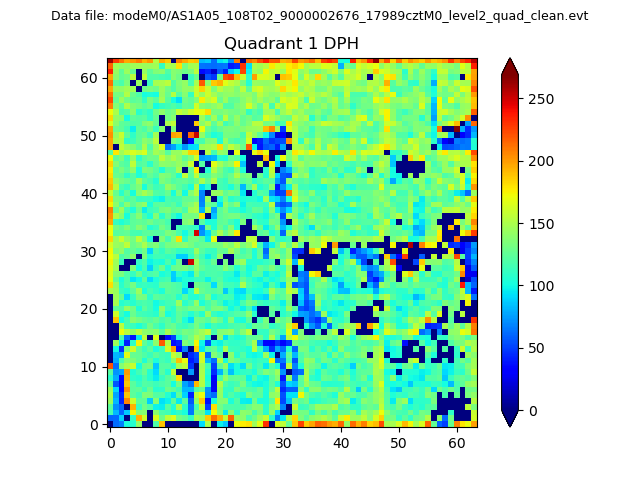 |
Quadrant B |
|---|---|---|---|
| Quadrant D | 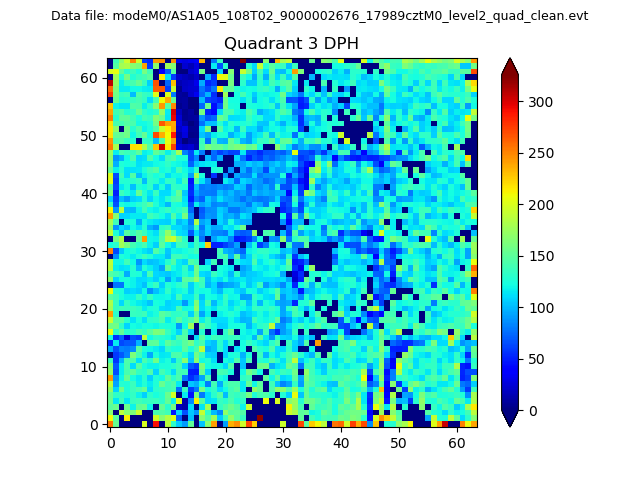 |
 |
Quadrant C |
| Plot type | Count rate plots | Images |
|---|---|---|
| Comparison with Poisson distribution Blue bars denote a histogram of data divided into 1 sec bins. Red curve is a Poisson curve with rate = median count rate of data. |
 |
 |
| Quadrant-wise count rates Data is divided into 100 sec bins |
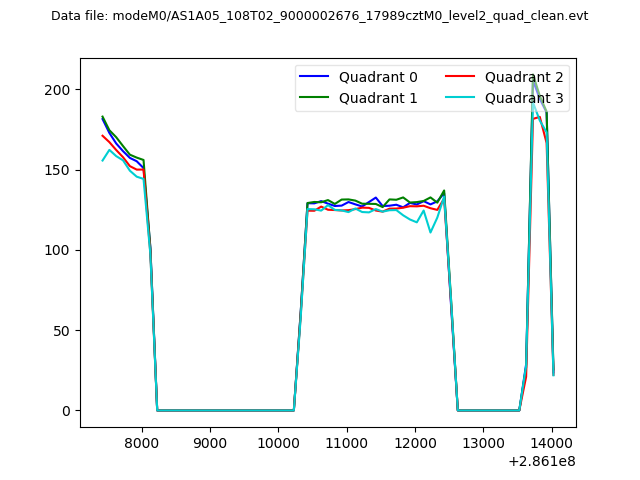 |
|
| Module-wise count rates for Quadrant A Data is divided into 100 sec bins |
 |
 |
| Module-wise count rates for Quadrant B Data is divided into 100 sec bins |
 |
 |
| Module-wise count rates for Quadrant C Data is divided into 100 sec bins |
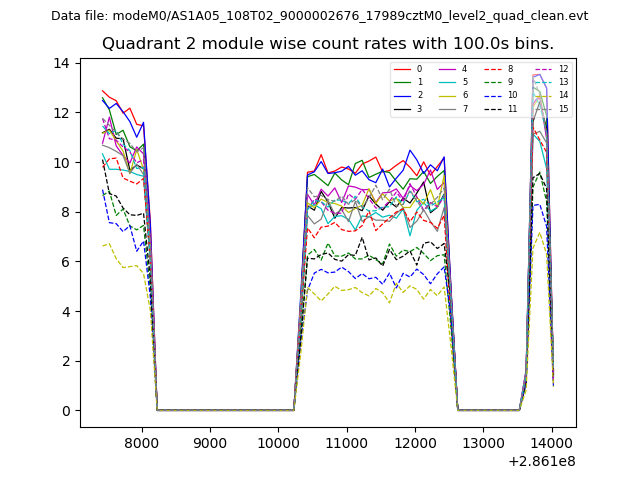 |
 |
| Module-wise count rates for Quadrant D Data is divided into 100 sec bins |
 |
 |
| Parameter | Plot |
|---|---|
| CZT HV Monitor | 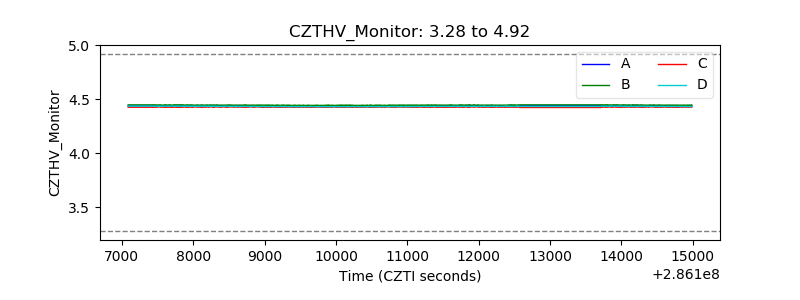 |
| D_VDD | 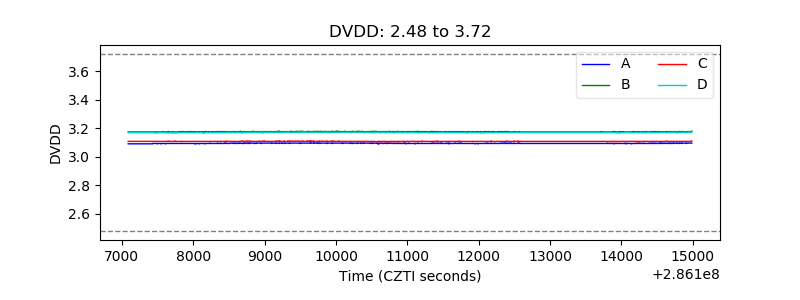 |
| Temperature 1 |  |
| Veto HV Monitor | 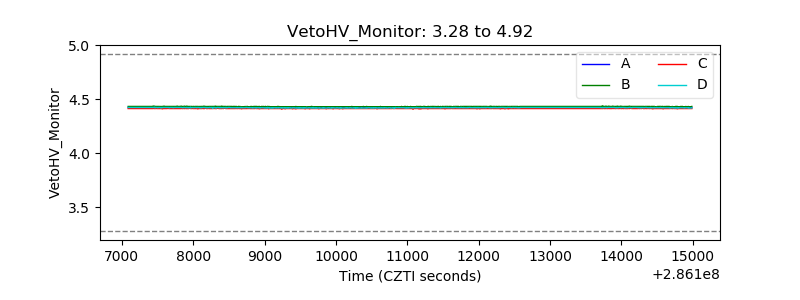 |
| Veto LLD | 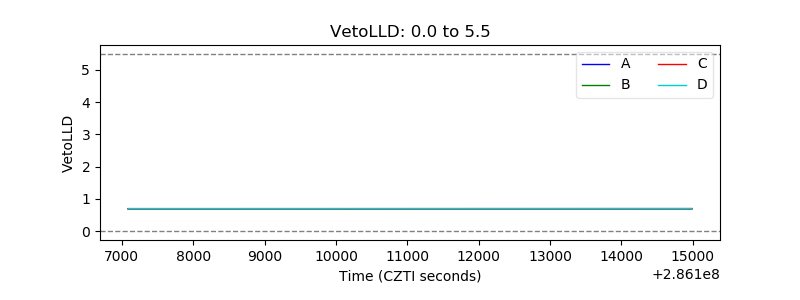 |
| Alpha Counter | 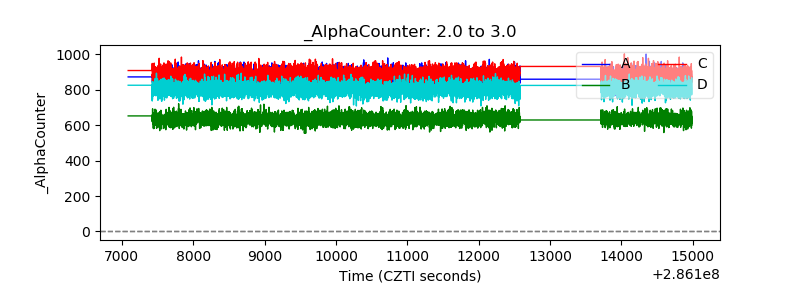 |
| _CPM_Rate | 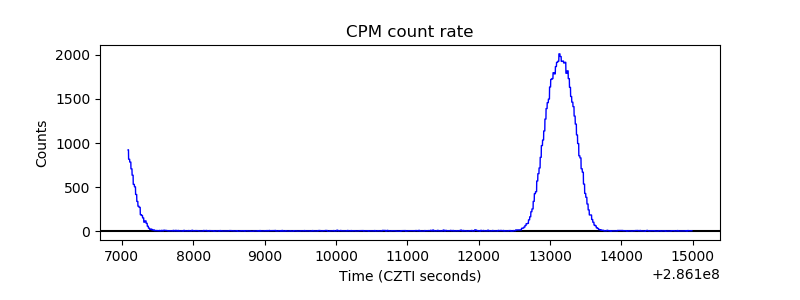 |
| CZT Counter | 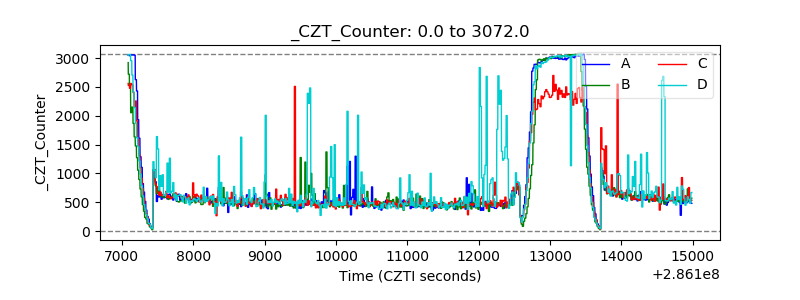 |
| +2.5 Volts monitor |  |
| +5 Volts monitor |  |
| _ROLL_ROT |  |
| _Roll_DEC |  |
| _Roll_RA | 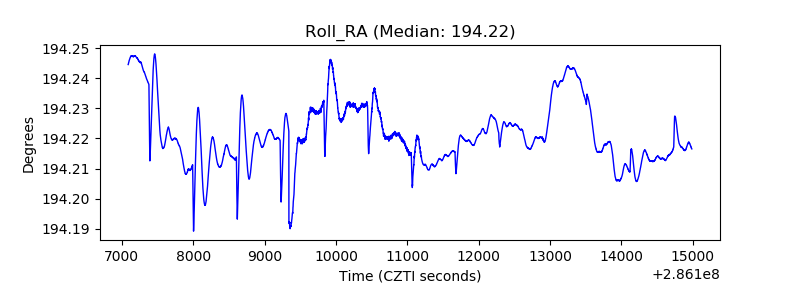 |
| Veto Counter |  |