| Param | Original file | Final file |
|---|---|---|
| Filename | modeM0/AS1A05_108T02_9000002676_17990cztM0_level2.evt | modeM0/AS1A05_108T02_9000002676_17990cztM0_level2_quad_clean.evt |
| Size (bytes) | 522,498,240 | 67,685,760 |
| Size | 498.3 MB | 64.6 MB |
| Events in quadrant A | 3,513,107 | 406,146 |
| Events in quadrant B | 3,616,250 | 407,087 |
| Events in quadrant C | 3,715,461 | 386,726 |
| Events in quadrant D | 4,530,202 | 387,892 |
| Mode SS | |||
|---|---|---|---|
| Quadrant | BADHDUFLAG | Total packets | Discarded packets |
| A | 0 | 134 | 0 |
| B | 0 | 134 | 0 |
| C | 0 | 134 | 0 |
| D | 0 | 134 | 0 |
| Mode M9 | |||
|---|---|---|---|
| Quadrant | BADHDUFLAG | Total packets | Discarded packets |
| A | 0 | 16 | 0 |
| B | 0 | 17 | 0 |
| C | 0 | 17 | 0 |
| D | 0 | 17 | 0 |
| Mode M0 | |||
|---|---|---|---|
| Quadrant | BADHDUFLAG | Total packets | Discarded packets |
| A | 0 | 14672 | 2 |
| B | 0 | 14904 | 2 |
| C | 0 | 15267 | 2 |
| D | 0 | 17948 | 2 |
| Quadrant | Total seconds | Saturated seconds | Saturation percentage |
|---|---|---|---|
| A | 6619 | 99 | 1.495694% |
| B | 6619 | 118 | 1.782747% |
| C | 6619 | 183 | 2.764768% |
| D | 6619 | 210 | 3.172685% |
Noise dominated data is calculated using 1-second bins in cleaned event files. If a bin has >2000 counts, and if more than 50% of those come from <1% of pixels, then it is considered to be noise-dominated and hence unusable.
| Quadrant | # 1 sec bins | Bins with >0 counts | Bins with >2000 counts | High rate bins dominated by noise | Noise dominated (total time) | Noise dominated (detector-on time) | Marked lightcurve |
|---|---|---|---|---|---|---|---|
| A | 7844 | 6619 | 1 | 1 | 0.01% | 0.02% | 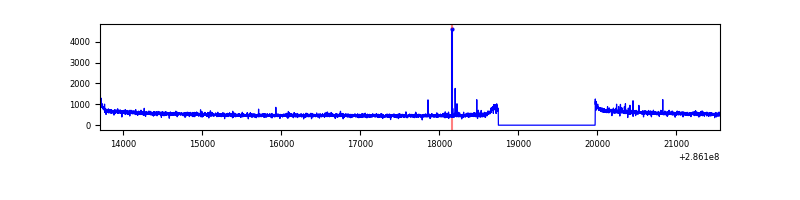 |
| B | 7844 | 6619 | 17 | 17 | 0.22% | 0.26% | 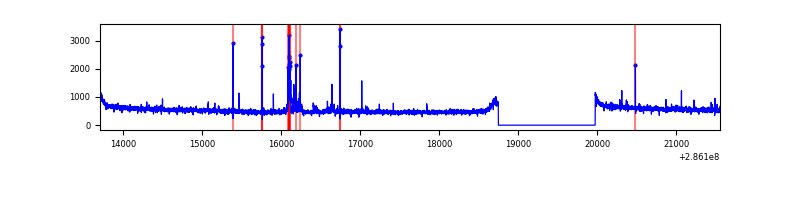 |
| C | 7844 | 6620 | 16 | 16 | 0.20% | 0.24% | 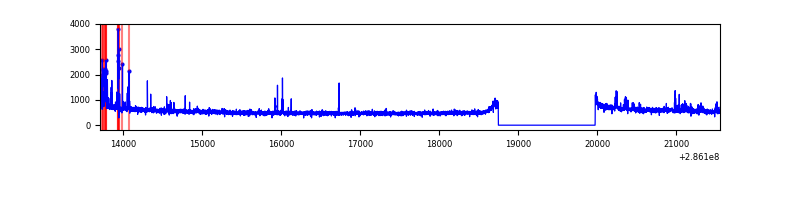 |
| D | 7844 | 6619 | 111 | 111 | 1.42% | 1.68% | 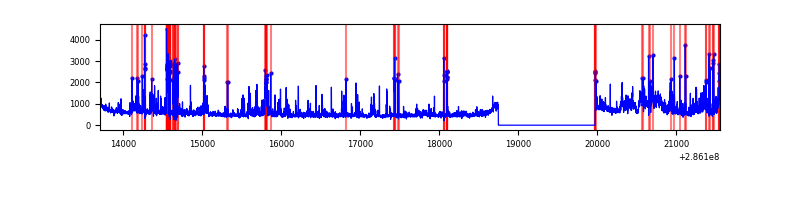 |
Top three noisy pixels from each quadrant. If the there are fewer than three noisy pixels in the level2.evt file, extra rows are filled as -1
| Pixel properties | Quadrant properties | ||||||
|---|---|---|---|---|---|---|---|
| Quadrant | DetID | PixID | Counts | Sigma | Mean | Median | Sigma |
| A | 4 | 2 | 22799 | 121.67 | 906 | 889 | 180.1 |
| A | 14 | 237 | 10207 | 51.75 | 906 | 889 | 180.1 |
| A | 0 | 226 | 7841 | 38.61 | 906 | 889 | 180.1 |
| B | 3 | 64 | 56589 | 335.15 | 893 | 873 | 166.2 |
| B | 12 | 111 | 19116 | 109.74 | 893 | 873 | 166.2 |
| B | 0 | 197 | 18697 | 107.22 | 893 | 873 | 166.2 |
| C | 0 | 207 | 161146 | 805.45 | 856 | 864 | 199.0 |
| C | 14 | 238 | 135322 | 675.68 | 856 | 864 | 199.0 |
| C | 3 | 233 | 73093 | 362.97 | 856 | 864 | 199.0 |
| D | 7 | 238 | 443484 | 2052.71 | 867 | 846 | 215.6 |
| D | 11 | 176 | 311946 | 1442.71 | 867 | 846 | 215.6 |
| D | 5 | 222 | 296635 | 1371.71 | 867 | 846 | 215.6 |
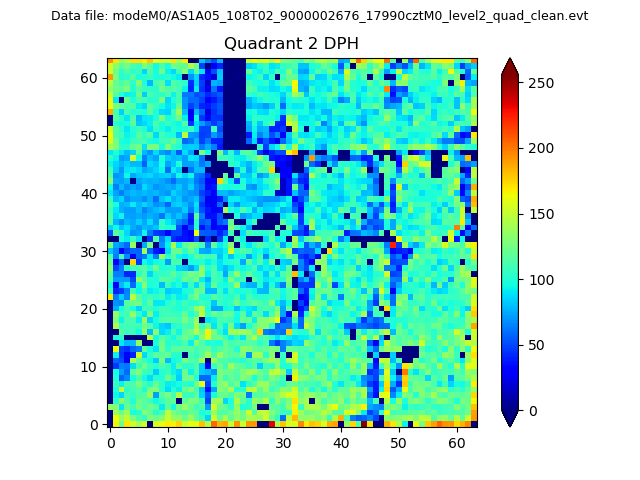
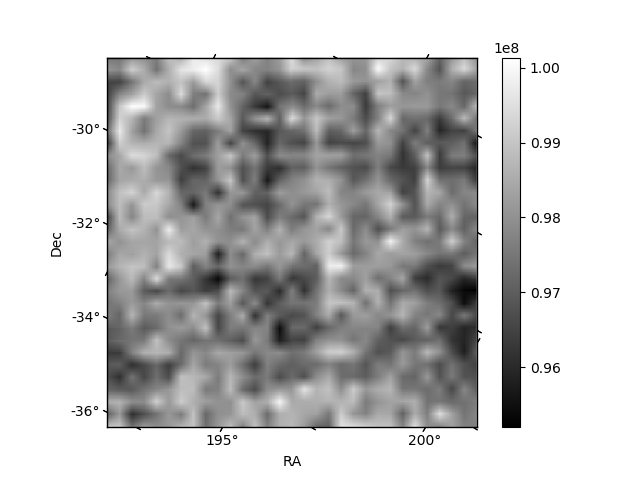
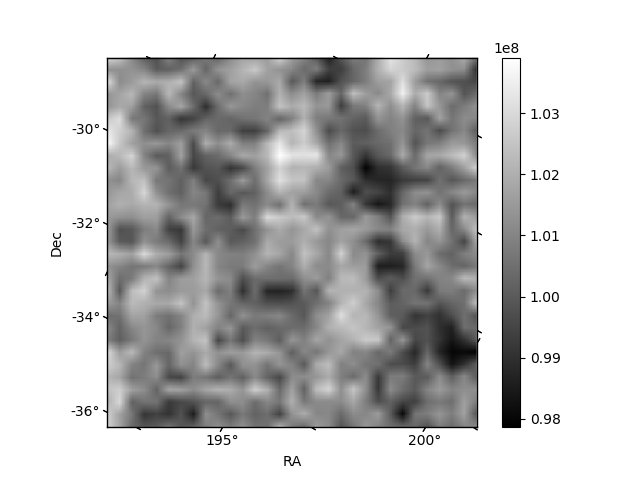
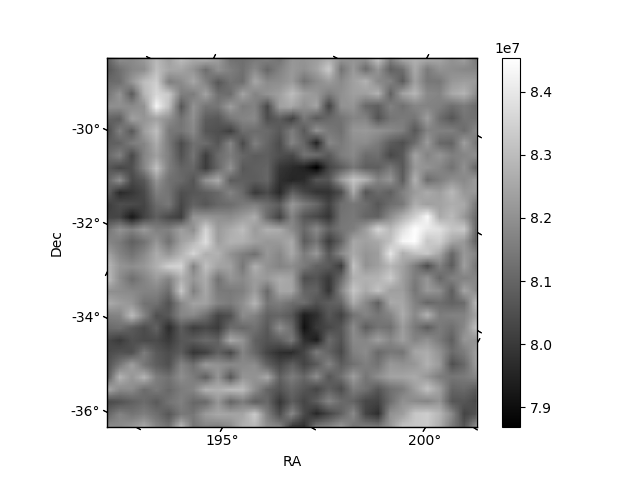
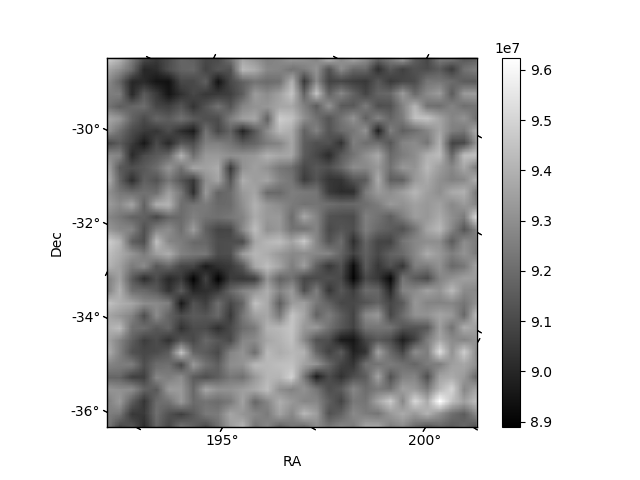
Histogram calculated using DETX and DETY for each event in the final _common_clean file
| Quadrant A | 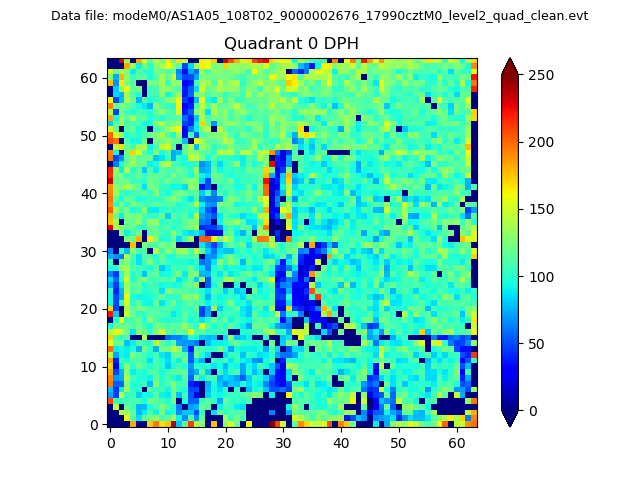 |
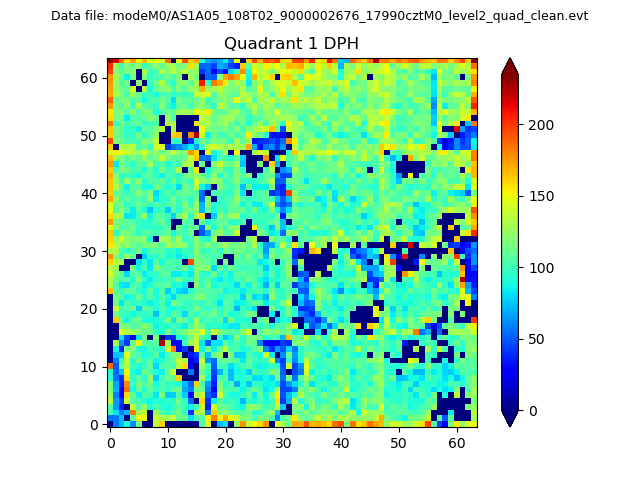 |
Quadrant B |
|---|---|---|---|
| Quadrant D | 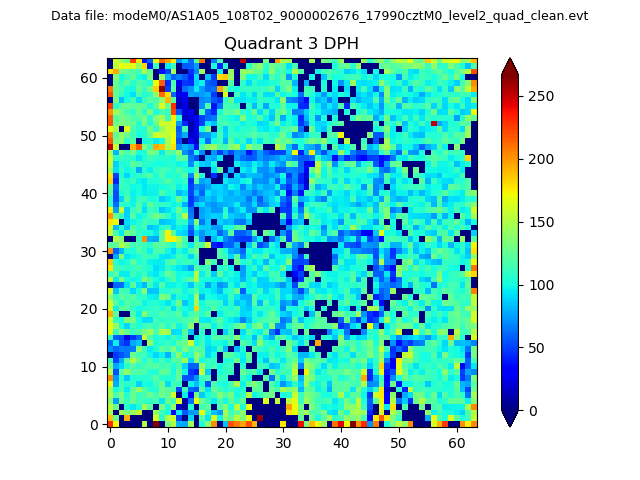 |
 |
Quadrant C |
| Plot type | Count rate plots | Images |
|---|---|---|
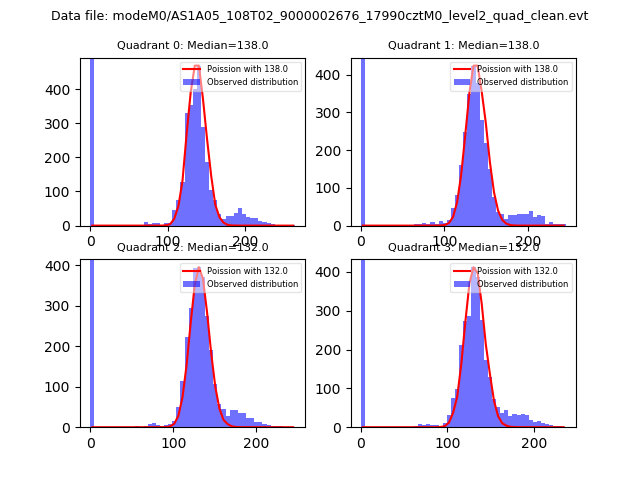
| Comparison with Poisson distribution Blue bars denote a histogram of data divided into 1 sec bins. Red curve is a Poisson curve with rate = median count rate of data. |
 |
 |
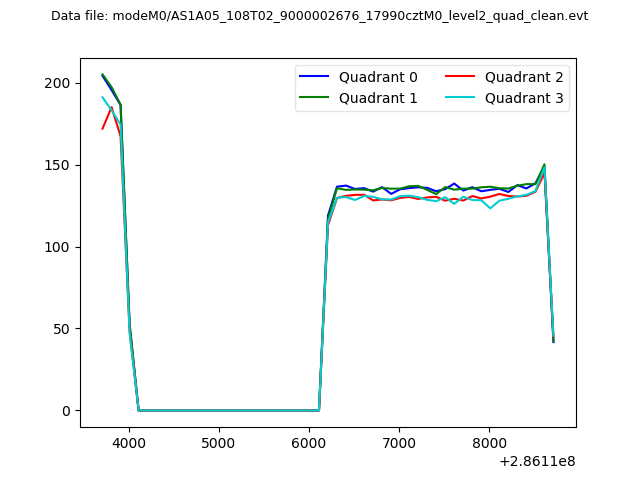
| Quadrant-wise count rates Data is divided into 100 sec bins |
 |
|
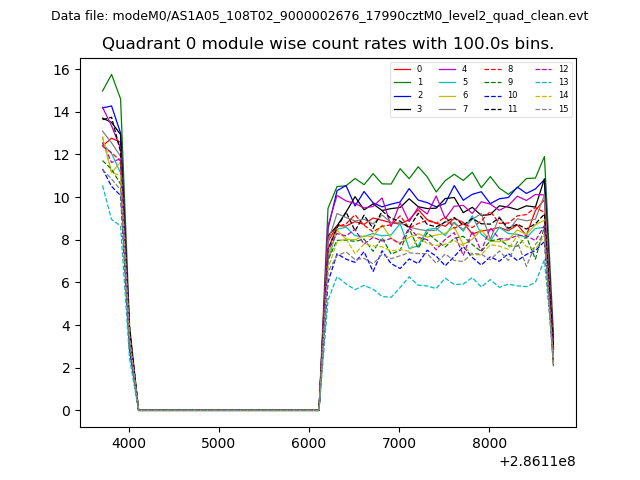
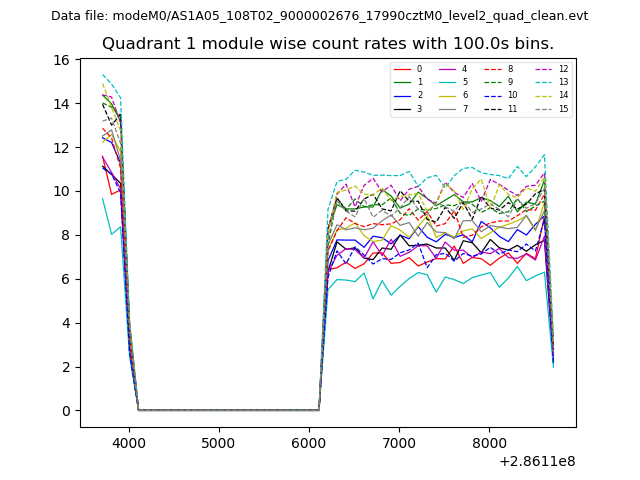
| Module-wise count rates for Quadrant A Data is divided into 100 sec bins |
 |
 |
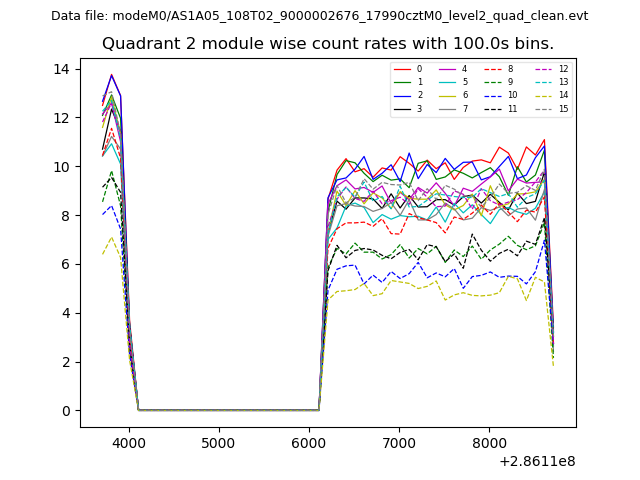
| Module-wise count rates for Quadrant B Data is divided into 100 sec bins |
 |
 |
| Module-wise count rates for Quadrant C Data is divided into 100 sec bins |
 |
 |
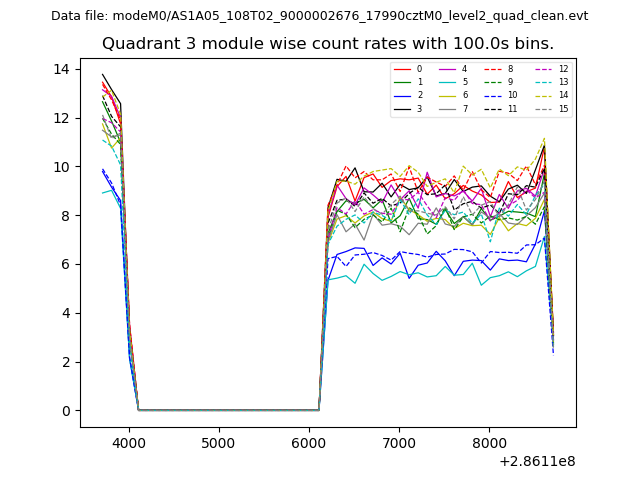
| Module-wise count rates for Quadrant D Data is divided into 100 sec bins |
 |
 |
| Parameter | Plot |
|---|---|
| CZT HV Monitor | 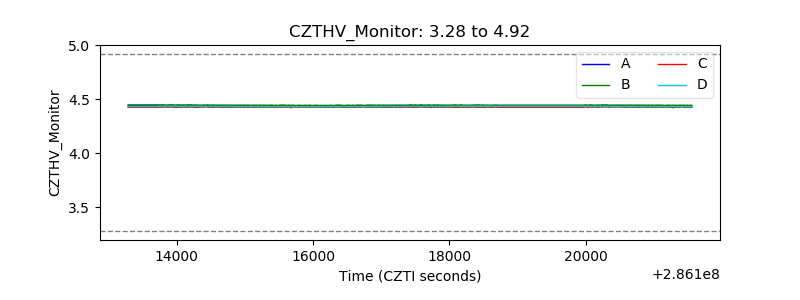 |
| D_VDD | 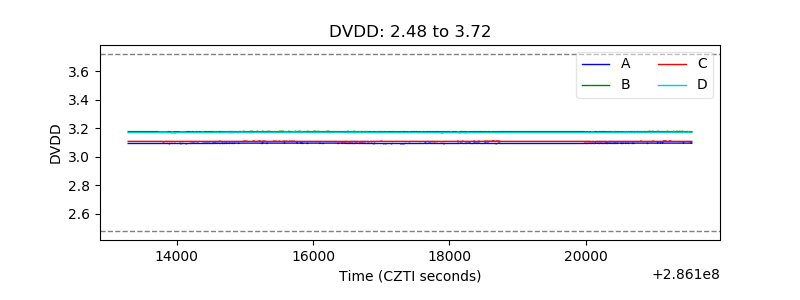 |
| Temperature 1 | 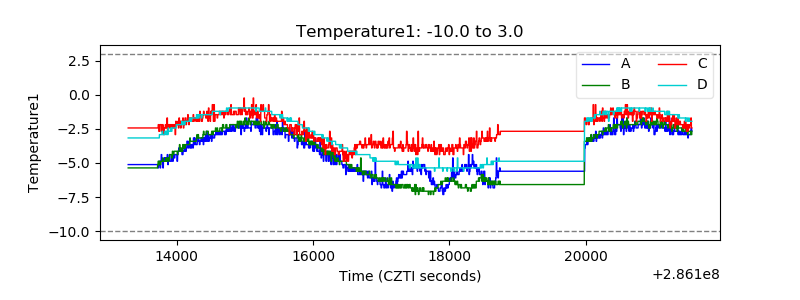 |
| Veto HV Monitor | 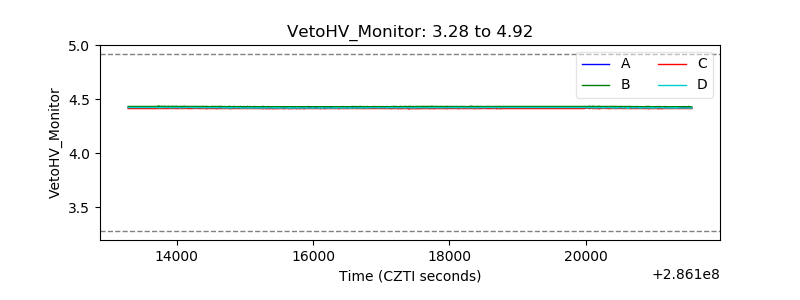 |
| Veto LLD | 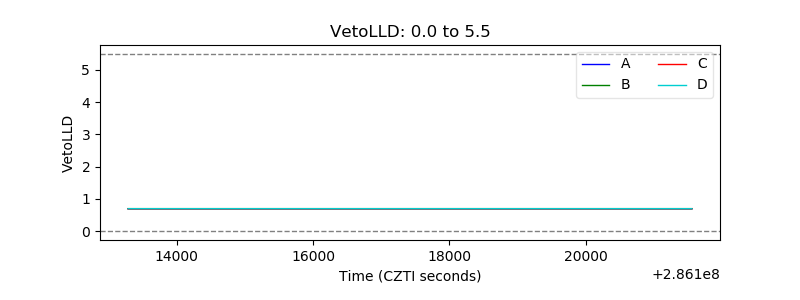 |
| Alpha Counter | 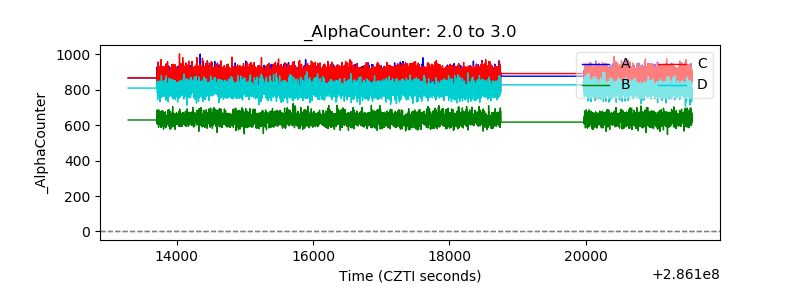 |
| _CPM_Rate | 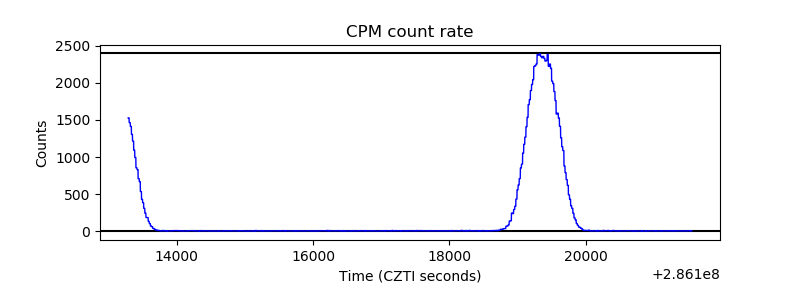 |
| CZT Counter | 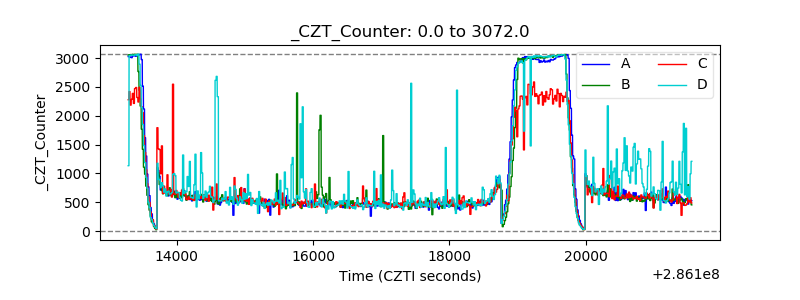 |
| +2.5 Volts monitor |  |
| +5 Volts monitor |  |
| _ROLL_ROT | 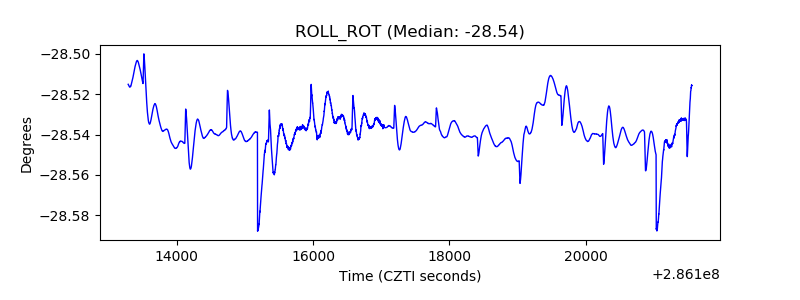 |
| _Roll_DEC | 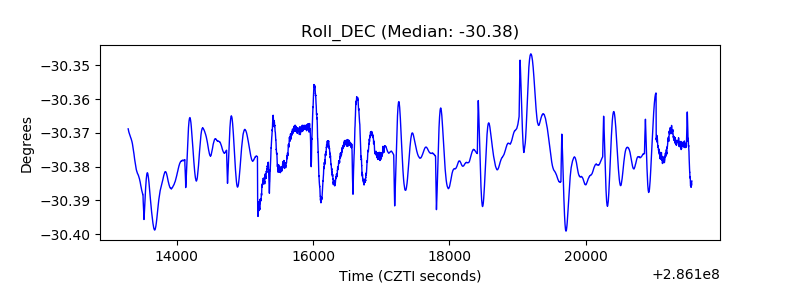 |
| _Roll_RA | 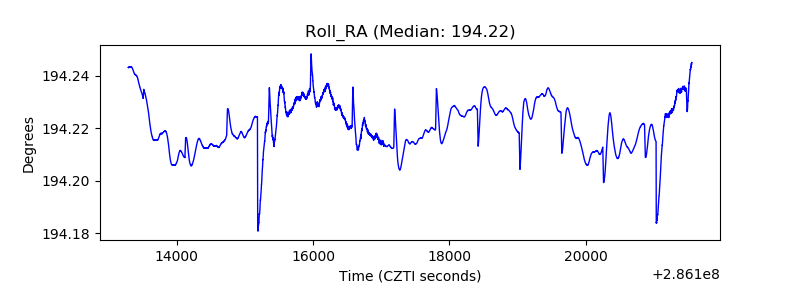 |
| Veto Counter | 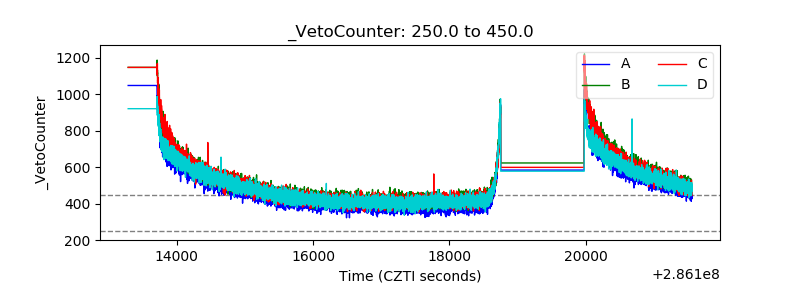 |