| Param | Original file | Final file |
|---|---|---|
| Filename | modeM0/AS1A05_108T02_9000002676_17991cztM0_level2.evt | modeM0/AS1A05_108T02_9000002676_17991cztM0_level2_quad_clean.evt |
| Size (bytes) | 511,672,320 | 67,006,080 |
| Size | 488.0 MB | 63.9 MB |
| Events in quadrant A | 3,529,300 | 401,846 |
| Events in quadrant B | 3,551,552 | 405,682 |
| Events in quadrant C | 3,582,238 | 385,231 |
| Events in quadrant D | 4,394,558 | 384,874 |
| Mode SS | |||
|---|---|---|---|
| Quadrant | BADHDUFLAG | Total packets | Discarded packets |
| A | 0 | 132 | 0 |
| B | 0 | 132 | 0 |
| C | 0 | 132 | 0 |
| D | 0 | 132 | 0 |
| Mode M9 | |||
|---|---|---|---|
| Quadrant | BADHDUFLAG | Total packets | Discarded packets |
| A | 0 | 16 | 0 |
| B | 0 | 17 | 0 |
| C | 0 | 17 | 0 |
| D | 0 | 17 | 0 |
| Mode M0 | |||
|---|---|---|---|
| Quadrant | BADHDUFLAG | Total packets | Discarded packets |
| A | 0 | 14670 | 2 |
| B | 0 | 14638 | 2 |
| C | 0 | 14714 | 2 |
| D | 0 | 17500 | 3 |
| Quadrant | Total seconds | Saturated seconds | Saturation percentage |
|---|---|---|---|
| A | 6463 | 83 | 1.284233% |
| B | 6463 | 91 | 1.408015% |
| C | 6463 | 122 | 1.887668% |
| D | 6462 | 167 | 2.584339% |
Noise dominated data is calculated using 1-second bins in cleaned event files. If a bin has >2000 counts, and if more than 50% of those come from <1% of pixels, then it is considered to be noise-dominated and hence unusable.
| Quadrant | # 1 sec bins | Bins with >0 counts | Bins with >2000 counts | High rate bins dominated by noise | Noise dominated (total time) | Noise dominated (detector-on time) | Marked lightcurve |
|---|---|---|---|---|---|---|---|
| A | 7773 | 6464 | 3 | 3 | 0.04% | 0.05% | 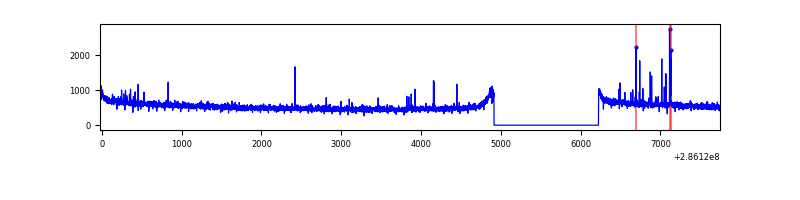 |
| B | 7773 | 6463 | 3 | 3 | 0.04% | 0.05% |  |
| C | 7773 | 6464 | 0 | 0 | 0.00% | 0.00% | 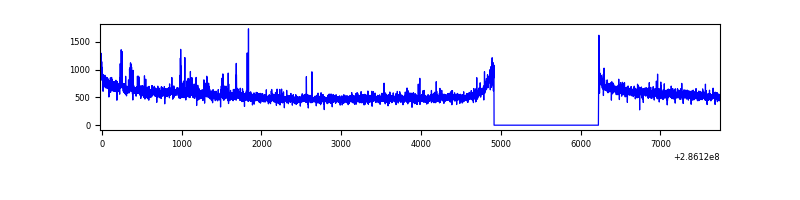 |
| D | 7772 | 6463 | 75 | 75 | 0.97% | 1.16% |  |
Top three noisy pixels from each quadrant. If the there are fewer than three noisy pixels in the level2.evt file, extra rows are filled as -1
| Pixel properties | Quadrant properties | ||||||
|---|---|---|---|---|---|---|---|
| Quadrant | DetID | PixID | Counts | Sigma | Mean | Median | Sigma |
| A | 14 | 237 | 43886 | 241.03 | 902 | 887 | 178.4 |
| A | 4 | 2 | 18305 | 97.64 | 902 | 887 | 178.4 |
| A | 0 | 226 | 7974 | 39.73 | 902 | 887 | 178.4 |
| B | 10 | 247 | 20181 | 115.05 | 894 | 875 | 167.8 |
| B | 12 | 111 | 18501 | 105.04 | 894 | 875 | 167.8 |
| B | 11 | 111 | 16519 | 93.23 | 894 | 875 | 167.8 |
| C | 14 | 238 | 132970 | 678.45 | 848 | 858 | 194.7 |
| C | 0 | 207 | 71823 | 364.44 | 848 | 858 | 194.7 |
| C | 3 | 233 | 64616 | 327.43 | 848 | 858 | 194.7 |
| D | 7 | 238 | 444089 | 2136.69 | 858 | 841 | 207.4 |
| D | 11 | 176 | 238863 | 1147.39 | 858 | 841 | 207.4 |
| D | 5 | 222 | 198668 | 953.63 | 858 | 841 | 207.4 |
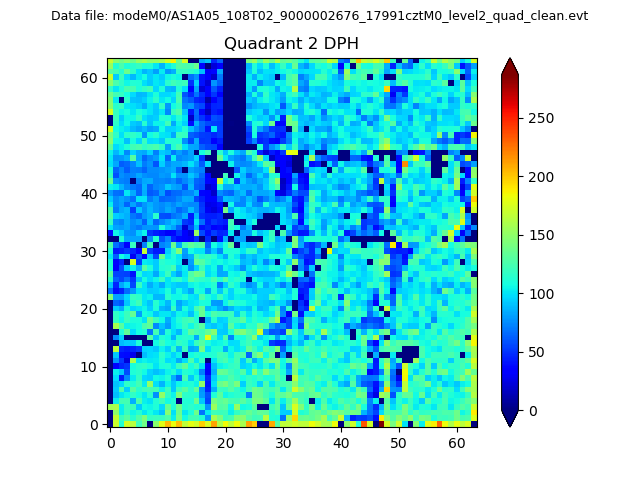
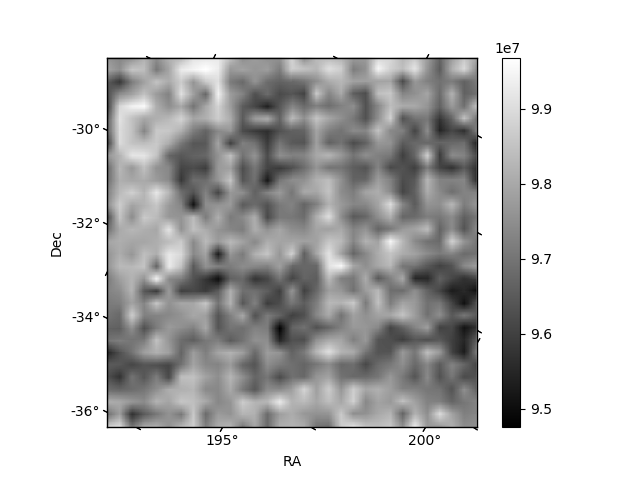
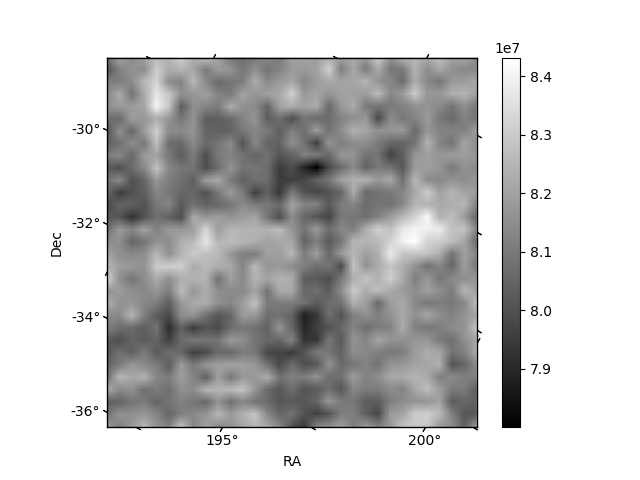
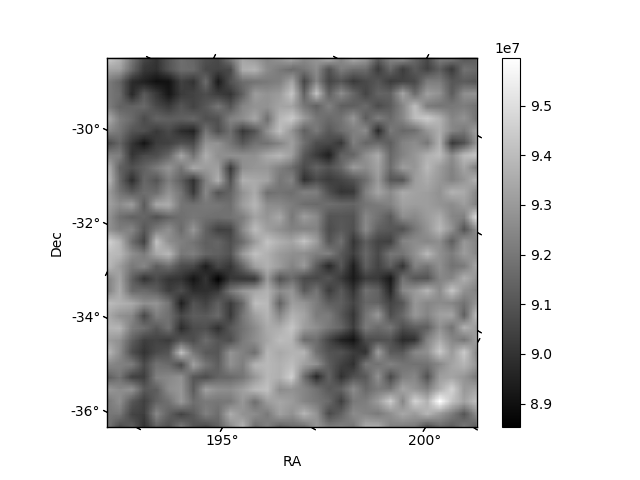
Histogram calculated using DETX and DETY for each event in the final _common_clean file
| Quadrant A |  |
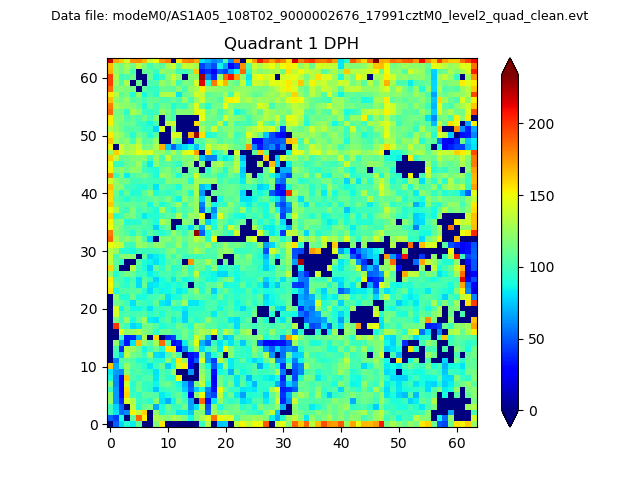 |
Quadrant B |
|---|---|---|---|
| Quadrant D | 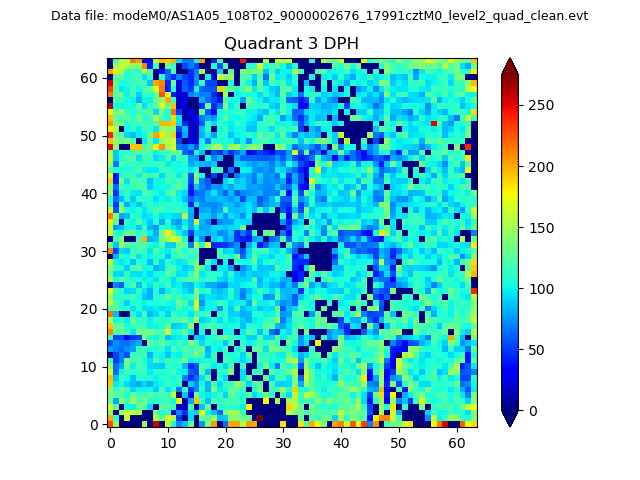 |
 |
Quadrant C |
| Plot type | Count rate plots | Images |
|---|---|---|
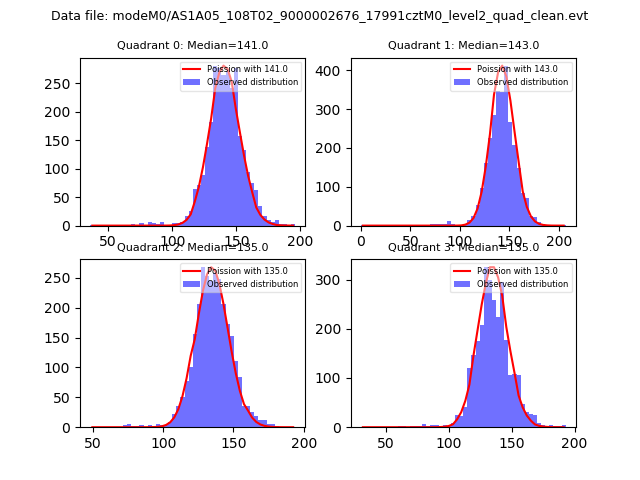
| Comparison with Poisson distribution Blue bars denote a histogram of data divided into 1 sec bins. Red curve is a Poisson curve with rate = median count rate of data. |
 |
 |
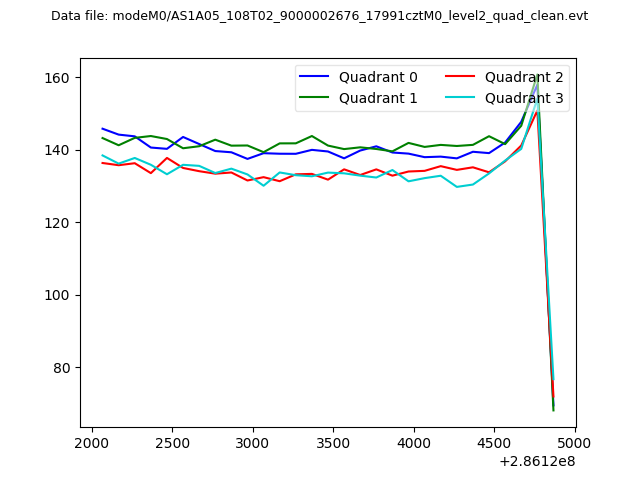
| Quadrant-wise count rates Data is divided into 100 sec bins |
 |
|
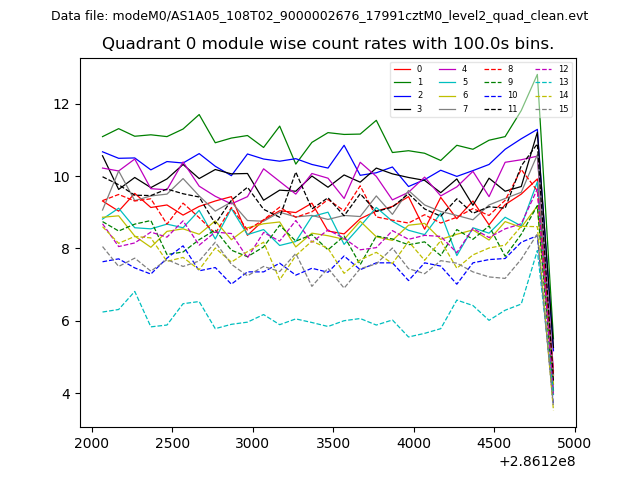
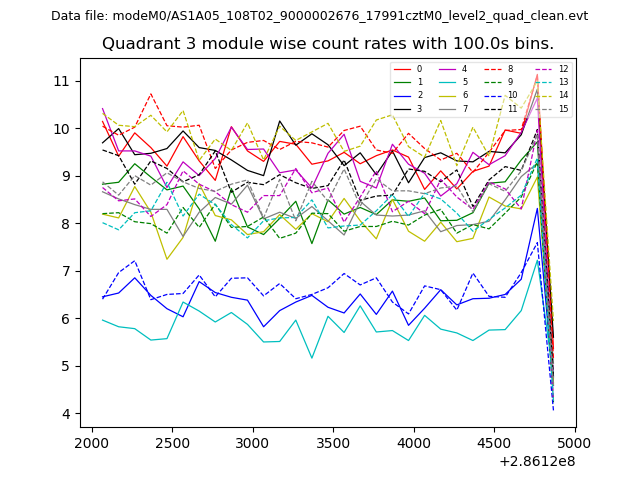
| Module-wise count rates for Quadrant A Data is divided into 100 sec bins |
 |
 |
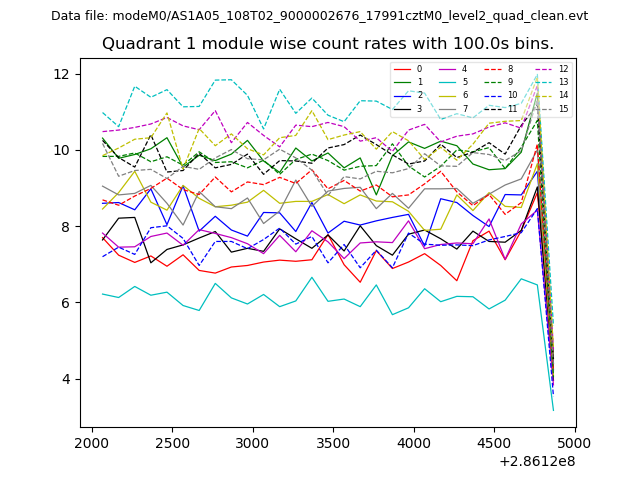
| Module-wise count rates for Quadrant B Data is divided into 100 sec bins |
 |
 |
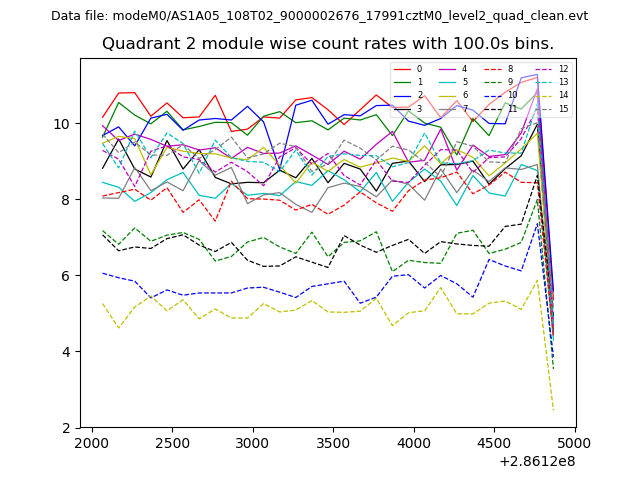
| Module-wise count rates for Quadrant C Data is divided into 100 sec bins |
 |
 |
| Module-wise count rates for Quadrant D Data is divided into 100 sec bins |
 |
 |
| Parameter | Plot |
|---|---|
| CZT HV Monitor | 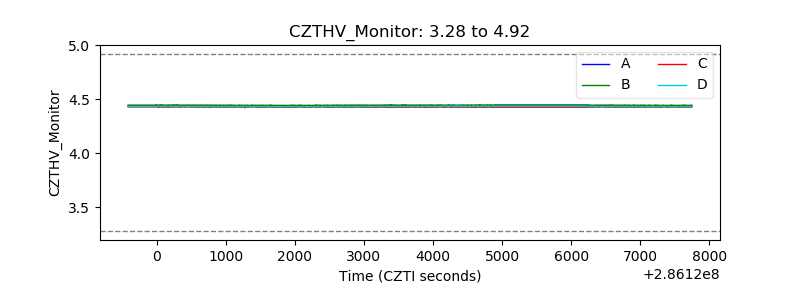 |
| D_VDD | 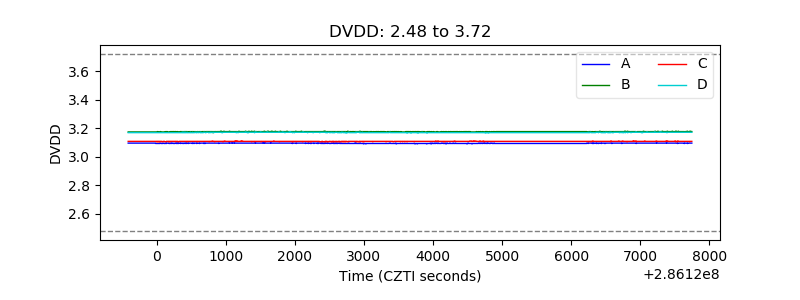 |
| Temperature 1 | 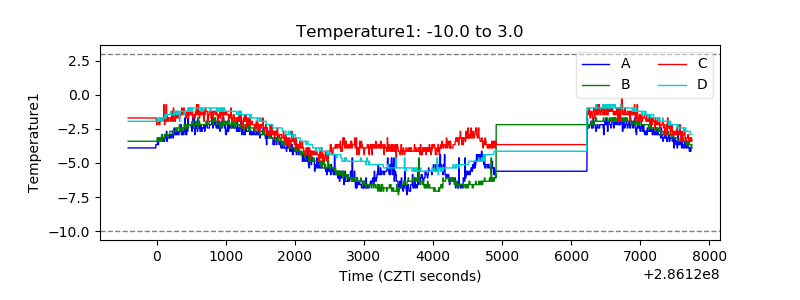 |
| Veto HV Monitor | 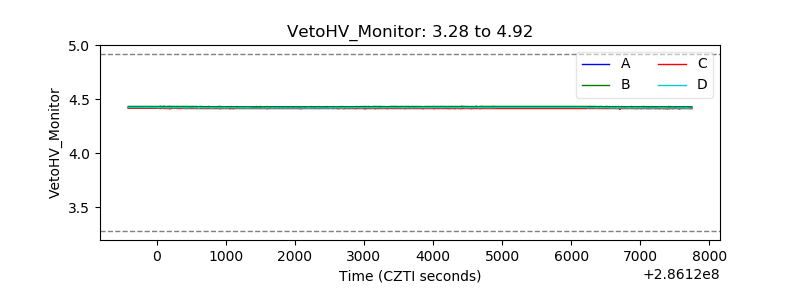 |
| Veto LLD |  |
| Alpha Counter | 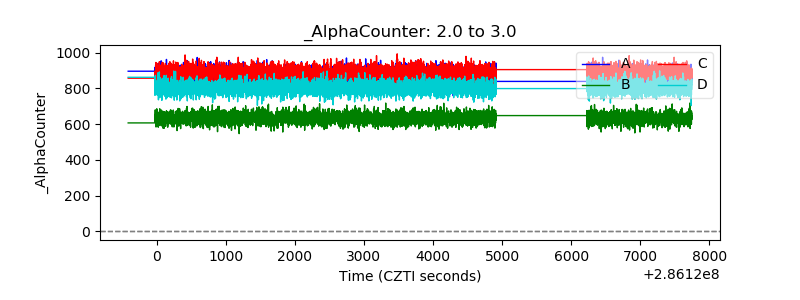 |
| _CPM_Rate | 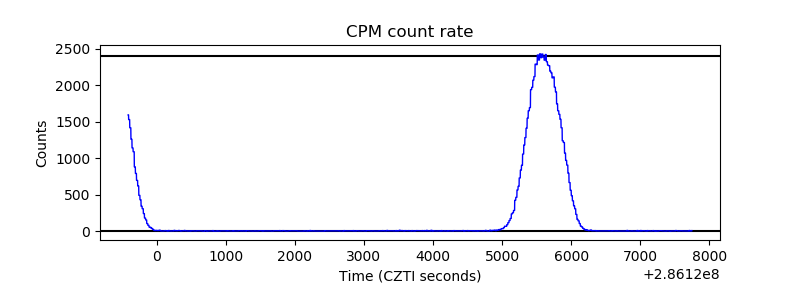 |
| CZT Counter | 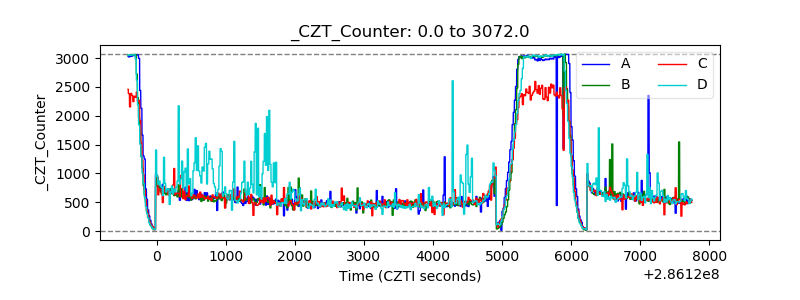 |
| +2.5 Volts monitor |  |
| +5 Volts monitor |  |
| _ROLL_ROT | 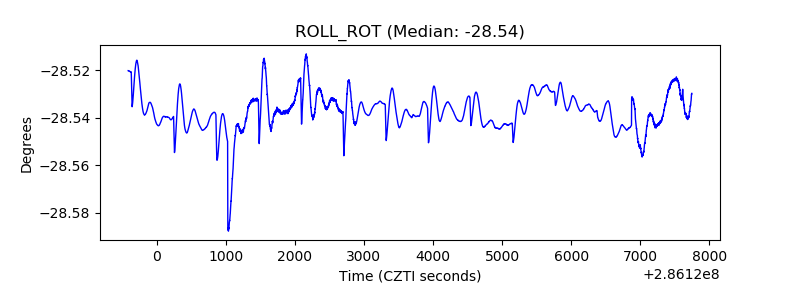 |
| _Roll_DEC | 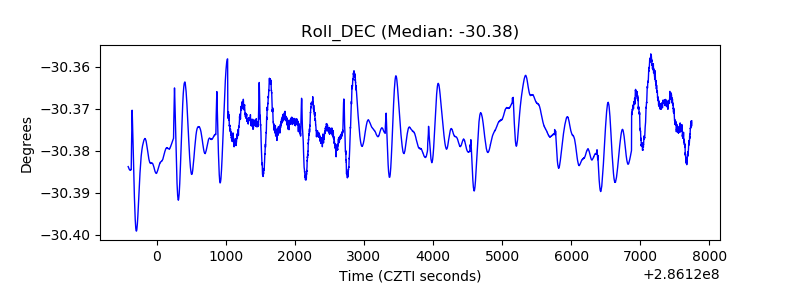 |
| _Roll_RA | 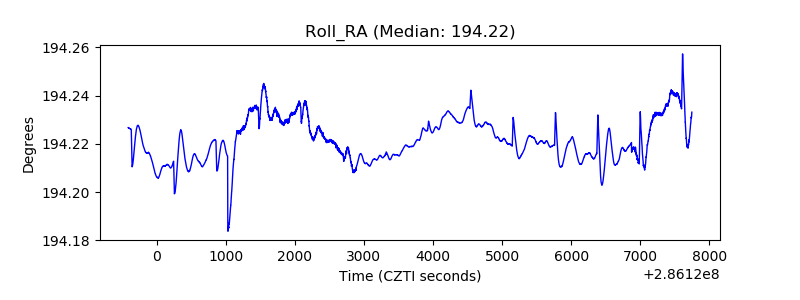 |
| Veto Counter | 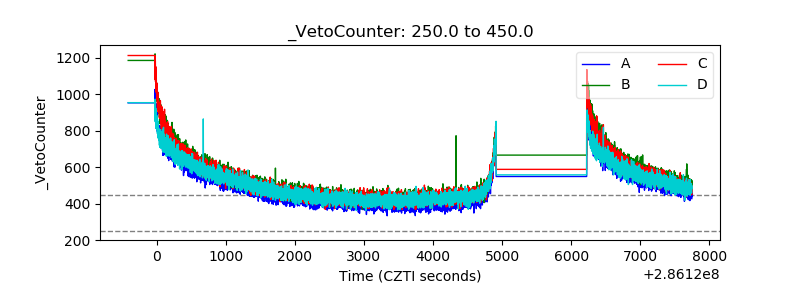 |