| Param | Original file | Final file |
|---|---|---|
| Filename | modeM0/AS1A05_108T02_9000002676_17994cztM0_level2.evt | modeM0/AS1A05_108T02_9000002676_17994cztM0_level2_quad_clean.evt |
| Size (bytes) | 516,173,760 | 93,191,040 |
| Size | 492.3 MB | 88.9 MB |
| Events in quadrant A | 3,893,606 | 595,742 |
| Events in quadrant B | 3,590,836 | 607,496 |
| Events in quadrant C | 3,452,830 | 576,356 |
| Events in quadrant D | 4,233,409 | 568,454 |
| Mode SS | |||
|---|---|---|---|
| Quadrant | BADHDUFLAG | Total packets | Discarded packets |
| A | 0 | 142 | 0 |
| B | 0 | 142 | 0 |
| C | 0 | 142 | 0 |
| D | 0 | 142 | 0 |
| Mode M9 | |||
|---|---|---|---|
| Quadrant | BADHDUFLAG | Total packets | Discarded packets |
| A | 0 | 21 | 0 |
| B | 0 | 21 | 0 |
| C | 0 | 21 | 0 |
| D | 0 | 21 | 0 |
| Mode M0 | |||
|---|---|---|---|
| Quadrant | BADHDUFLAG | Total packets | Discarded packets |
| A | 0 | 15963 | 2 |
| B | 0 | 15004 | 2 |
| C | 0 | 14475 | 2 |
| D | 0 | 17274 | 2 |
| Quadrant | Total seconds | Saturated seconds | Saturation percentage |
|---|---|---|---|
| A | 6796 | 206 | 3.031195% |
| B | 6796 | 226 | 3.325486% |
| C | 6796 | 145 | 2.133608% |
| D | 6796 | 203 | 2.987051% |
Noise dominated data is calculated using 1-second bins in cleaned event files. If a bin has >2000 counts, and if more than 50% of those come from <1% of pixels, then it is considered to be noise-dominated and hence unusable.
| Quadrant | # 1 sec bins | Bins with >0 counts | Bins with >2000 counts | High rate bins dominated by noise | Noise dominated (total time) | Noise dominated (detector-on time) | Marked lightcurve |
|---|---|---|---|---|---|---|---|
| A | 8946 | 6798 | 36 | 36 | 0.40% | 0.53% | 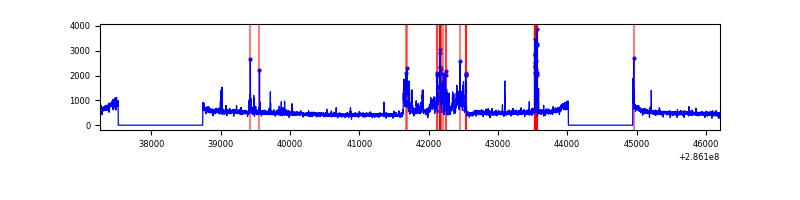 |
| B | 8946 | 6798 | 26 | 26 | 0.29% | 0.38% | 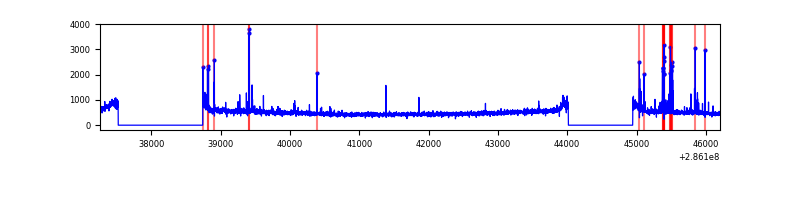 |
| C | 8946 | 6798 | 1 | 1 | 0.01% | 0.01% | 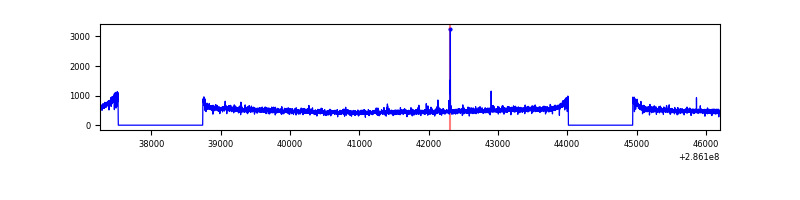 |
| D | 8946 | 6798 | 86 | 86 | 0.96% | 1.27% | 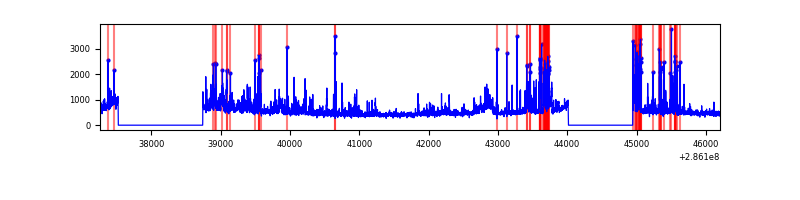 |
Top three noisy pixels from each quadrant. If the there are fewer than three noisy pixels in the level2.evt file, extra rows are filled as -1
| Pixel properties | Quadrant properties | ||||||
|---|---|---|---|---|---|---|---|
| Quadrant | DetID | PixID | Counts | Sigma | Mean | Median | Sigma |
| A | 15 | 174 | 498272 | 2846.95 | 863 | 847 | 174.7 |
| A | 14 | 237 | 30918 | 172.11 | 863 | 847 | 174.7 |
| A | 14 | 111 | 25244 | 139.63 | 863 | 847 | 174.7 |
| B | 5 | 172 | 64444 | 384.19 | 864 | 843 | 165.5 |
| B | 0 | 197 | 56263 | 334.77 | 864 | 843 | 165.5 |
| B | 7 | 220 | 40734 | 240.97 | 864 | 843 | 165.5 |
| C | 14 | 238 | 128526 | 657.37 | 826 | 831 | 194.3 |
| C | 3 | 233 | 65812 | 334.52 | 826 | 831 | 194.3 |
| C | 9 | 160 | 12467 | 59.9 | 826 | 831 | 194.3 |
| D | 5 | 222 | 524789 | 2461.83 | 829 | 809 | 212.8 |
| D | 11 | 176 | 306131 | 1434.5 | 829 | 809 | 212.8 |
| D | 7 | 238 | 179828 | 841.09 | 829 | 809 | 212.8 |
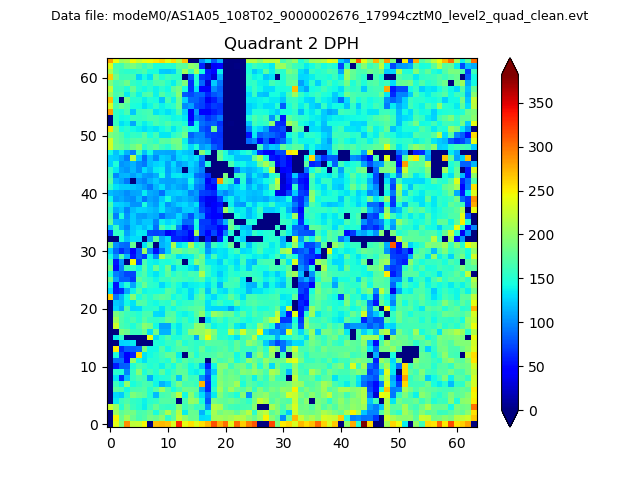
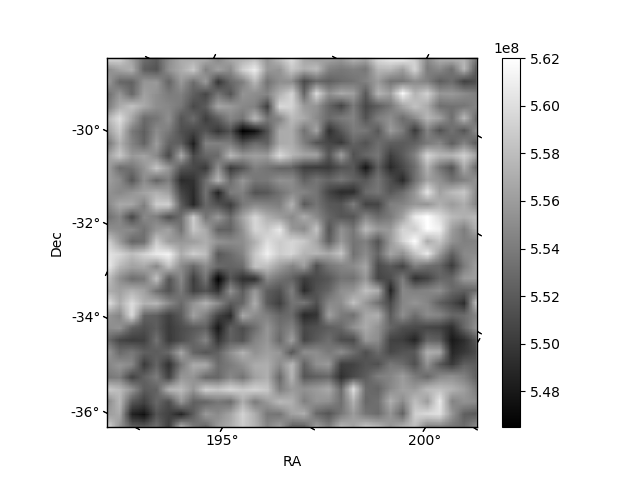
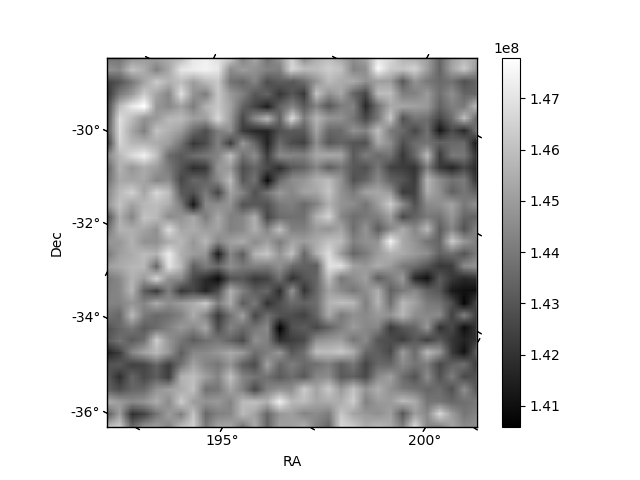
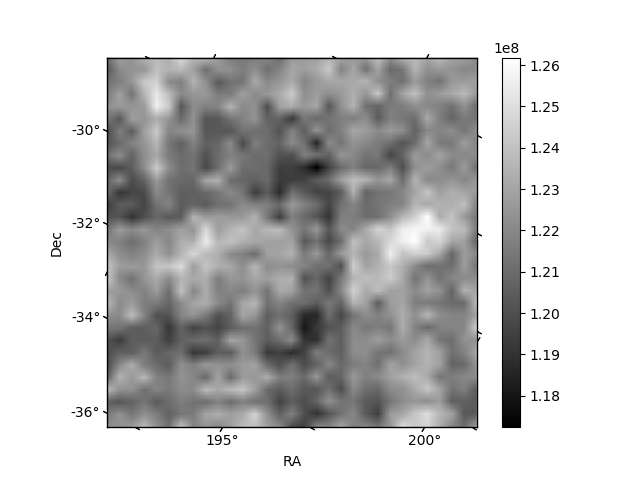
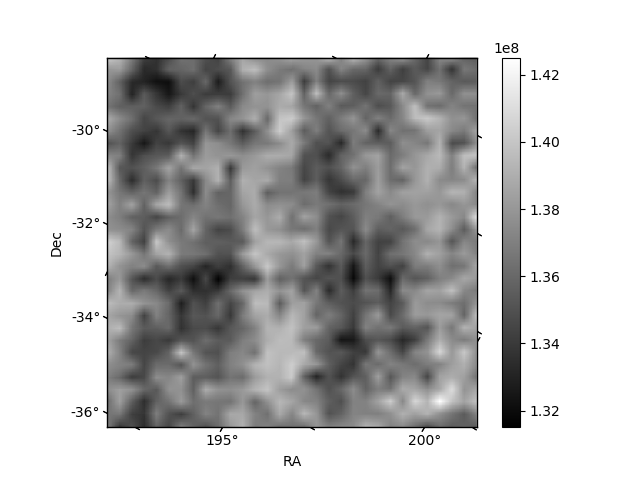
Histogram calculated using DETX and DETY for each event in the final _common_clean file
| Quadrant A | 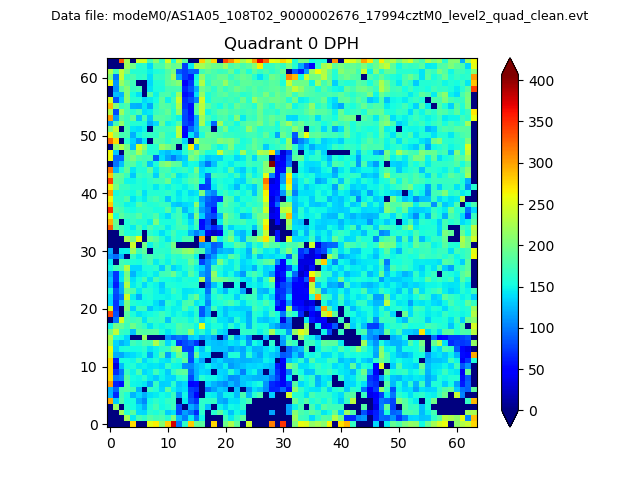 |
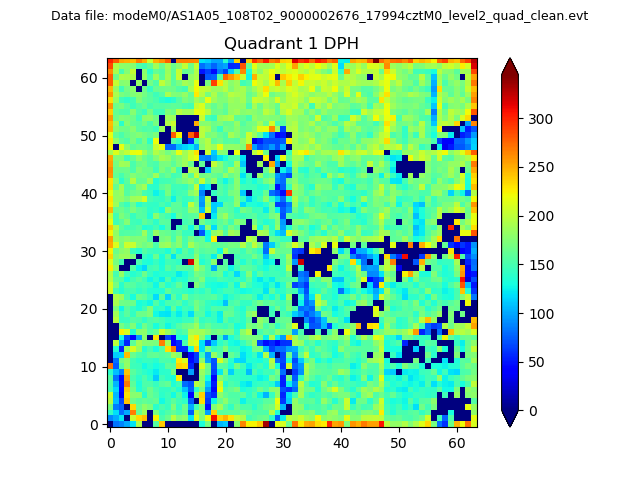 |
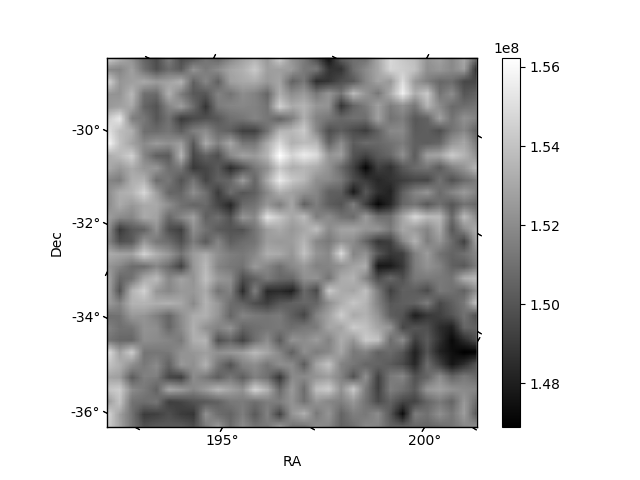
Quadrant B |
|---|---|---|---|
| Quadrant D | 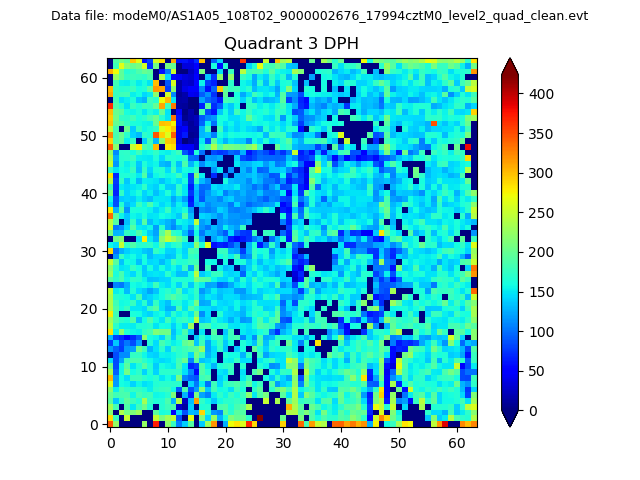 |
 |
Quadrant C |
| Plot type | Count rate plots | Images |
|---|---|---|
| Comparison with Poisson distribution Blue bars denote a histogram of data divided into 1 sec bins. Red curve is a Poisson curve with rate = median count rate of data. |
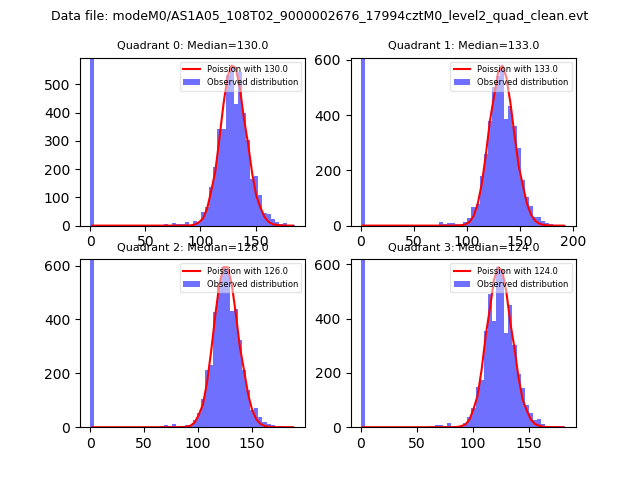 |
 |
| Quadrant-wise count rates Data is divided into 100 sec bins |
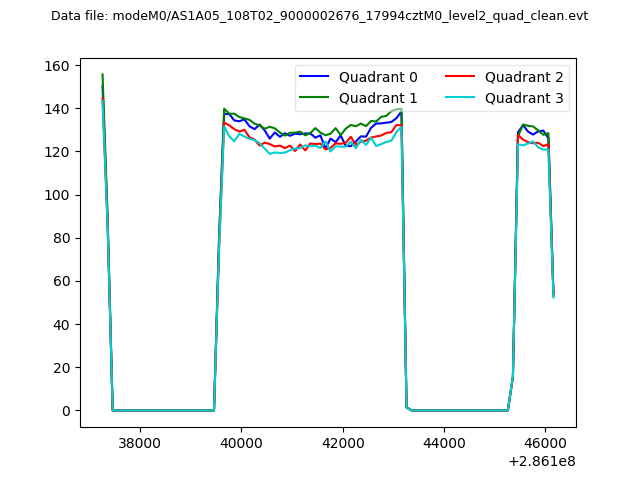 |
|
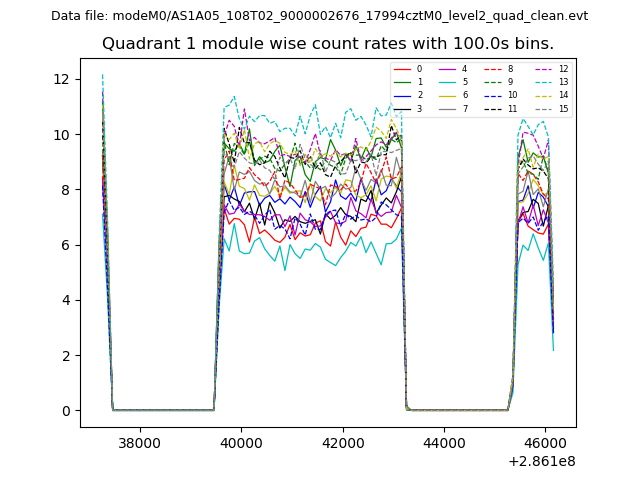
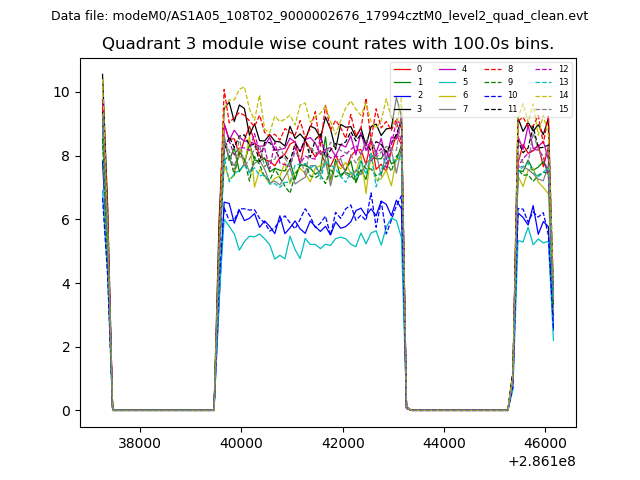
| Module-wise count rates for Quadrant A Data is divided into 100 sec bins |
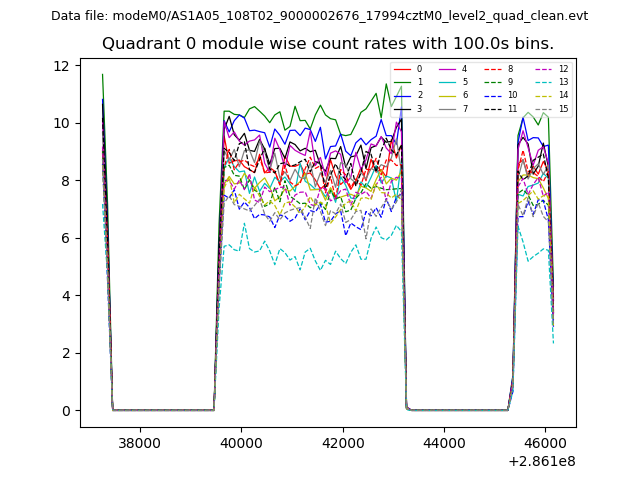 |
 |
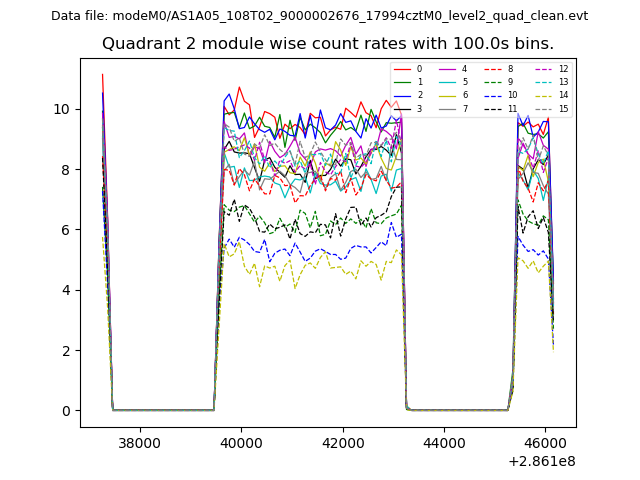
| Module-wise count rates for Quadrant B Data is divided into 100 sec bins |
 |
 |
| Module-wise count rates for Quadrant C Data is divided into 100 sec bins |
 |
 |
| Module-wise count rates for Quadrant D Data is divided into 100 sec bins |
 |
 |
| Parameter | Plot |
|---|---|
| CZT HV Monitor | 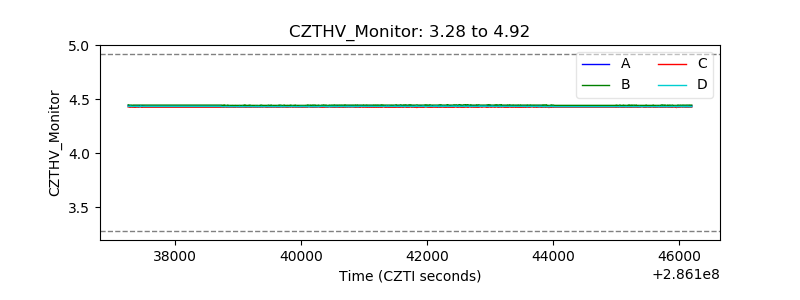 |
| D_VDD | 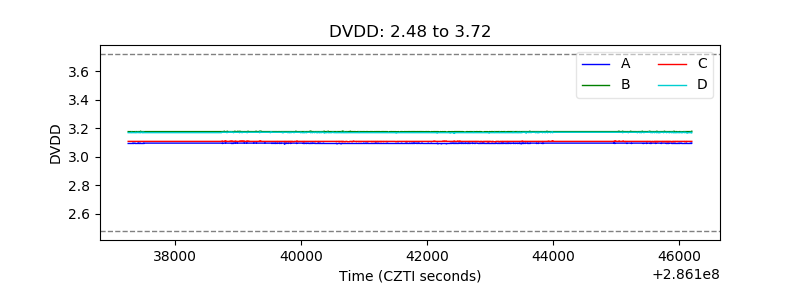 |
| Temperature 1 | 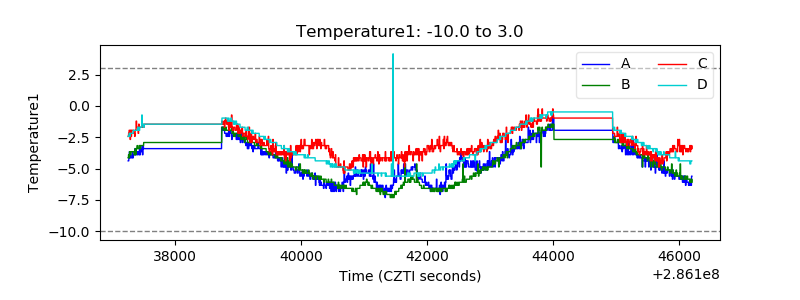 |
| Veto HV Monitor |  |
| Veto LLD | 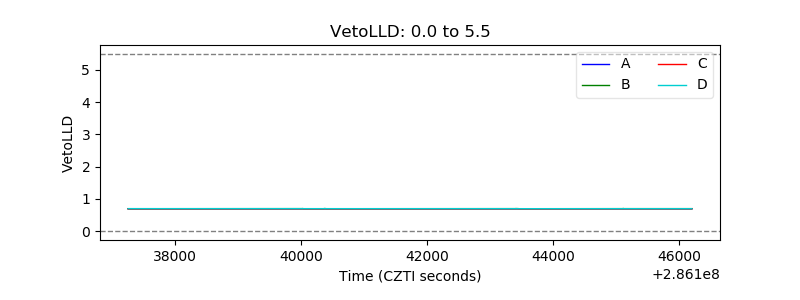 |
| Alpha Counter | 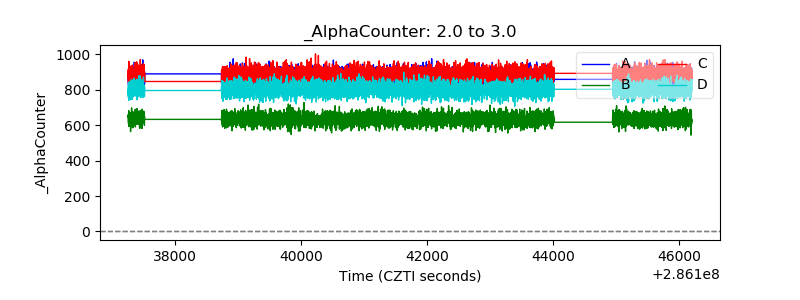 |
| _CPM_Rate | 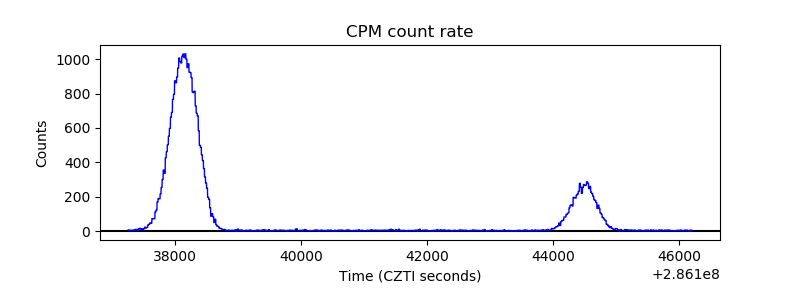 |
| CZT Counter | 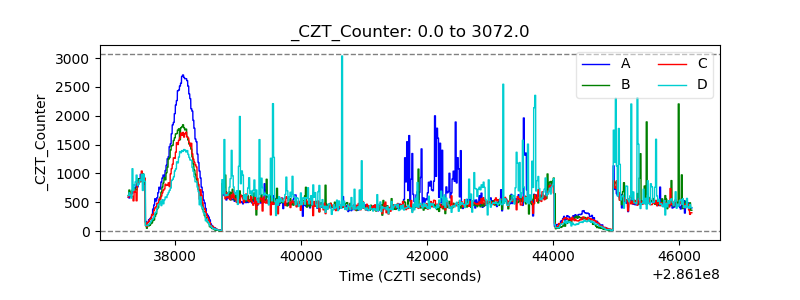 |
| +2.5 Volts monitor |  |
| +5 Volts monitor |  |
| _ROLL_ROT | 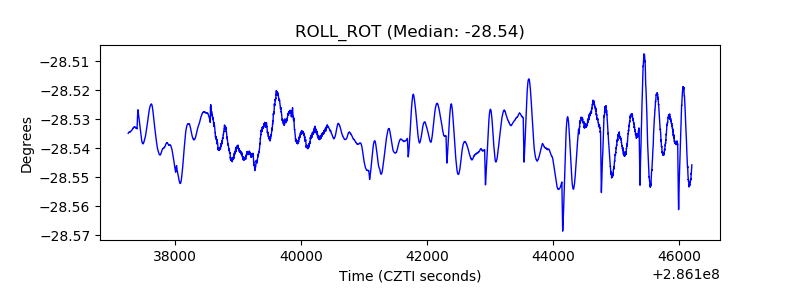 |
| _Roll_DEC | 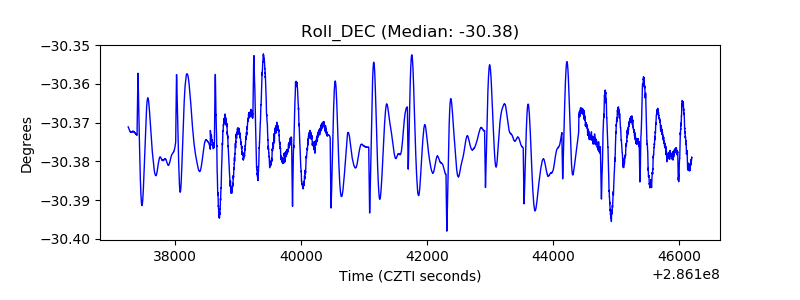 |
| _Roll_RA | 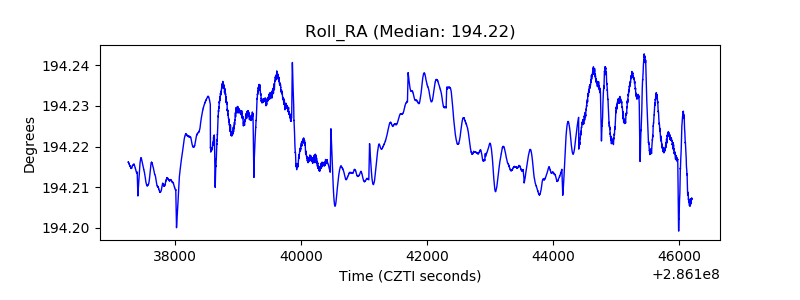 |
| Veto Counter | 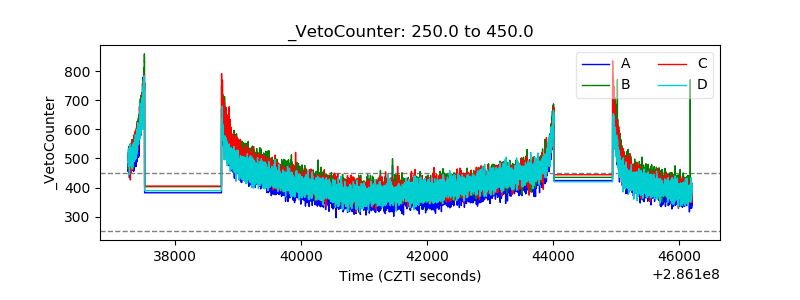 |