| Param | Original file | Final file |
|---|---|---|
| Filename | modeM0/AS1A05_108T02_9000002676_17995cztM0_level2.evt | modeM0/AS1A05_108T02_9000002676_17995cztM0_level2_quad_clean.evt |
| Size (bytes) | 519,474,240 | 97,171,200 |
| Size | 495.4 MB | 92.7 MB |
| Events in quadrant A | 3,606,136 | 615,615 |
| Events in quadrant B | 3,836,981 | 624,105 |
| Events in quadrant C | 3,660,586 | 598,158 |
| Events in quadrant D | 4,126,584 | 590,427 |
| Mode SS | |||
|---|---|---|---|
| Quadrant | BADHDUFLAG | Total packets | Discarded packets |
| A | 0 | 154 | 0 |
| B | 0 | 154 | 0 |
| C | 0 | 154 | 0 |
| D | 0 | 154 | 0 |
| Mode M9 | |||
|---|---|---|---|
| Quadrant | BADHDUFLAG | Total packets | Discarded packets |
| A | 0 | 14 | 0 |
| B | 0 | 14 | 0 |
| C | 0 | 14 | 0 |
| D | 0 | 14 | 0 |
| Mode M0 | |||
|---|---|---|---|
| Quadrant | BADHDUFLAG | Total packets | Discarded packets |
| A | 0 | 15626 | 2 |
| B | 0 | 16278 | 2 |
| C | 0 | 15600 | 2 |
| D | 0 | 17297 | 2 |
| Quadrant | Total seconds | Saturated seconds | Saturation percentage |
|---|---|---|---|
| A | 7384 | 109 | 1.476165% |
| B | 7385 | 188 | 2.545701% |
| C | 7385 | 94 | 1.272850% |
| D | 7385 | 156 | 2.112390% |
Noise dominated data is calculated using 1-second bins in cleaned event files. If a bin has >2000 counts, and if more than 50% of those come from <1% of pixels, then it is considered to be noise-dominated and hence unusable.
| Quadrant | # 1 sec bins | Bins with >0 counts | Bins with >2000 counts | High rate bins dominated by noise | Noise dominated (total time) | Noise dominated (detector-on time) | Marked lightcurve |
|---|---|---|---|---|---|---|---|
| A | 8874 | 7386 | 17 | 17 | 0.19% | 0.23% |  |
| B | 8875 | 7387 | 31 | 31 | 0.35% | 0.42% |  |
| C | 8875 | 7387 | 0 | 0 | 0.00% | 0.00% | 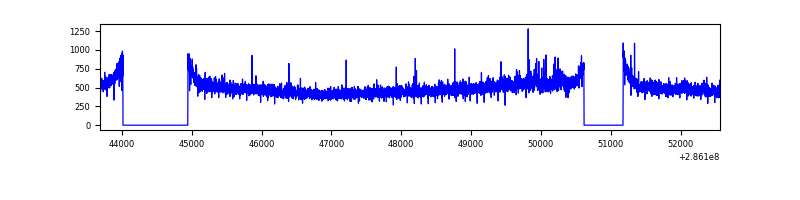 |
| D | 8875 | 7387 | 98 | 98 | 1.10% | 1.33% | 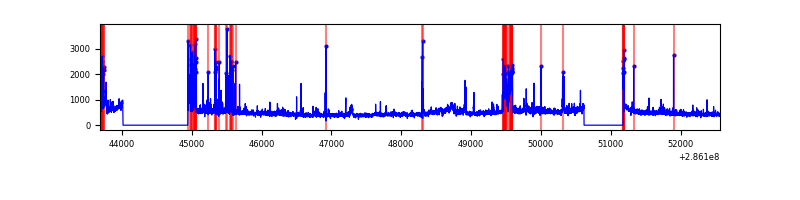 |
Top three noisy pixels from each quadrant. If the there are fewer than three noisy pixels in the level2.evt file, extra rows are filled as -1
| Pixel properties | Quadrant properties | ||||||
|---|---|---|---|---|---|---|---|
| Quadrant | DetID | PixID | Counts | Sigma | Mean | Median | Sigma |
| A | 15 | 174 | 70482 | 373.69 | 913 | 893 | 186.2 |
| A | 14 | 111 | 14022 | 70.5 | 913 | 893 | 186.2 |
| A | 4 | 2 | 13345 | 66.87 | 913 | 893 | 186.2 |
| B | 7 | 220 | 84622 | 476.5 | 910 | 885 | 175.7 |
| B | 5 | 172 | 75965 | 427.24 | 910 | 885 | 175.7 |
| B | 0 | 197 | 57750 | 323.59 | 910 | 885 | 175.7 |
| C | 14 | 238 | 134736 | 647.59 | 875 | 881 | 206.7 |
| C | 3 | 233 | 66890 | 319.35 | 875 | 881 | 206.7 |
| C | 0 | 207 | 25287 | 118.08 | 875 | 881 | 206.7 |
| D | 11 | 176 | 346012 | 1499.64 | 873 | 855 | 230.2 |
| D | 5 | 222 | 296400 | 1284.09 | 873 | 855 | 230.2 |
| D | 9 | 64 | 59159 | 253.32 | 873 | 855 | 230.2 |
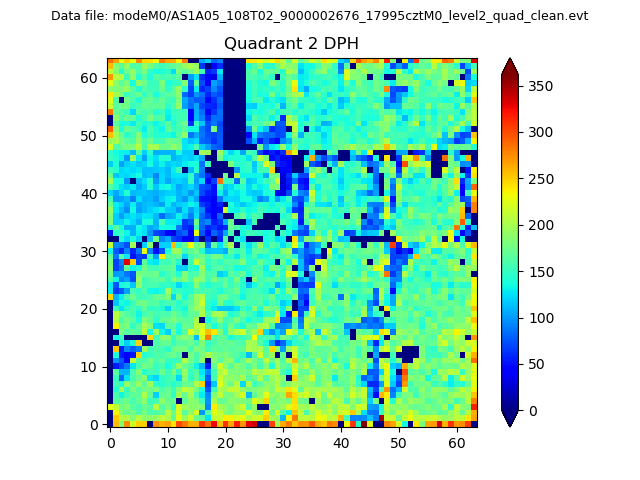
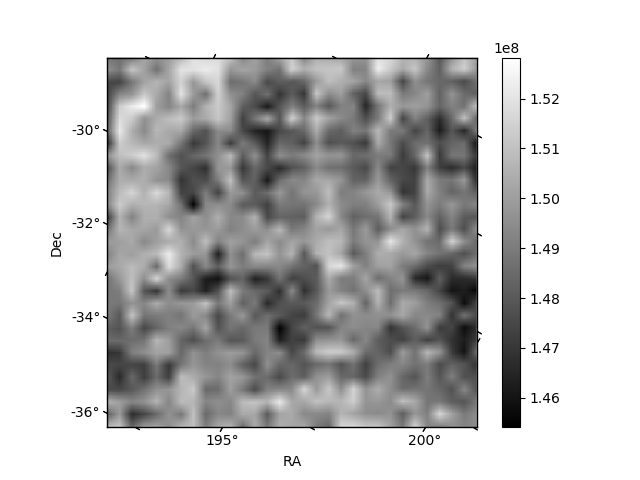
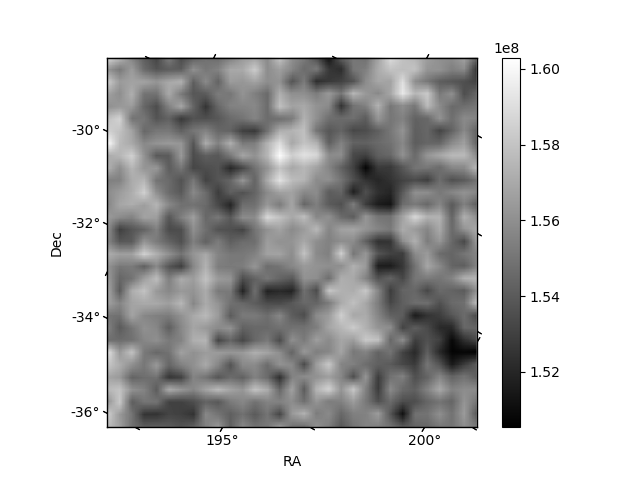
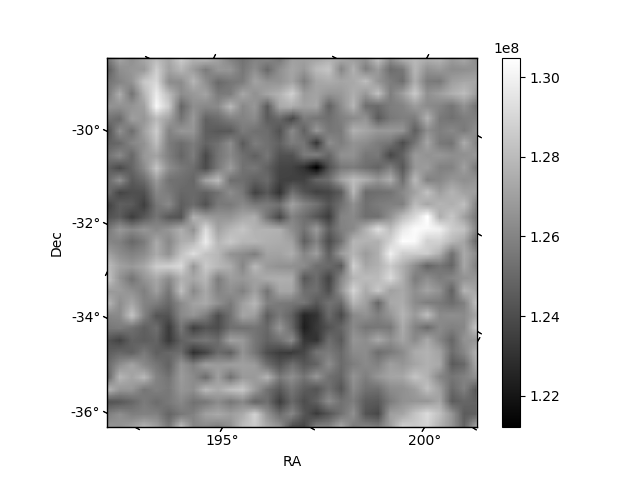
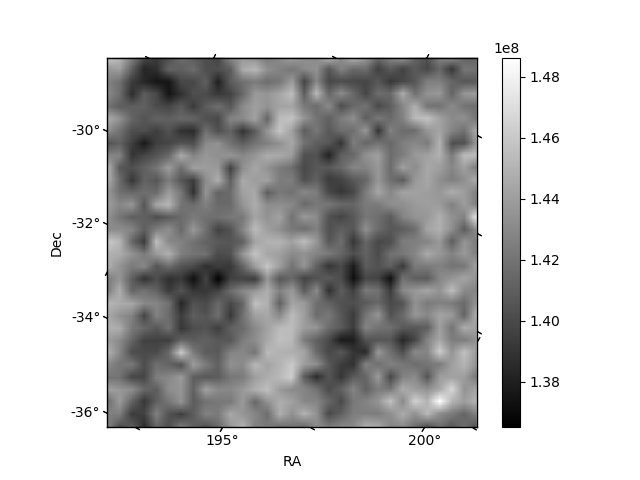
Histogram calculated using DETX and DETY for each event in the final _common_clean file
| Quadrant A | 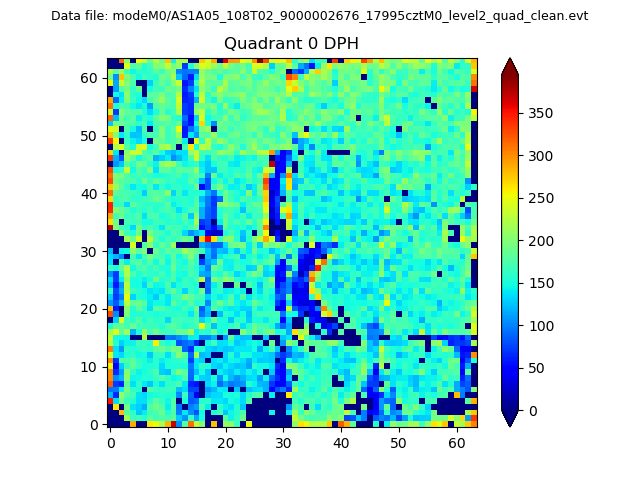 |
 |
Quadrant B |
|---|---|---|---|
| Quadrant D | 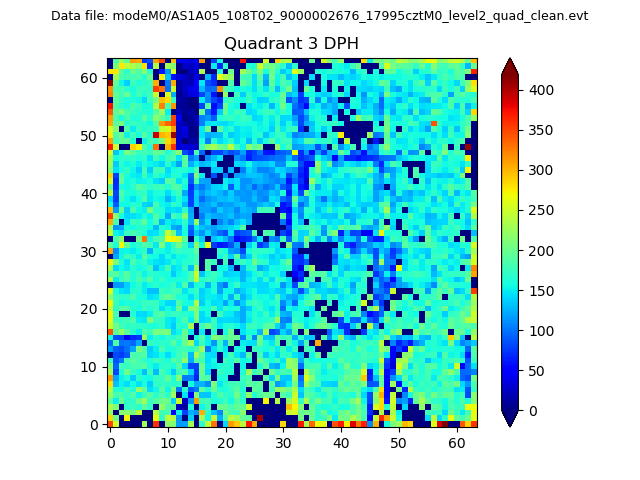 |
 |
Quadrant C |
| Plot type | Count rate plots | Images |
|---|---|---|
| Comparison with Poisson distribution Blue bars denote a histogram of data divided into 1 sec bins. Red curve is a Poisson curve with rate = median count rate of data. |
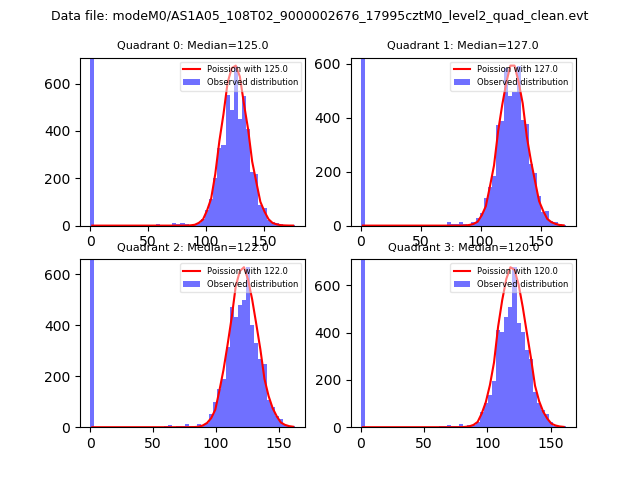 |
 |
| Quadrant-wise count rates Data is divided into 100 sec bins |
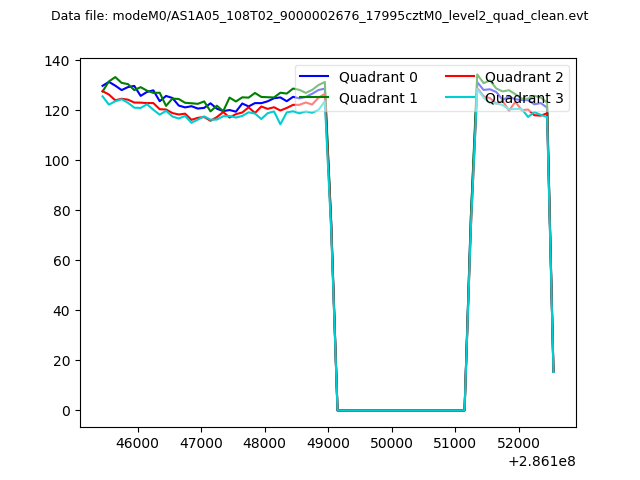 |
|
| Module-wise count rates for Quadrant A Data is divided into 100 sec bins |
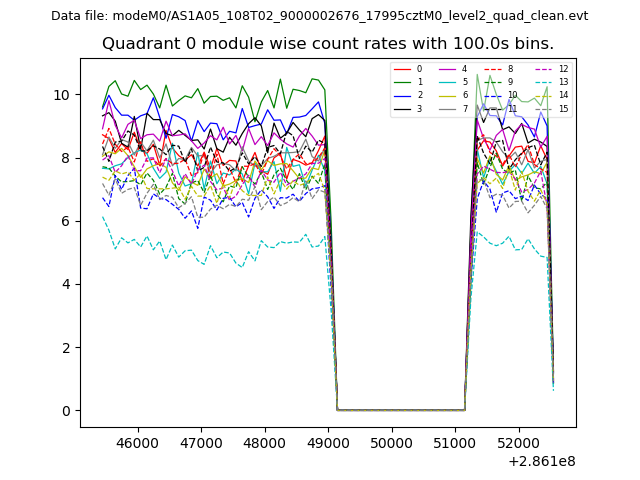 |
 |
| Module-wise count rates for Quadrant B Data is divided into 100 sec bins |
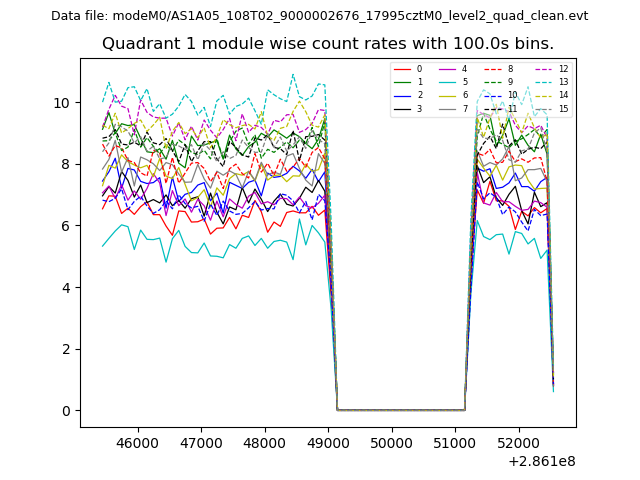 |
 |
| Module-wise count rates for Quadrant C Data is divided into 100 sec bins |
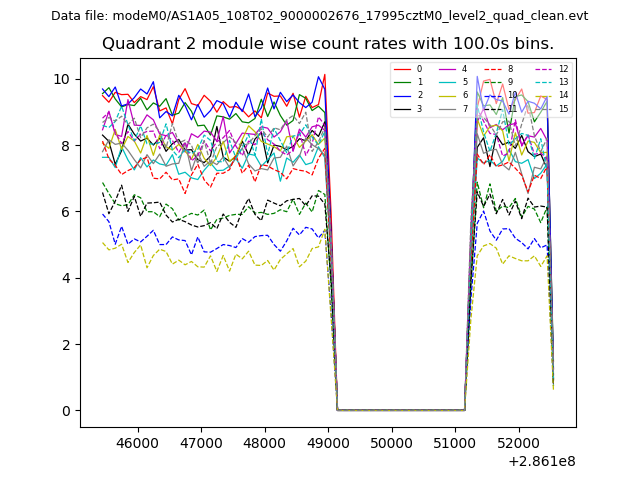 |
 |
| Module-wise count rates for Quadrant D Data is divided into 100 sec bins |
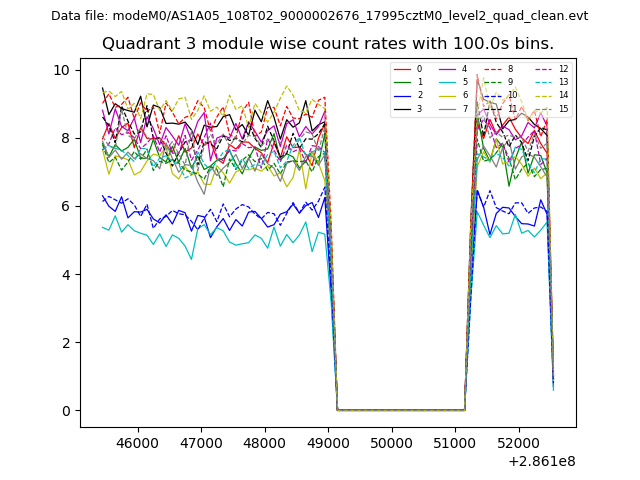 |
 |
| Parameter | Plot |
|---|---|
| CZT HV Monitor | 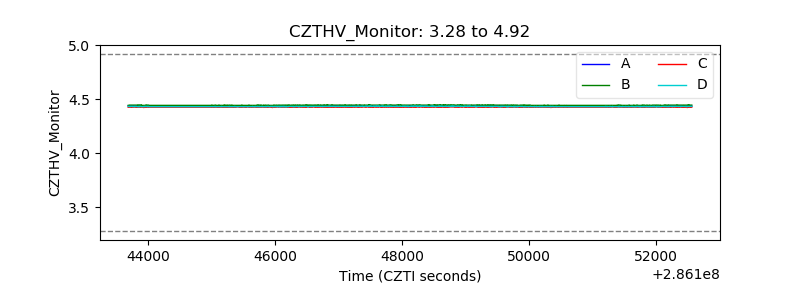 |
| D_VDD |  |
| Temperature 1 | 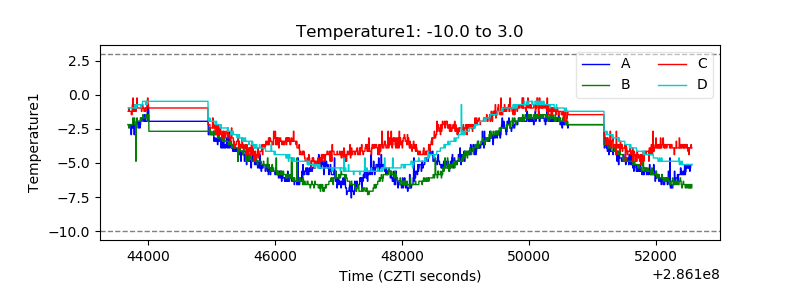 |
| Veto HV Monitor | 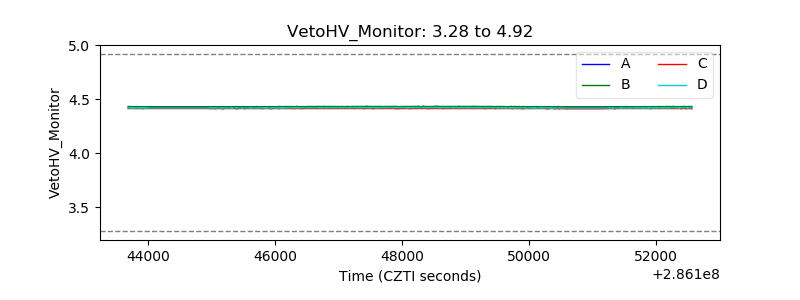 |
| Veto LLD | 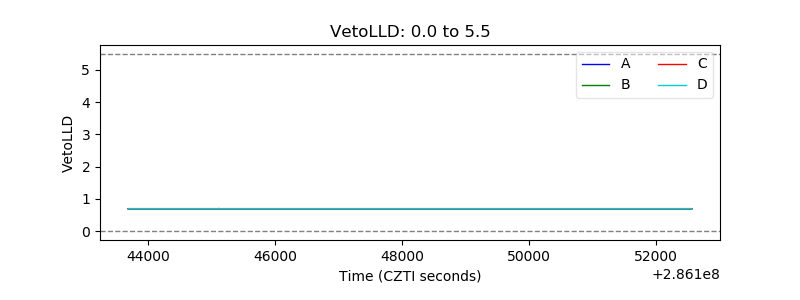 |
| Alpha Counter | 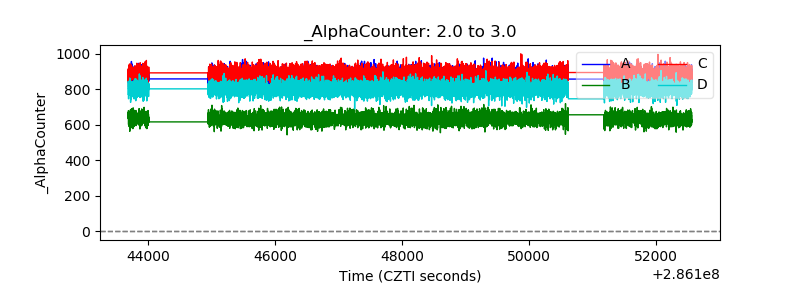 |
| _CPM_Rate | 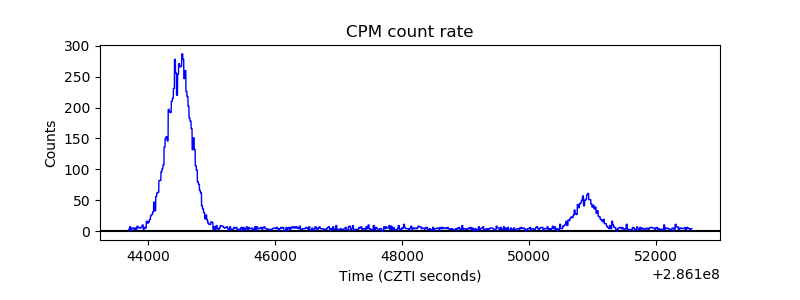 |
| CZT Counter | 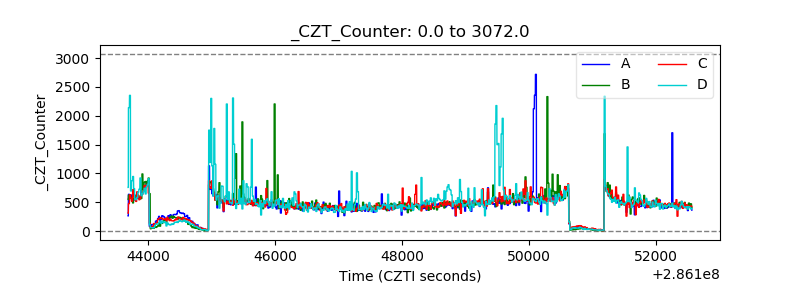 |
| +2.5 Volts monitor |  |
| +5 Volts monitor |  |
| _ROLL_ROT | 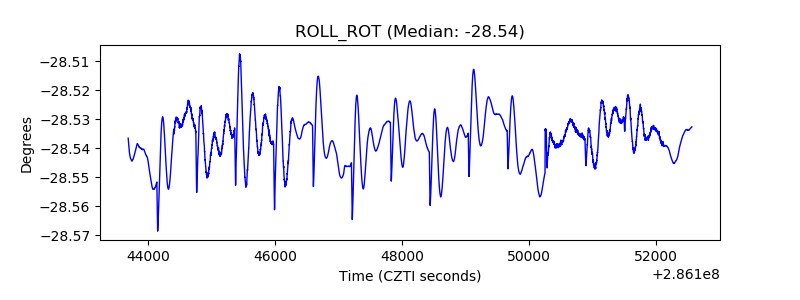 |
| _Roll_DEC | 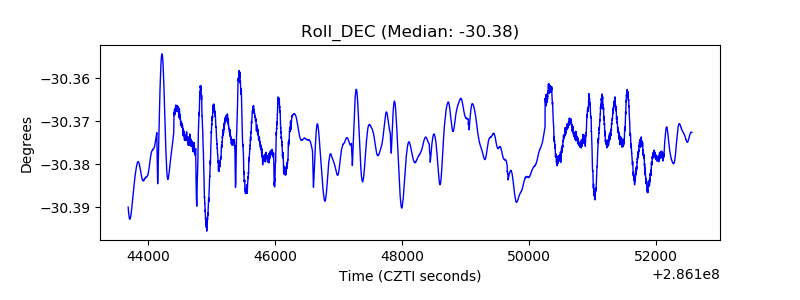 |
| _Roll_RA | 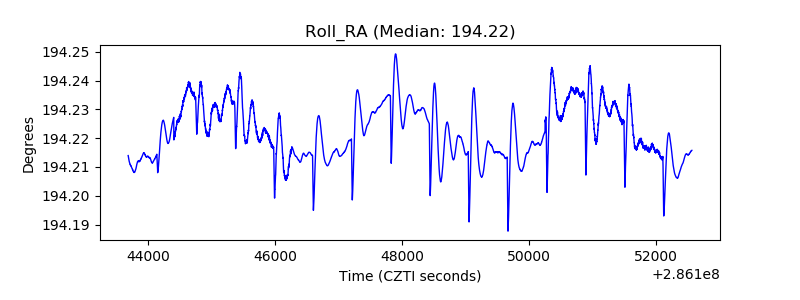 |
| Veto Counter | 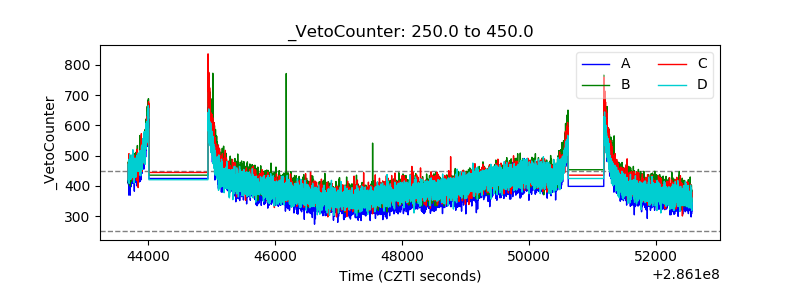 |