| Param | Original file | Final file |
|---|---|---|
| Filename | modeM0/AS1A05_108T02_9000002676_18000cztM0_level2.evt | modeM0/AS1A05_108T02_9000002676_18000cztM0_level2_quad_clean.evt |
| Size (bytes) | 1,588,792,320 | 270,714,240 |
| Size | 1.5 GB | 258.2 MB |
| Events in quadrant A | 11,184,300 | 1,666,571 |
| Events in quadrant B | 10,860,021 | 1,700,967 |
| Events in quadrant C | 11,814,664 | 1,643,423 |
| Events in quadrant D | 12,709,054 | 1,610,626 |
| Mode SS | |||
|---|---|---|---|
| Quadrant | BADHDUFLAG | Total packets | Discarded packets |
| A | 0 | 466 | 0 |
| B | 0 | 466 | 0 |
| C | 0 | 466 | 0 |
| D | 0 | 466 | 0 |
| Mode M9 | |||
|---|---|---|---|
| Quadrant | BADHDUFLAG | Total packets | Discarded packets |
| A | 0 | 19 | 0 |
| B | 0 | 19 | 0 |
| C | 0 | 19 | 0 |
| D | 0 | 19 | 0 |
| Mode M0 | |||
|---|---|---|---|
| Quadrant | BADHDUFLAG | Total packets | Discarded packets |
| A | 0 | 48441 | 4 |
| B | 0 | 47274 | 4 |
| C | 0 | 49210 | 4 |
| D | 0 | 53034 | 4 |
| Quadrant | Total seconds | Saturated seconds | Saturation percentage |
|---|---|---|---|
| A | 22924 | 150 | 0.654336% |
| B | 22924 | 200 | 0.872448% |
| C | 22924 | 364 | 1.587856% |
| D | 22924 | 274 | 1.195254% |
Noise dominated data is calculated using 1-second bins in cleaned event files. If a bin has >2000 counts, and if more than 50% of those come from <1% of pixels, then it is considered to be noise-dominated and hence unusable.
| Quadrant | # 1 sec bins | Bins with >0 counts | Bins with >2000 counts | High rate bins dominated by noise | Noise dominated (total time) | Noise dominated (detector-on time) | Marked lightcurve |
|---|---|---|---|---|---|---|---|
| A | 24774 | 22929 | 18 | 18 | 0.07% | 0.08% | 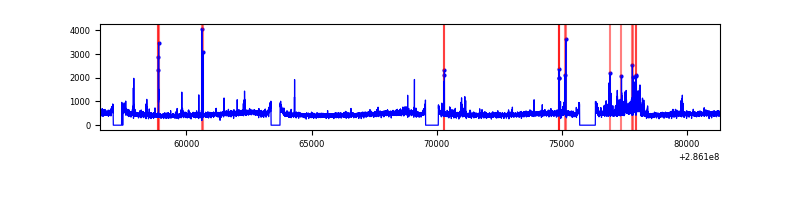 |
| B | 24774 | 22929 | 26 | 26 | 0.10% | 0.11% | 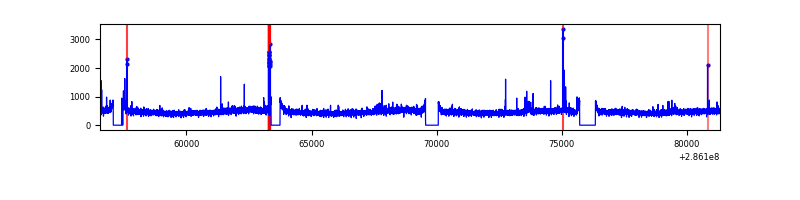 |
| C | 24774 | 22929 | 62 | 62 | 0.25% | 0.27% | 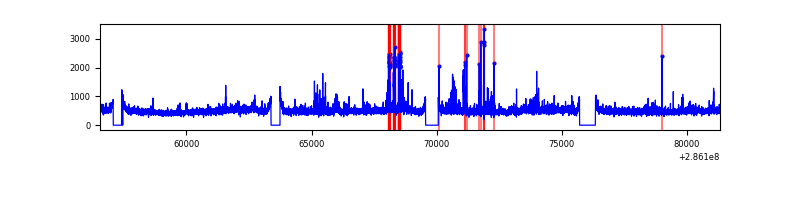 |
| D | 24774 | 22929 | 184 | 184 | 0.74% | 0.80% | 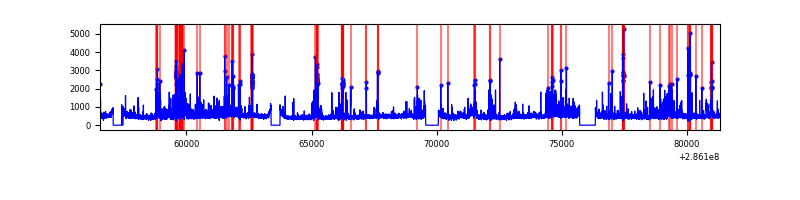 |
Top three noisy pixels from each quadrant. If the there are fewer than three noisy pixels in the level2.evt file, extra rows are filled as -1
| Pixel properties | Quadrant properties | ||||||
|---|---|---|---|---|---|---|---|
| Quadrant | DetID | PixID | Counts | Sigma | Mean | Median | Sigma |
| A | 15 | 174 | 582986 | 1050.79 | 2736 | 2676 | 552.3 |
| A | 4 | 2 | 57357 | 99.01 | 2736 | 2676 | 552.3 |
| A | 0 | 226 | 23802 | 38.25 | 2736 | 2676 | 552.3 |
| B | 4 | 173 | 77570 | 143.85 | 2729 | 2658 | 520.8 |
| B | 12 | 111 | 64662 | 119.06 | 2729 | 2658 | 520.8 |
| B | 11 | 111 | 55526 | 101.52 | 2729 | 2658 | 520.8 |
| C | 3 | 233 | 546914 | 881.31 | 2638 | 2650 | 617.6 |
| C | 0 | 207 | 508084 | 818.44 | 2638 | 2650 | 617.6 |
| C | 14 | 238 | 405304 | 652.01 | 2638 | 2650 | 617.6 |
| D | 5 | 222 | 1456008 | 2043.67 | 2637 | 2579 | 711.2 |
| D | 11 | 176 | 846839 | 1187.12 | 2637 | 2579 | 711.2 |
| D | 7 | 96 | 143278 | 197.84 | 2637 | 2579 | 711.2 |
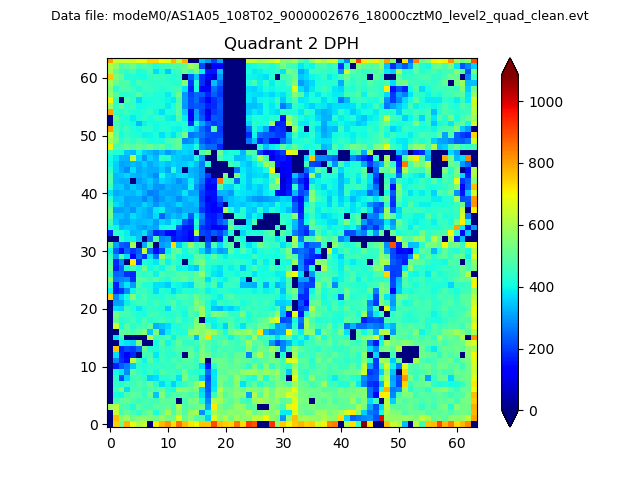
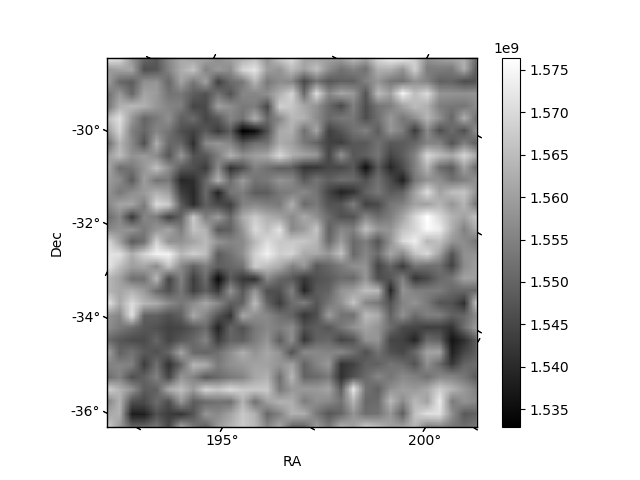
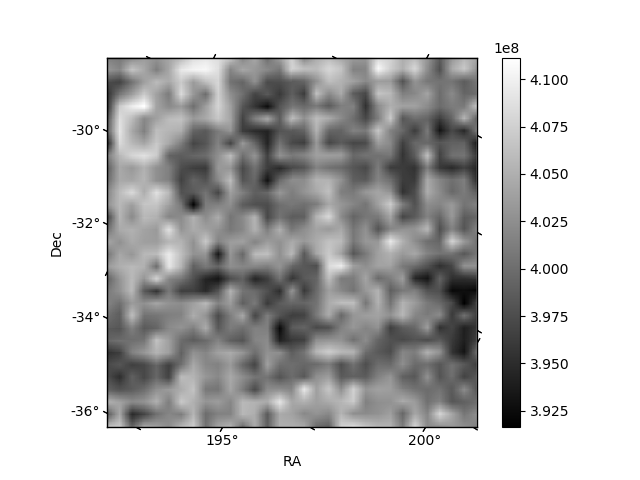
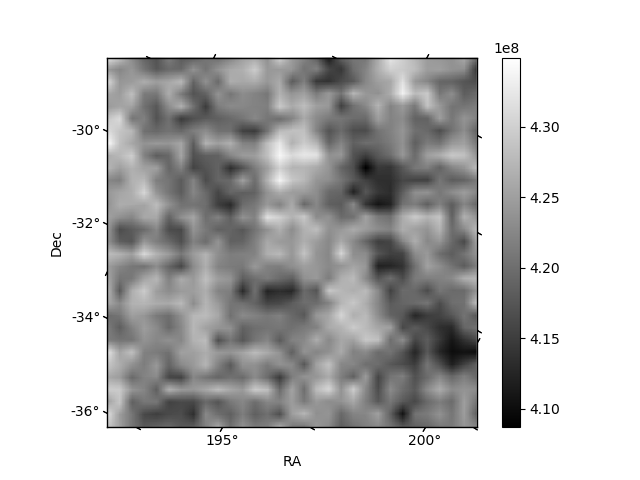
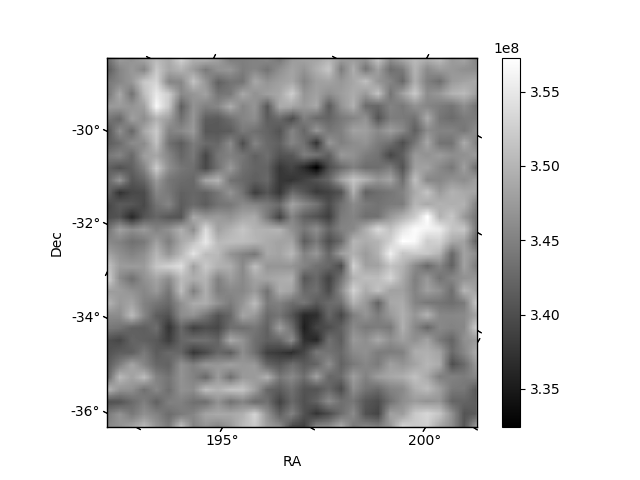
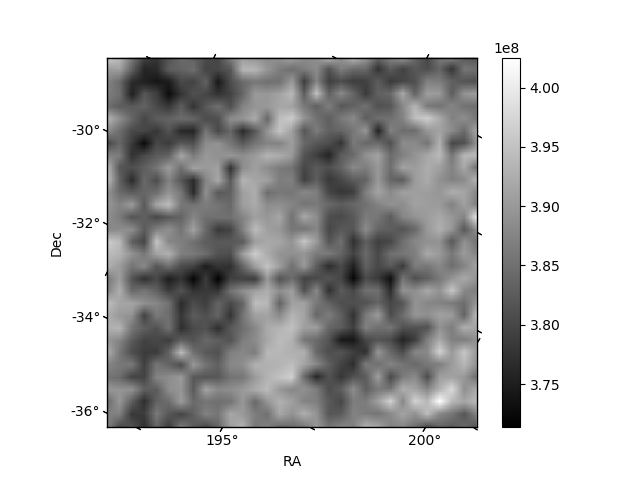
Histogram calculated using DETX and DETY for each event in the final _common_clean file
| Quadrant A | 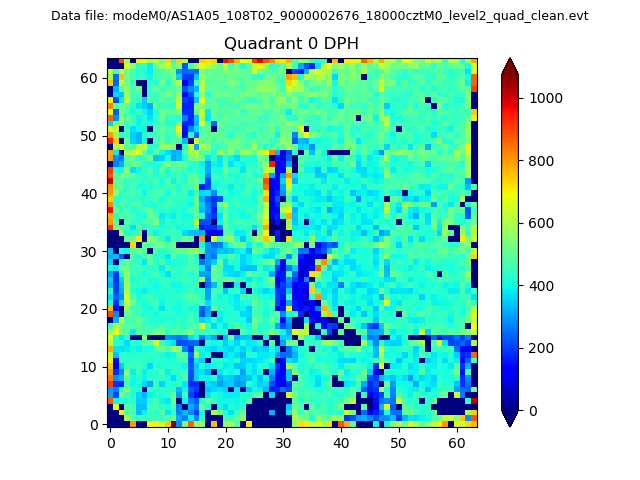 |
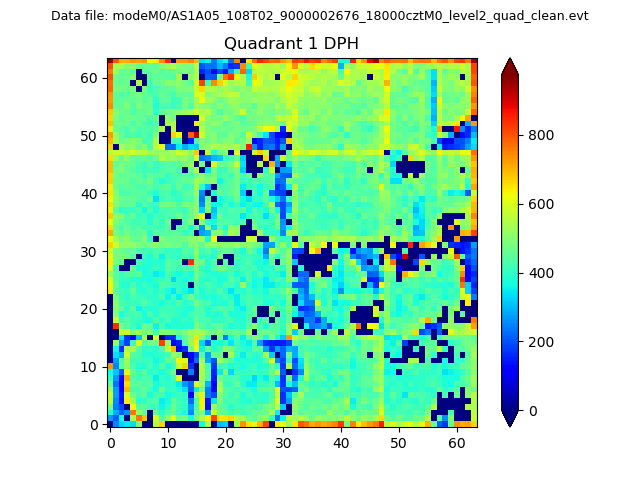 |
Quadrant B |
|---|---|---|---|
| Quadrant D | 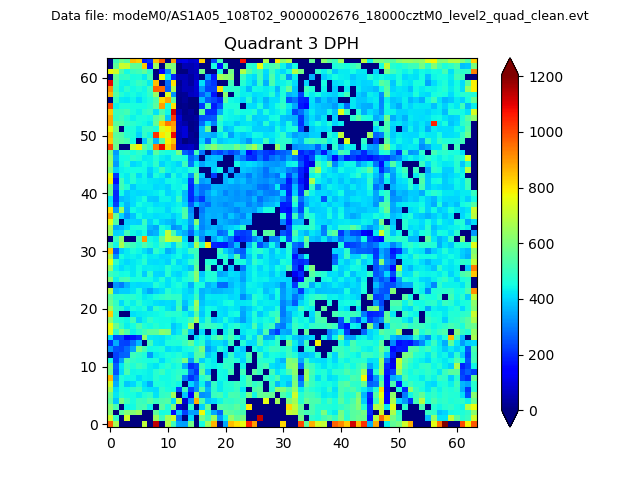 |
 |
Quadrant C |
| Plot type | Count rate plots | Images |
|---|---|---|
| Comparison with Poisson distribution Blue bars denote a histogram of data divided into 1 sec bins. Red curve is a Poisson curve with rate = median count rate of data. |
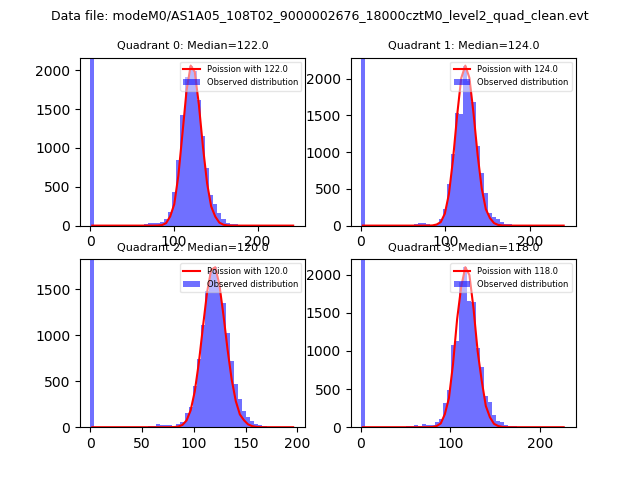 |
 |
| Quadrant-wise count rates Data is divided into 100 sec bins |
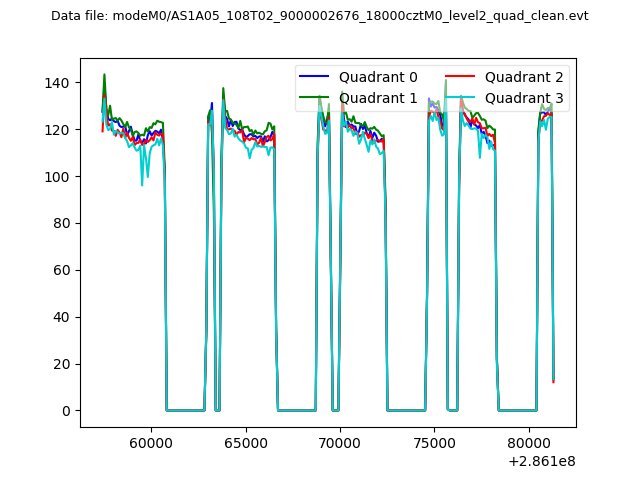 |
|
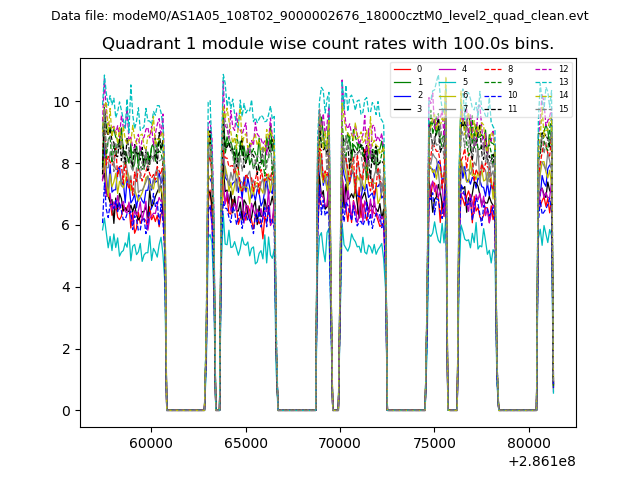
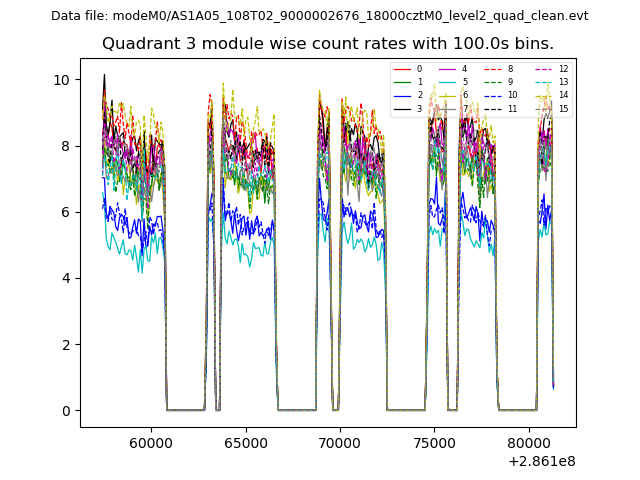
| Module-wise count rates for Quadrant A Data is divided into 100 sec bins |
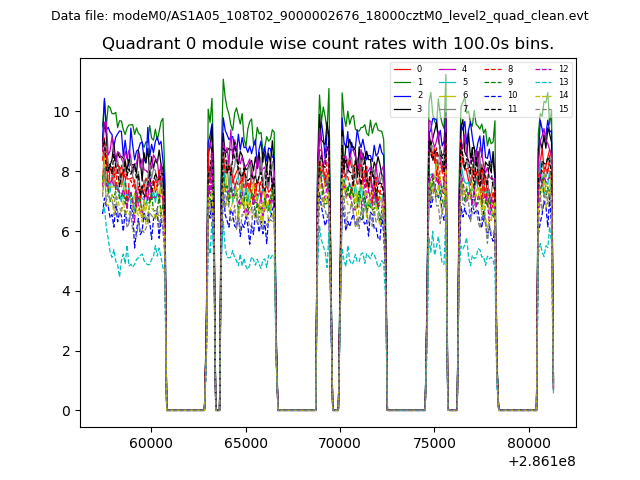 |
 |
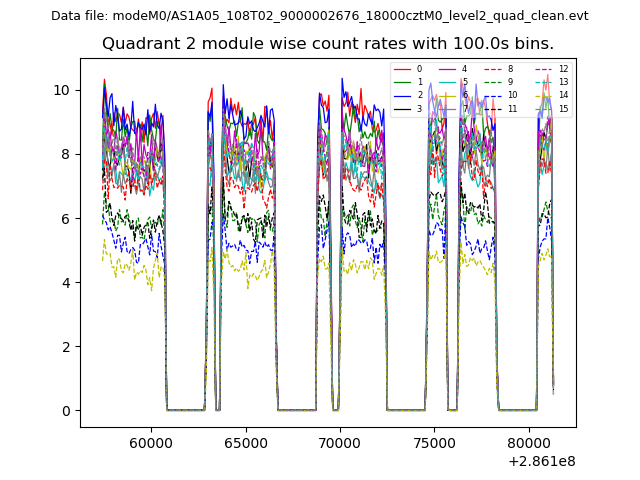
| Module-wise count rates for Quadrant B Data is divided into 100 sec bins |
 |
 |
| Module-wise count rates for Quadrant C Data is divided into 100 sec bins |
 |
 |
| Module-wise count rates for Quadrant D Data is divided into 100 sec bins |
 |
 |
| Parameter | Plot |
|---|---|
| CZT HV Monitor | 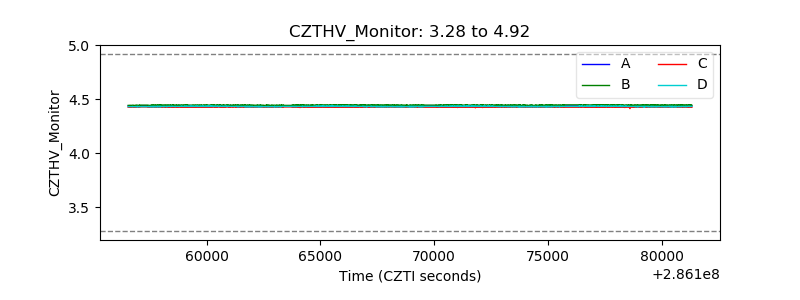 |
| D_VDD |  |
| Temperature 1 |  |
| Veto HV Monitor | 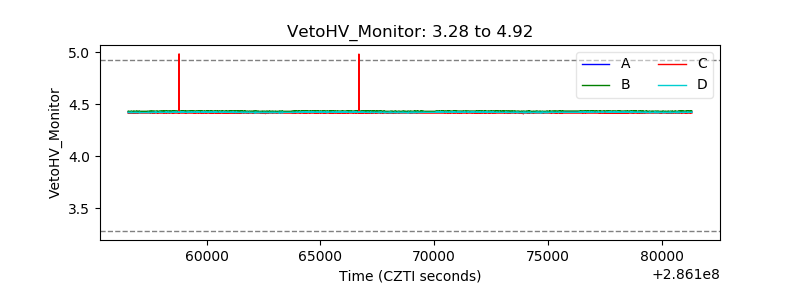 |
| Veto LLD |  |
| Alpha Counter | 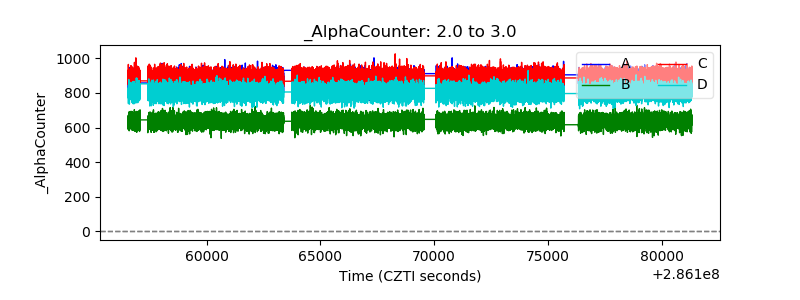 |
| _CPM_Rate | 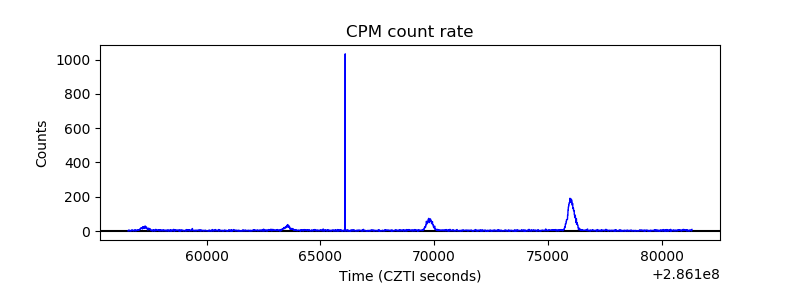 |
| CZT Counter | 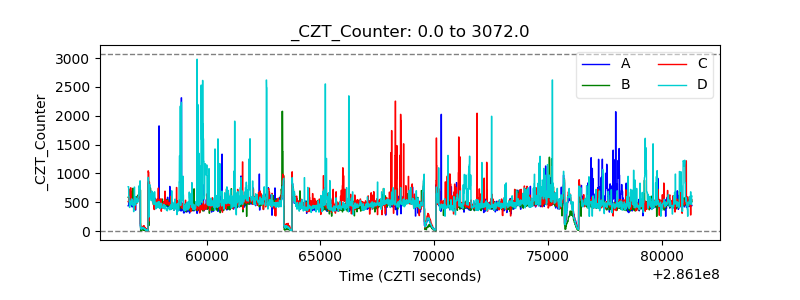 |
| +2.5 Volts monitor |  |
| +5 Volts monitor |  |
| _ROLL_ROT | 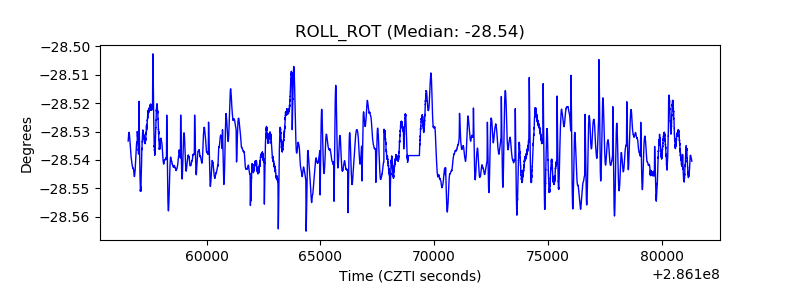 |
| _Roll_DEC | 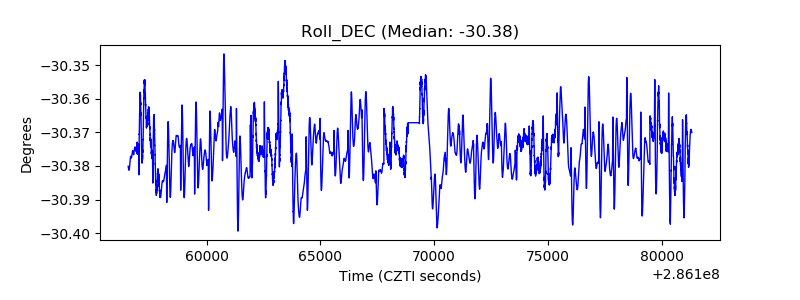 |
| _Roll_RA | 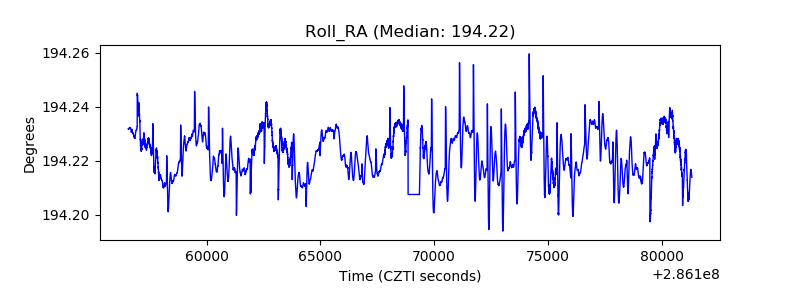 |
| Veto Counter | 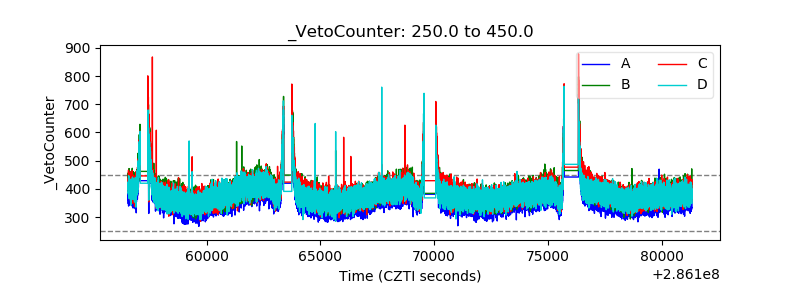 |