| Param | Original file | Final file |
|---|---|---|
| Filename | modeM0/AS1A05_108T02_9000002676_18001cztM0_level2.evt | modeM0/AS1A05_108T02_9000002676_18001cztM0_level2_quad_clean.evt |
| Size (bytes) | 1,891,886,400 | 328,449,600 |
| Size | 1.8 GB | 313.2 MB |
| Events in quadrant A | 13,425,972 | 2,028,894 |
| Events in quadrant B | 12,969,569 | 2,071,185 |
| Events in quadrant C | 14,005,698 | 1,998,243 |
| Events in quadrant D | 15,034,499 | 1,956,041 |
| Mode SS | |||
|---|---|---|---|
| Quadrant | BADHDUFLAG | Total packets | Discarded packets |
| A | 0 | 558 | 0 |
| B | 0 | 558 | 0 |
| C | 0 | 558 | 0 |
| D | 0 | 558 | 0 |
| Mode M9 | |||
|---|---|---|---|
| Quadrant | BADHDUFLAG | Total packets | Discarded packets |
| A | 0 | 19 | 0 |
| B | 0 | 19 | 0 |
| C | 0 | 19 | 0 |
| D | 0 | 19 | 0 |
| Mode M0 | |||
|---|---|---|---|
| Quadrant | BADHDUFLAG | Total packets | Discarded packets |
| A | 0 | 58199 | 4 |
| B | 0 | 56696 | 4 |
| C | 0 | 58588 | 4 |
| D | 0 | 63090 | 4 |
| Quadrant | Total seconds | Saturated seconds | Saturation percentage |
|---|---|---|---|
| A | 27544 | 160 | 0.580889% |
| B | 27544 | 210 | 0.762416% |
| C | 27544 | 386 | 1.401394% |
| D | 27544 | 295 | 1.071014% |
Noise dominated data is calculated using 1-second bins in cleaned event files. If a bin has >2000 counts, and if more than 50% of those come from <1% of pixels, then it is considered to be noise-dominated and hence unusable.
| Quadrant | # 1 sec bins | Bins with >0 counts | Bins with >2000 counts | High rate bins dominated by noise | Noise dominated (total time) | Noise dominated (detector-on time) | Marked lightcurve |
|---|---|---|---|---|---|---|---|
| A | 29394 | 27549 | 26 | 26 | 0.09% | 0.09% |  |
| B | 29394 | 27549 | 28 | 28 | 0.10% | 0.10% |  |
| C | 29394 | 27549 | 62 | 62 | 0.21% | 0.23% |  |
| D | 29394 | 27549 | 196 | 196 | 0.67% | 0.71% |  |
Top three noisy pixels from each quadrant. If the there are fewer than three noisy pixels in the level2.evt file, extra rows are filled as -1
| Pixel properties | Quadrant properties | ||||||
|---|---|---|---|---|---|---|---|
| Quadrant | DetID | PixID | Counts | Sigma | Mean | Median | Sigma |
| A | 15 | 174 | 744014 | 1122.82 | 3270 | 3194 | 659.8 |
| A | 4 | 2 | 88277 | 128.96 | 3270 | 3194 | 659.8 |
| A | 0 | 226 | 28410 | 38.22 | 3270 | 3194 | 659.8 |
| B | 4 | 173 | 78106 | 120.71 | 3262 | 3177 | 620.7 |
| B | 12 | 111 | 76744 | 118.51 | 3262 | 3177 | 620.7 |
| B | 11 | 111 | 66239 | 101.59 | 3262 | 3177 | 620.7 |
| C | 3 | 233 | 629726 | 849.55 | 3154 | 3172 | 737.5 |
| C | 0 | 207 | 513436 | 691.88 | 3154 | 3172 | 737.5 |
| C | 14 | 238 | 485536 | 654.05 | 3154 | 3172 | 737.5 |
| D | 5 | 222 | 1548845 | 1824.18 | 3151 | 3084 | 847.4 |
| D | 11 | 176 | 1075467 | 1265.54 | 3151 | 3084 | 847.4 |
| D | 7 | 96 | 149348 | 172.61 | 3151 | 3084 | 847.4 |
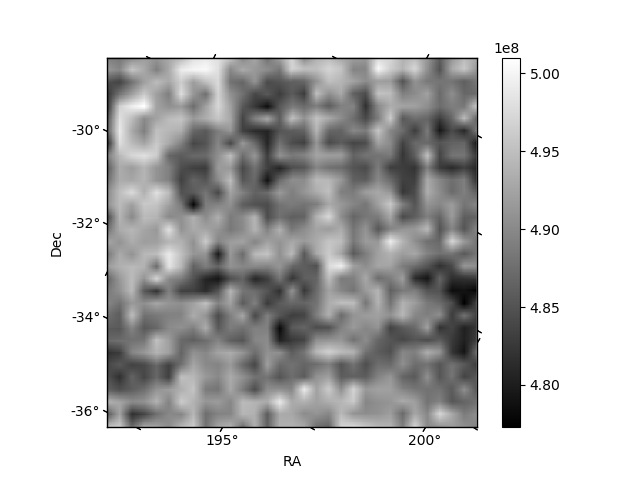
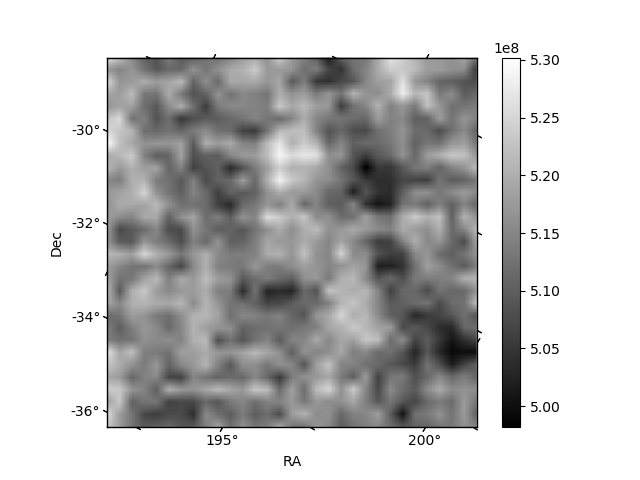
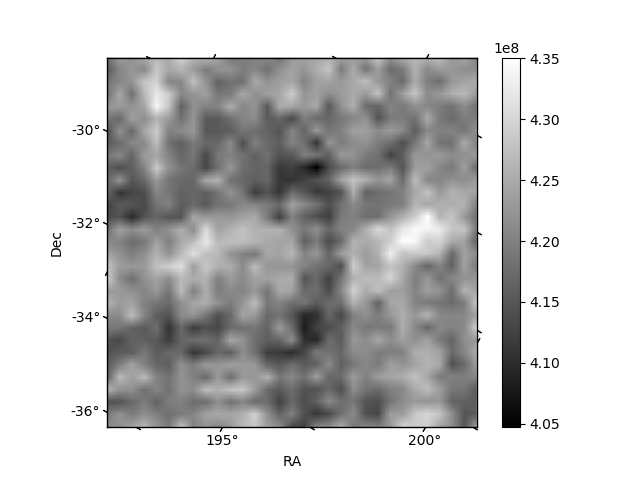
Histogram calculated using DETX and DETY for each event in the final _common_clean file
| Quadrant A |  |
 |
Quadrant B |
|---|---|---|---|
| Quadrant D | 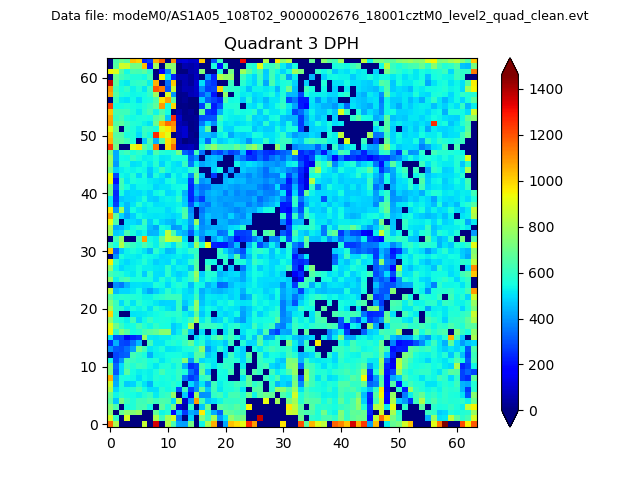 |
 |
Quadrant C |
| Plot type | Count rate plots | Images |
|---|---|---|
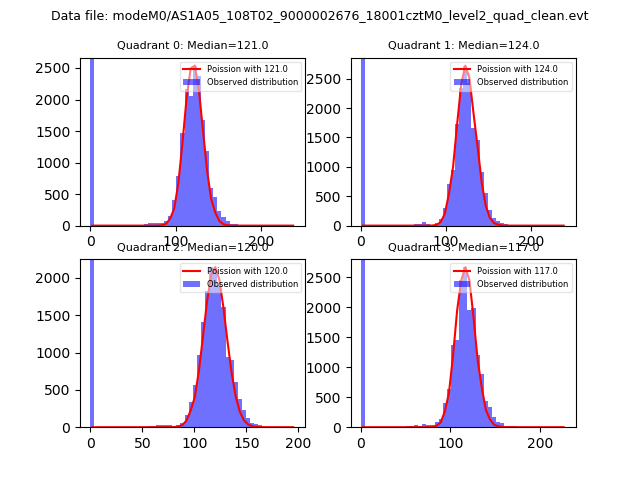
| Comparison with Poisson distribution Blue bars denote a histogram of data divided into 1 sec bins. Red curve is a Poisson curve with rate = median count rate of data. |
 |
 |
| Quadrant-wise count rates Data is divided into 100 sec bins |
 |
|
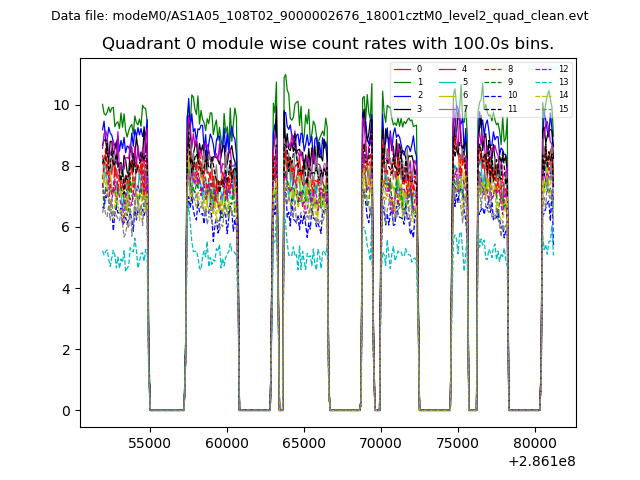
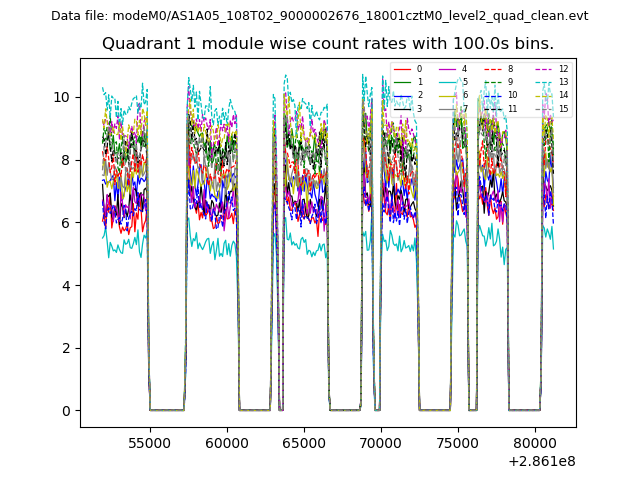
| Module-wise count rates for Quadrant A Data is divided into 100 sec bins |
 |
 |
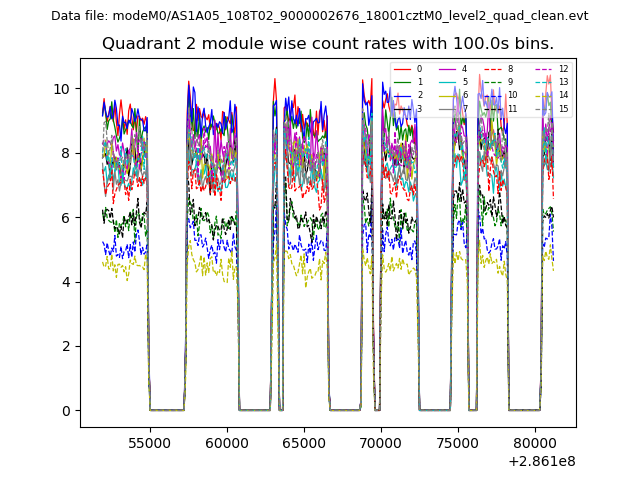
| Module-wise count rates for Quadrant B Data is divided into 100 sec bins |
 |
 |
| Module-wise count rates for Quadrant C Data is divided into 100 sec bins |
 |
 |
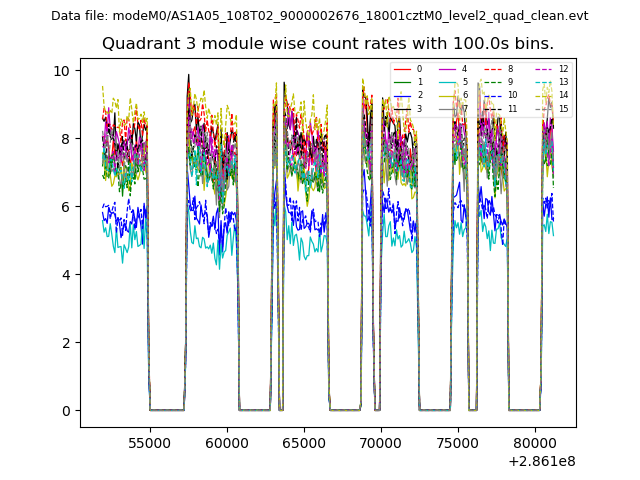
| Module-wise count rates for Quadrant D Data is divided into 100 sec bins |
 |
 |
| Parameter | Plot |
|---|---|
| CZT HV Monitor | 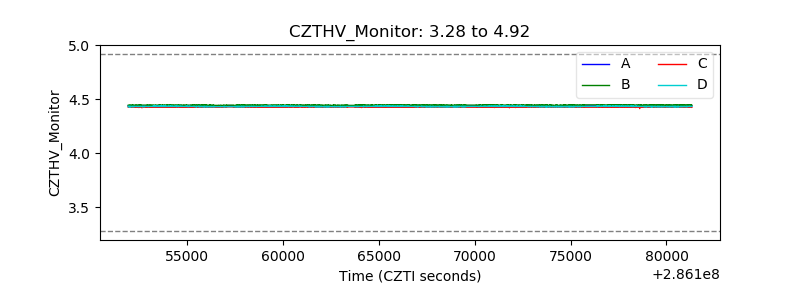 |
| D_VDD | 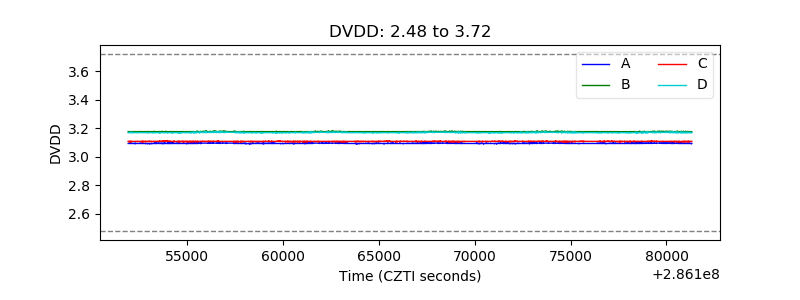 |
| Temperature 1 | 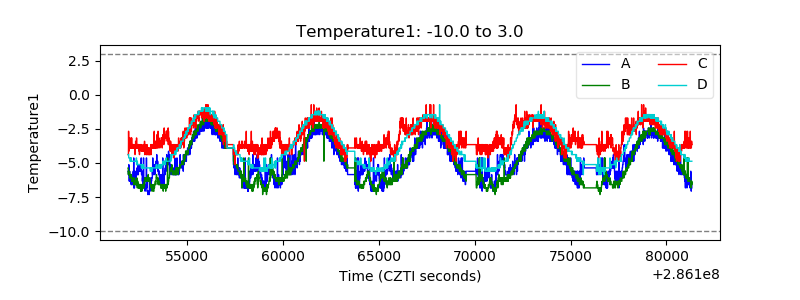 |
| Veto HV Monitor | 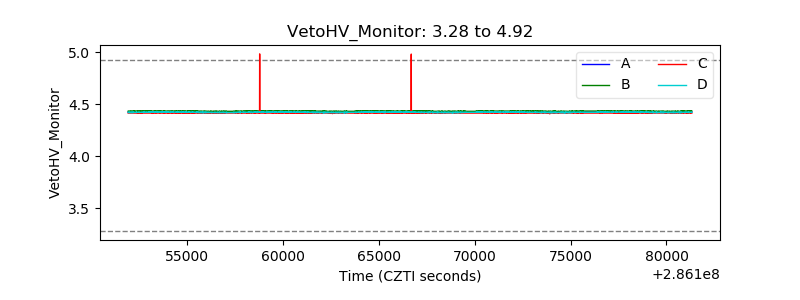 |
| Veto LLD | 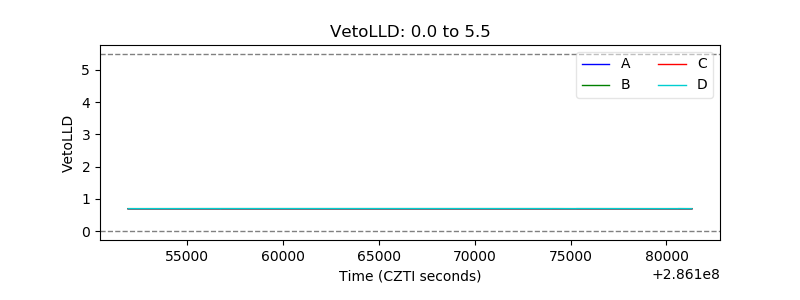 |
| Alpha Counter | 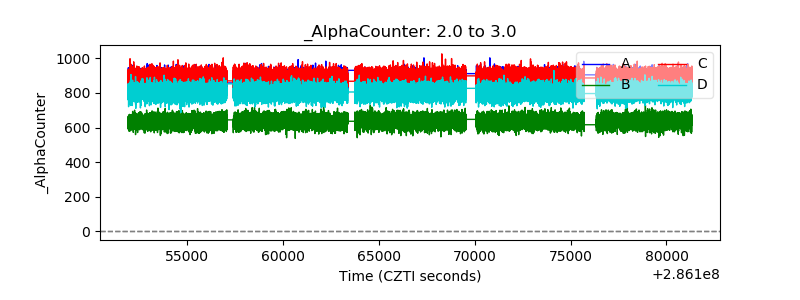 |
| _CPM_Rate | 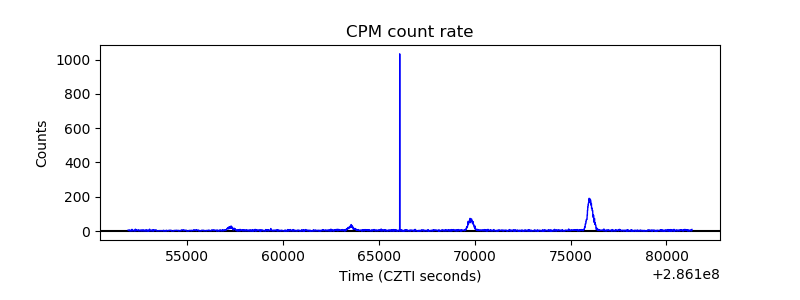 |
| CZT Counter | 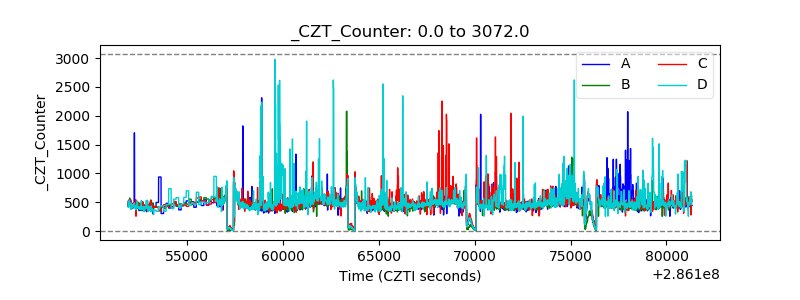 |
| +2.5 Volts monitor |  |
| +5 Volts monitor | 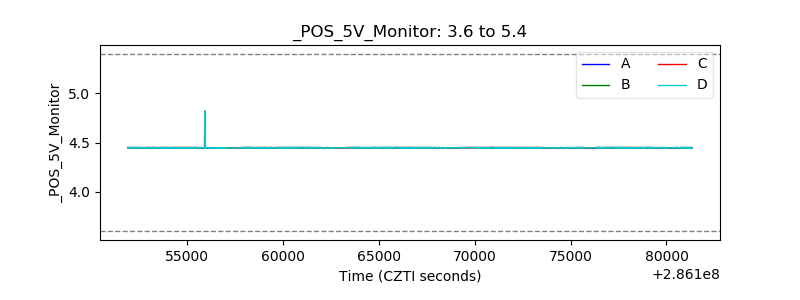 |
| _ROLL_ROT | 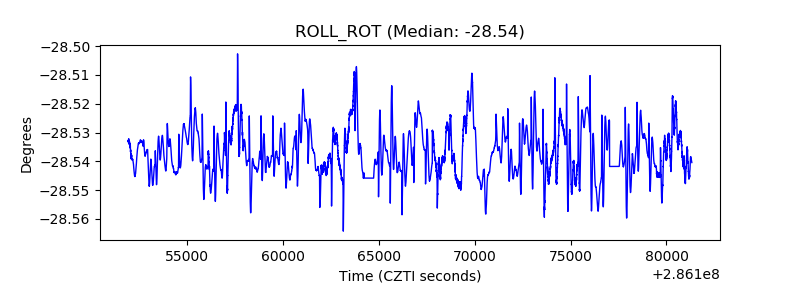 |
| _Roll_DEC | 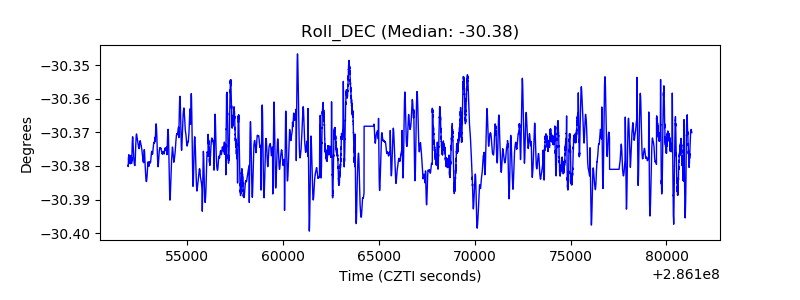 |
| _Roll_RA | 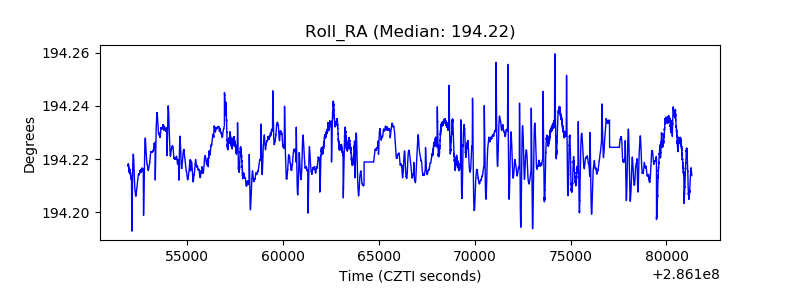 |
| Veto Counter | 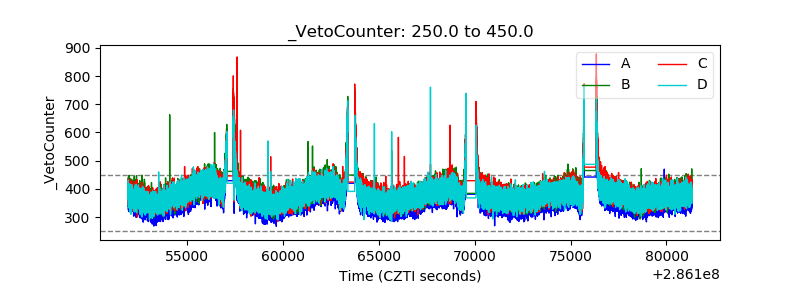 |