| Param | Original file | Final file |
|---|---|---|
| Filename | modeM0/AS1C04_009T03_9000002674_17977cztM0_level2.evt | modeM0/AS1C04_009T03_9000002674_17977cztM0_level2_quad_clean.evt |
| Size (bytes) | 265,443,840 | 76,867,200 |
| Size | 253.1 MB | 73.3 MB |
| Events in quadrant A | 1,802,484 | 528,049 |
| Events in quadrant B | 1,954,708 | 534,449 |
| Events in quadrant C | 1,818,497 | 508,538 |
| Events in quadrant D | 2,212,877 | 497,761 |
| Mode SS | |||
|---|---|---|---|
| Quadrant | BADHDUFLAG | Total packets | Discarded packets |
| A | 0 | 74 | 0 |
| B | 0 | 74 | 0 |
| C | 0 | 74 | 0 |
| D | 0 | 74 | 0 |
| Mode M0 | |||
|---|---|---|---|
| Quadrant | BADHDUFLAG | Total packets | Discarded packets |
| A | 0 | 7765 | 1 |
| B | 0 | 8295 | 1 |
| C | 0 | 7754 | 2 |
| D | 0 | 9093 | 1 |
| Mode M9 | |||
|---|---|---|---|
| Quadrant | BADHDUFLAG | Total packets | Discarded packets |
| A | 0 | 14 | 0 |
| B | 0 | 14 | 0 |
| C | 0 | 14 | 0 |
| D | 0 | 14 | 0 |
| Quadrant | Total seconds | Saturated seconds | Saturation percentage |
|---|---|---|---|
| A | 3667 | 50 | 1.363512% |
| B | 3667 | 69 | 1.881647% |
| C | 3666 | 57 | 1.554828% |
| D | 3666 | 179 | 4.882706% |
Noise dominated data is calculated using 1-second bins in cleaned event files. If a bin has >2000 counts, and if more than 50% of those come from <1% of pixels, then it is considered to be noise-dominated and hence unusable.
| Quadrant | # 1 sec bins | Bins with >0 counts | Bins with >2000 counts | High rate bins dominated by noise | Noise dominated (total time) | Noise dominated (detector-on time) | Marked lightcurve |
|---|---|---|---|---|---|---|---|
| A | 5007 | 3668 | 4 | 4 | 0.08% | 0.11% | 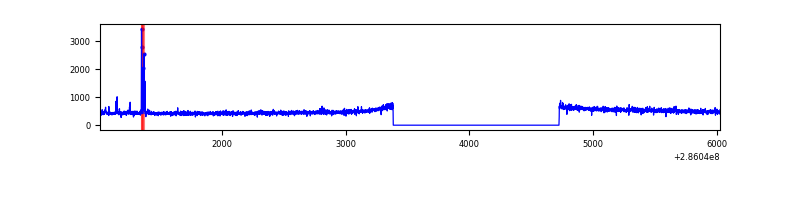 |
| B | 5007 | 3668 | 12 | 12 | 0.24% | 0.33% | 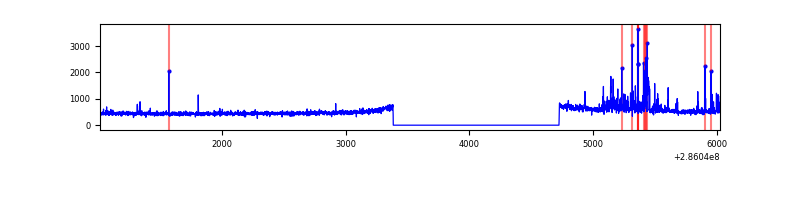 |
| C | 5006 | 3667 | 0 | 0 | 0.00% | 0.00% | 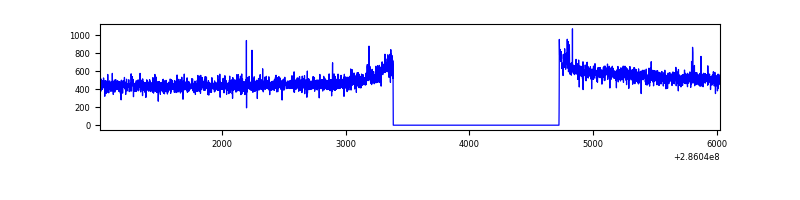 |
| D | 5006 | 3667 | 147 | 147 | 2.94% | 4.01% | 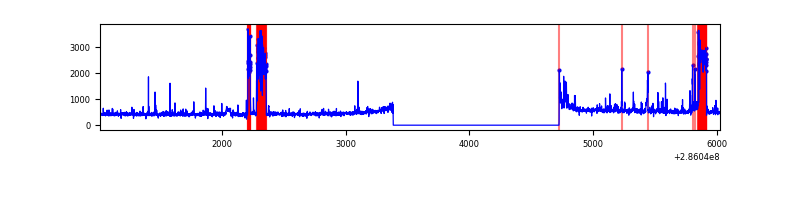 |
Top three noisy pixels from each quadrant. If the there are fewer than three noisy pixels in the level2.evt file, extra rows are filled as -1
| Pixel properties | Quadrant properties | ||||||
|---|---|---|---|---|---|---|---|
| Quadrant | DetID | PixID | Counts | Sigma | Mean | Median | Sigma |
| A | 15 | 174 | 38762 | 406.04 | 459 | 449 | 94.4 |
| A | 0 | 226 | 4047 | 38.13 | 459 | 449 | 94.4 |
| A | 12 | 194 | 3392 | 31.19 | 459 | 449 | 94.4 |
| B | 7 | 220 | 124119 | 1434.96 | 461 | 450 | 86.2 |
| B | 0 | 219 | 9815 | 108.66 | 461 | 450 | 86.2 |
| B | 12 | 111 | 9564 | 105.75 | 461 | 450 | 86.2 |
| C | 14 | 238 | 70719 | 686.59 | 441 | 443 | 102.4 |
| C | 3 | 233 | 14689 | 139.18 | 441 | 443 | 102.4 |
| C | 0 | 207 | 4499 | 39.63 | 441 | 443 | 102.4 |
| D | 7 | 238 | 436472 | 3685.19 | 437 | 428 | 118.3 |
| D | 7 | 38 | 25062 | 208.19 | 437 | 428 | 118.3 |
| D | 10 | 70 | 18709 | 154.5 | 437 | 428 | 118.3 |
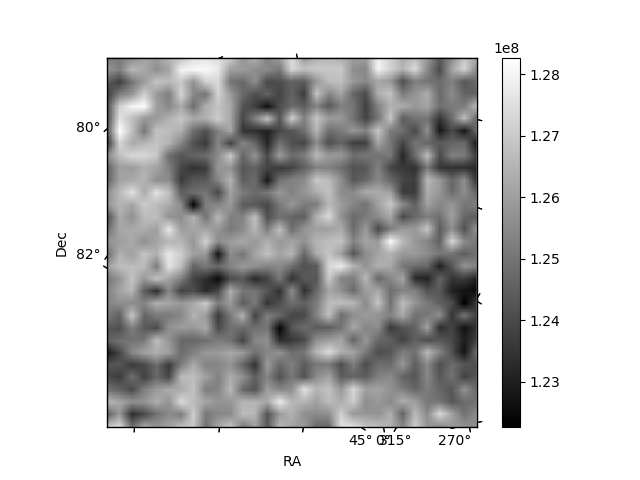
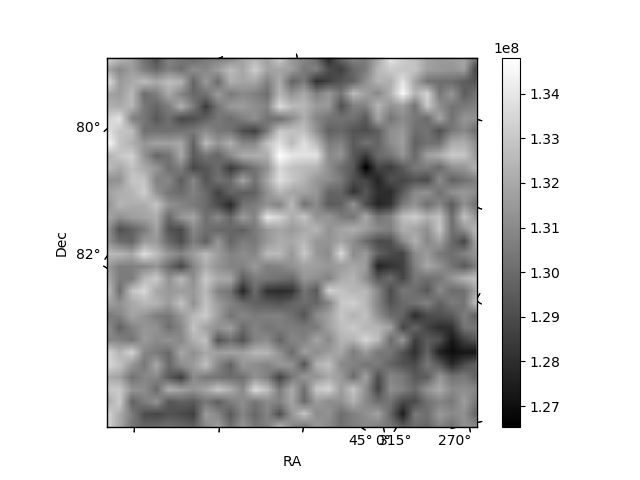
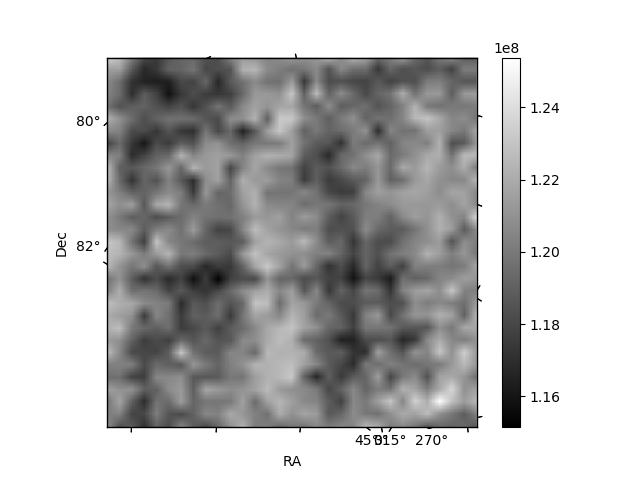
Histogram calculated using DETX and DETY for each event in the final _common_clean file
| Quadrant A | 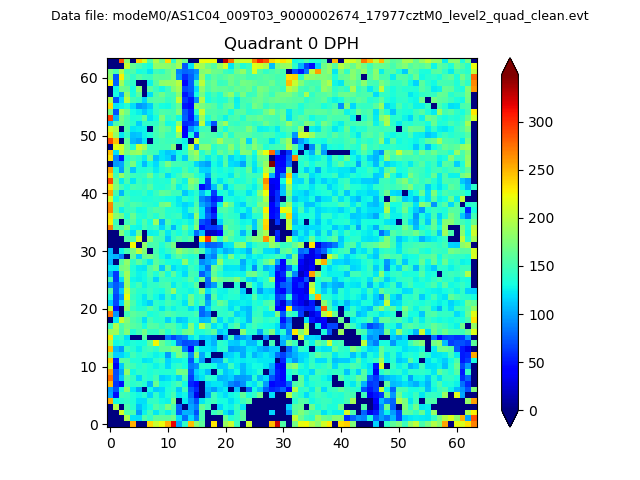 |
 |
Quadrant B |
|---|---|---|---|
| Quadrant D | 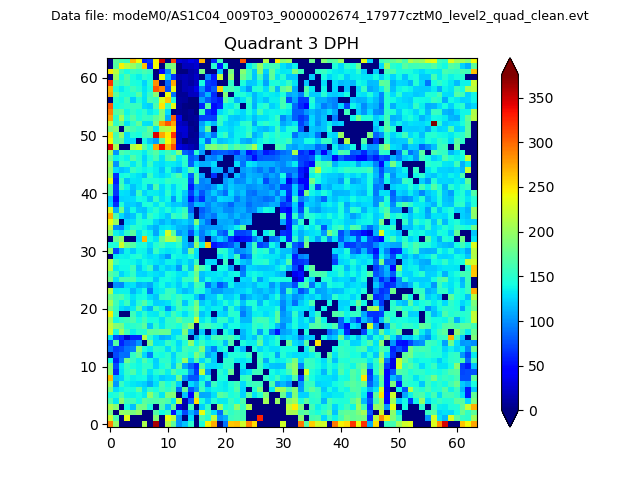 |
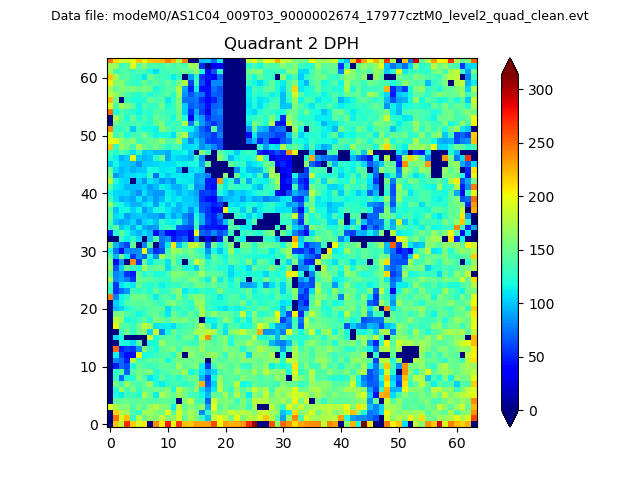 |
Quadrant C |
| Plot type | Count rate plots | Images |
|---|---|---|
| Comparison with Poisson distribution Blue bars denote a histogram of data divided into 1 sec bins. Red curve is a Poisson curve with rate = median count rate of data. |
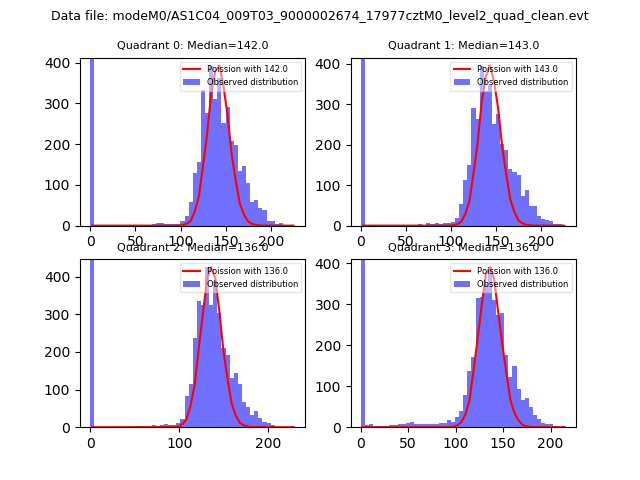 |
 |
| Quadrant-wise count rates Data is divided into 100 sec bins |
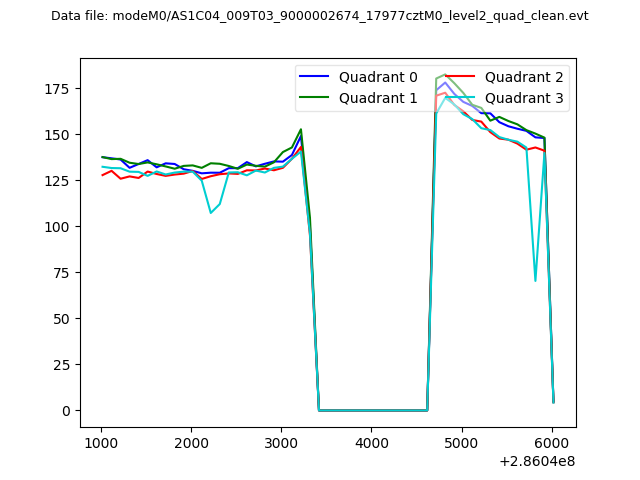 |
|
| Module-wise count rates for Quadrant A Data is divided into 100 sec bins |
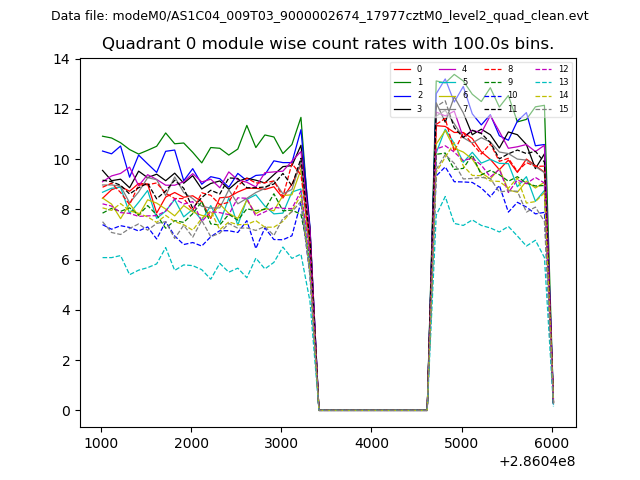 |
 |
| Module-wise count rates for Quadrant B Data is divided into 100 sec bins |
 |
 |
| Module-wise count rates for Quadrant C Data is divided into 100 sec bins |
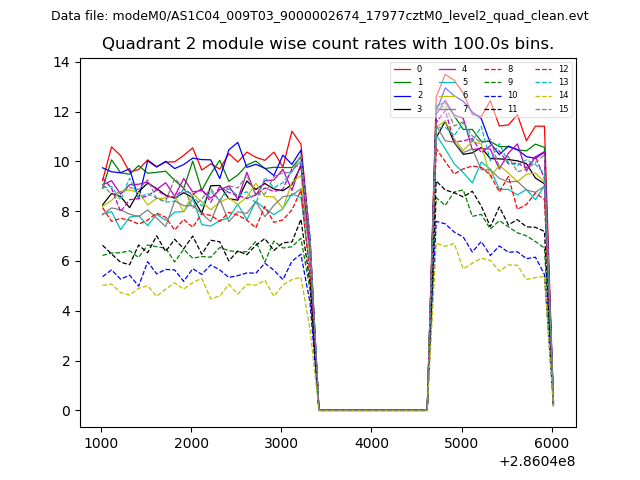 |
 |
| Module-wise count rates for Quadrant D Data is divided into 100 sec bins |
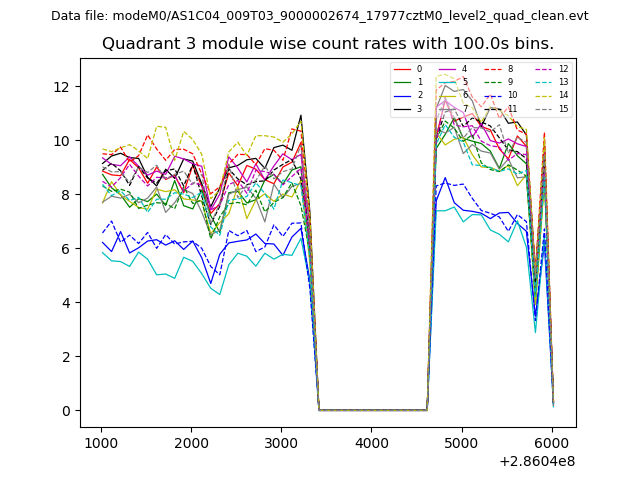 |
 |
| Parameter | Plot |
|---|---|
| CZT HV Monitor | 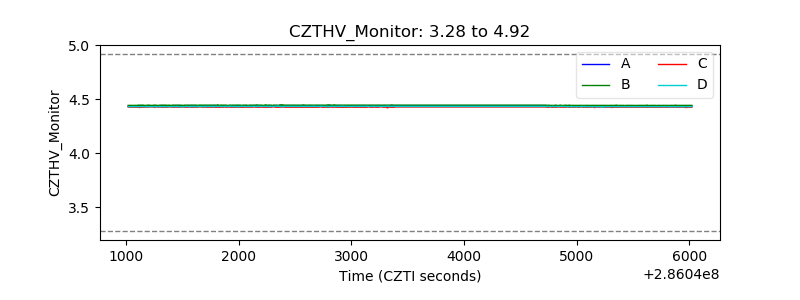 |
| D_VDD | 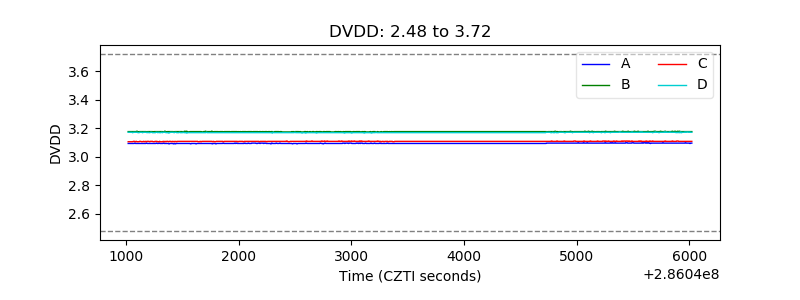 |
| Temperature 1 | 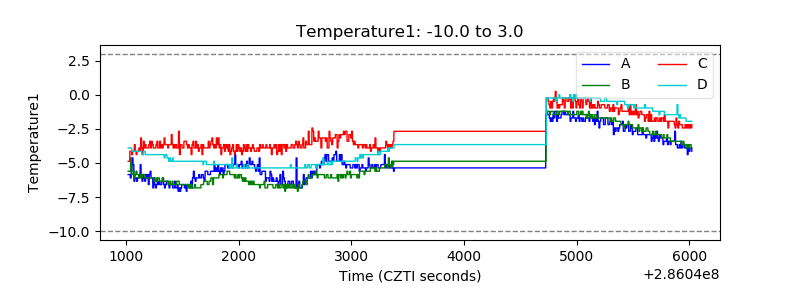 |
| Veto HV Monitor | 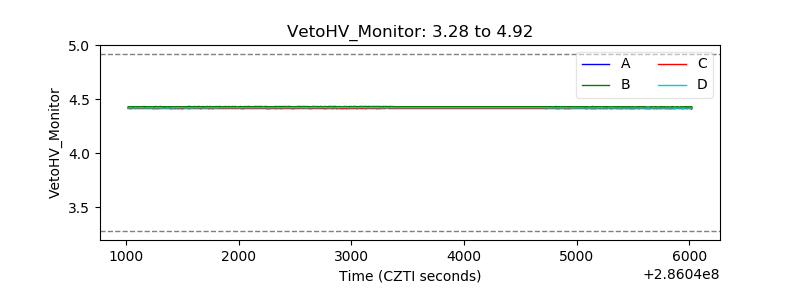 |
| Veto LLD | 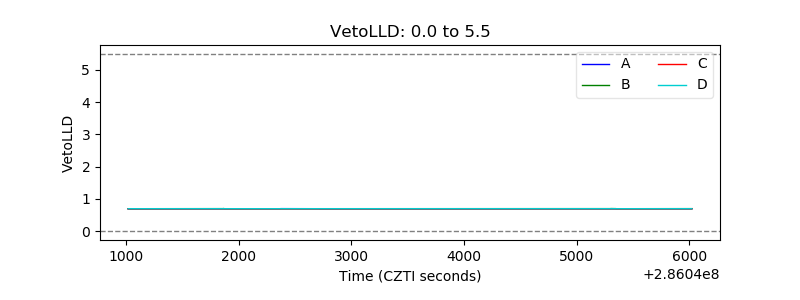 |
| Alpha Counter | 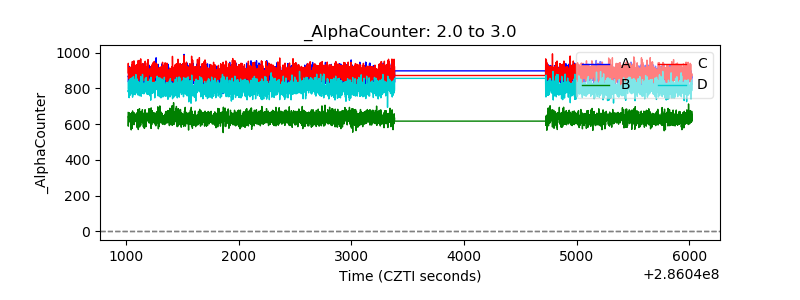 |
| _CPM_Rate | 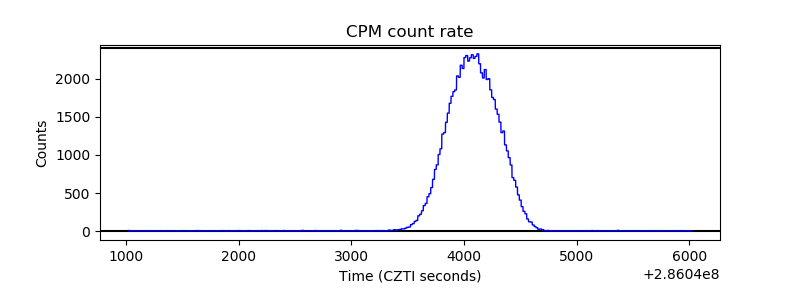 |
| CZT Counter | 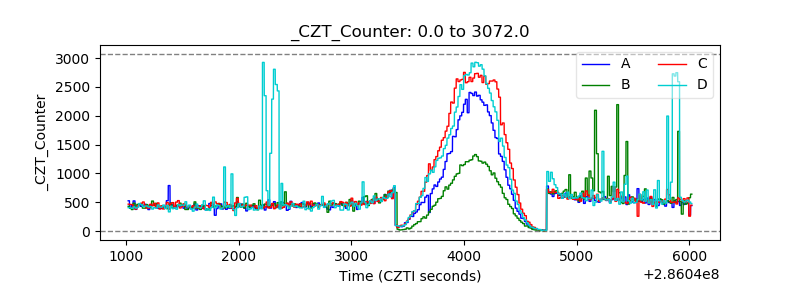 |
| +2.5 Volts monitor | 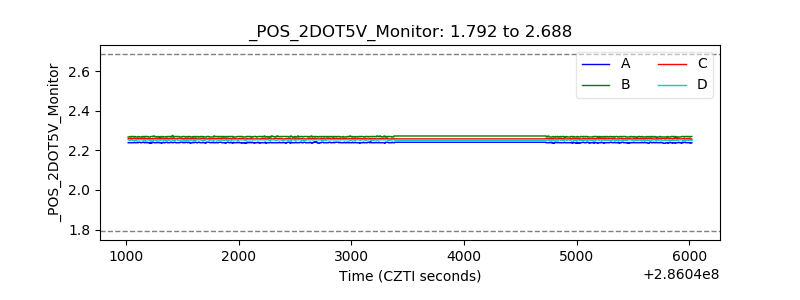 |
| +5 Volts monitor |  |
| _ROLL_ROT | 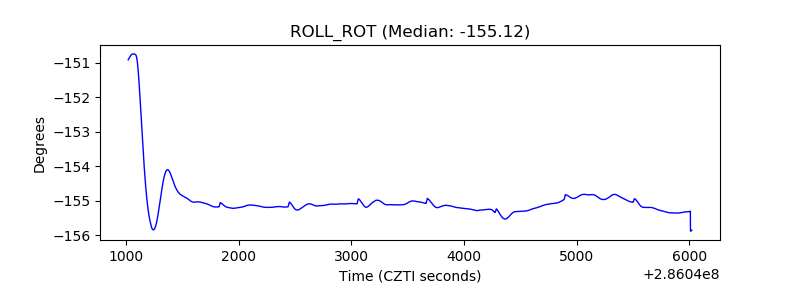 |
| _Roll_DEC | 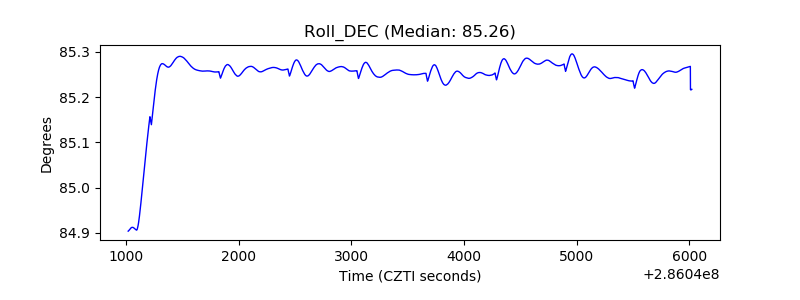 |
| _Roll_RA | 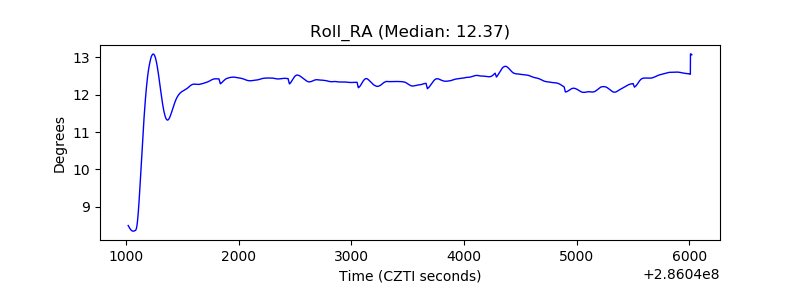 |
| Veto Counter | 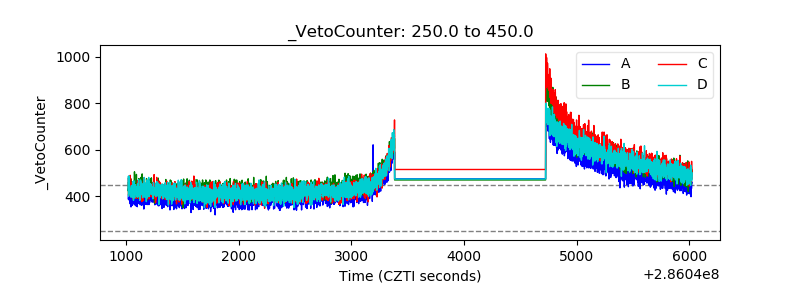 |