| Param | Original file | Final file |
|---|---|---|
| Filename | modeM0/AS1C04_009T03_9000002674_17978cztM0_level2.evt | modeM0/AS1C04_009T03_9000002674_17978cztM0_level2_quad_clean.evt |
| Size (bytes) | 338,094,720 | 98,236,800 |
| Size | 322.4 MB | 93.7 MB |
| Events in quadrant A | 2,256,303 | 669,920 |
| Events in quadrant B | 2,483,142 | 680,886 |
| Events in quadrant C | 2,314,277 | 654,329 |
| Events in quadrant D | 2,859,125 | 633,883 |
| Mode SS | |||
|---|---|---|---|
| Quadrant | BADHDUFLAG | Total packets | Discarded packets |
| A | 0 | 98 | 0 |
| B | 0 | 98 | 0 |
| C | 0 | 98 | 0 |
| D | 0 | 98 | 0 |
| Mode M0 | |||
|---|---|---|---|
| Quadrant | BADHDUFLAG | Total packets | Discarded packets |
| A | 0 | 9873 | 0 |
| B | 0 | 10588 | 0 |
| C | 0 | 9929 | 0 |
| D | 0 | 11774 | 0 |
| Mode M9 | |||
|---|---|---|---|
| Quadrant | BADHDUFLAG | Total packets | Discarded packets |
| A | 0 | 6 | 0 |
| B | 0 | 6 | 0 |
| C | 0 | 6 | 0 |
| D | 0 | 6 | 0 |
| Quadrant | Total seconds | Saturated seconds | Saturation percentage |
|---|---|---|---|
| A | 4787 | 30 | 0.626697% |
| B | 4788 | 69 | 1.441103% |
| C | 4788 | 65 | 1.357561% |
| D | 4788 | 229 | 4.782790% |
Noise dominated data is calculated using 1-second bins in cleaned event files. If a bin has >2000 counts, and if more than 50% of those come from <1% of pixels, then it is considered to be noise-dominated and hence unusable.
| Quadrant | # 1 sec bins | Bins with >0 counts | Bins with >2000 counts | High rate bins dominated by noise | Noise dominated (total time) | Noise dominated (detector-on time) | Marked lightcurve |
|---|---|---|---|---|---|---|---|
| A | 4787 | 4787 | 0 | 0 | 0.00% | 0.00% | 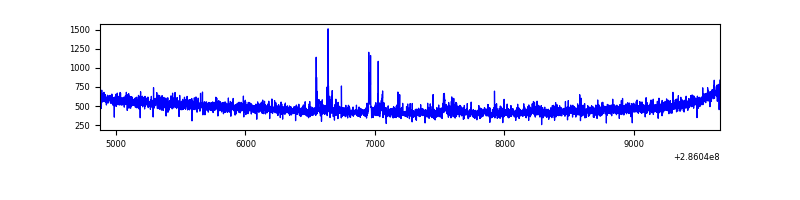 |
| B | 4788 | 4788 | 16 | 16 | 0.33% | 0.33% | 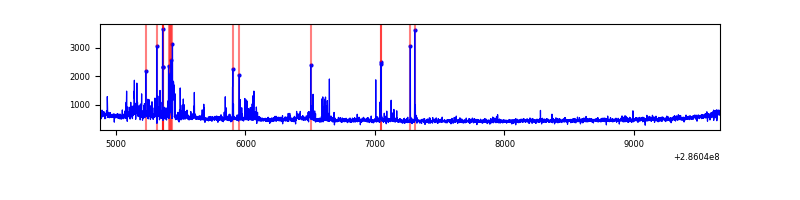 |
| C | 4788 | 4788 | 2 | 2 | 0.04% | 0.04% | 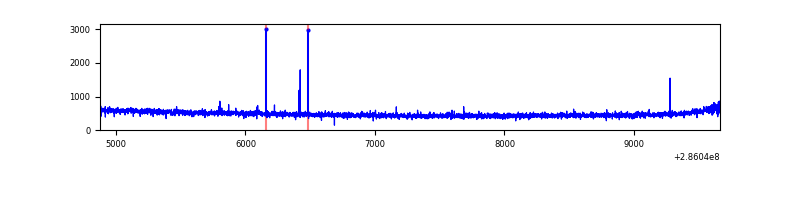 |
| D | 4788 | 4788 | 164 | 164 | 3.43% | 3.43% | 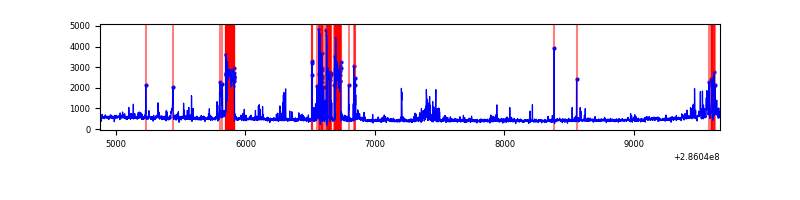 |
Top three noisy pixels from each quadrant. If the there are fewer than three noisy pixels in the level2.evt file, extra rows are filled as -1
| Pixel properties | Quadrant properties | ||||||
|---|---|---|---|---|---|---|---|
| Quadrant | DetID | PixID | Counts | Sigma | Mean | Median | Sigma |
| A | 14 | 237 | 20885 | 174.63 | 577 | 564 | 116.4 |
| A | 15 | 174 | 20707 | 173.1 | 577 | 564 | 116.4 |
| A | 0 | 226 | 4946 | 37.66 | 577 | 564 | 116.4 |
| B | 7 | 220 | 124555 | 1147.93 | 579 | 565 | 108.0 |
| B | 0 | 197 | 39916 | 364.32 | 579 | 565 | 108.0 |
| B | 0 | 198 | 12264 | 108.31 | 579 | 565 | 108.0 |
| C | 14 | 238 | 88081 | 676.86 | 561 | 565 | 129.3 |
| C | 3 | 233 | 18810 | 141.11 | 561 | 565 | 129.3 |
| C | 9 | 160 | 10687 | 78.29 | 561 | 565 | 129.3 |
| D | 7 | 238 | 501926 | 3448.14 | 549 | 538 | 145.4 |
| D | 10 | 70 | 106554 | 729.09 | 549 | 538 | 145.4 |
| D | 5 | 222 | 74882 | 511.28 | 549 | 538 | 145.4 |
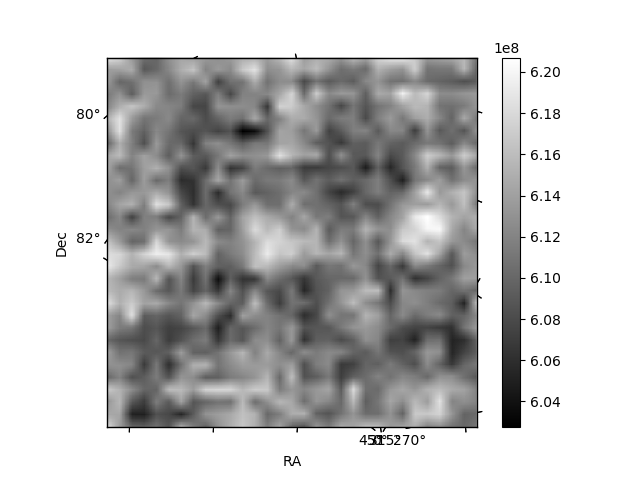
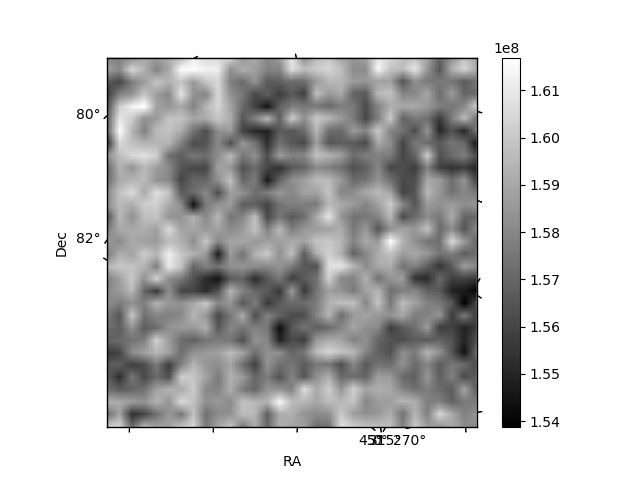
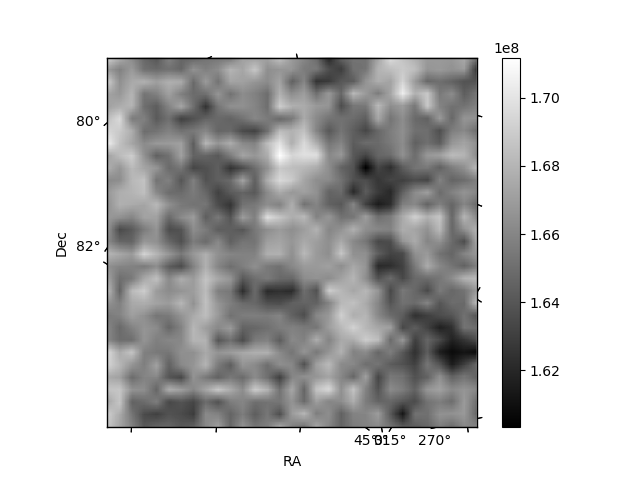
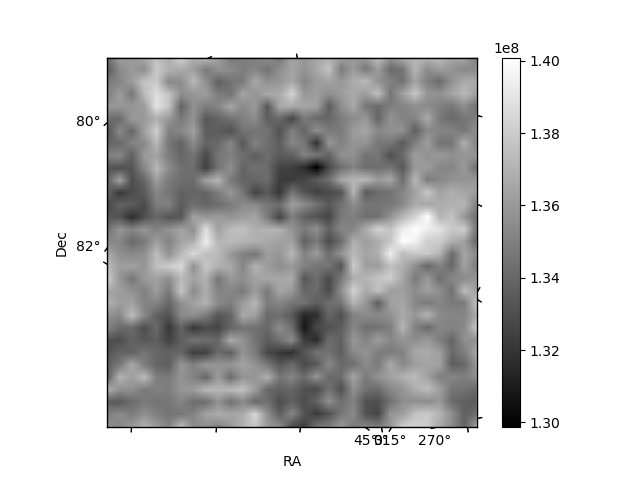
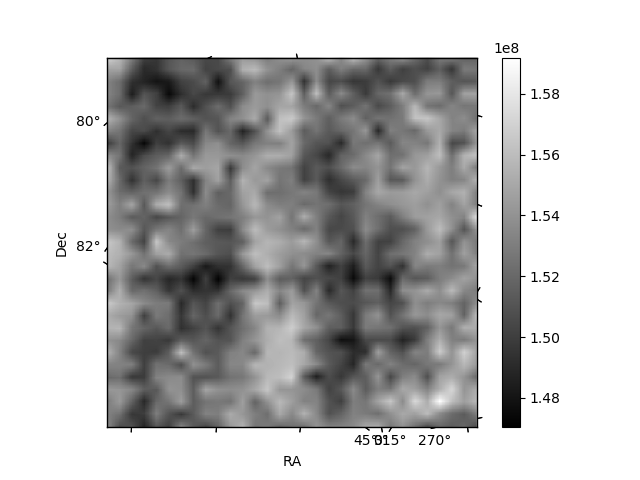
Histogram calculated using DETX and DETY for each event in the final _common_clean file
| Quadrant A | 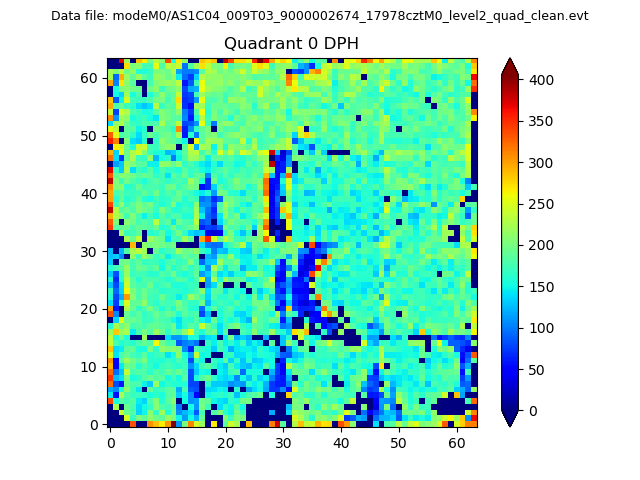 |
 |
Quadrant B |
|---|---|---|---|
| Quadrant D | 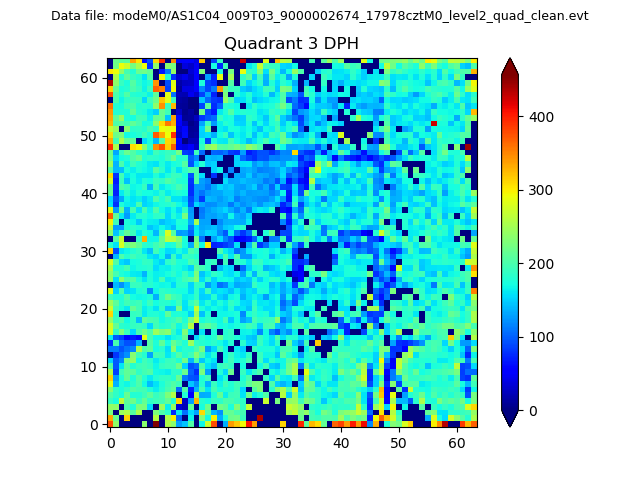 |
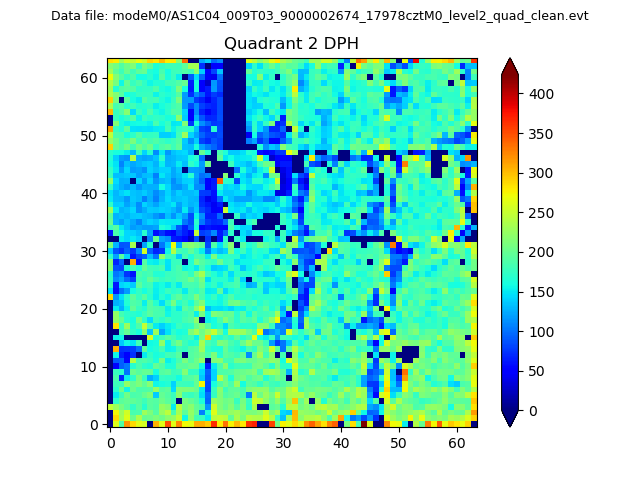 |
Quadrant C |
| Plot type | Count rate plots | Images |
|---|---|---|
| Comparison with Poisson distribution Blue bars denote a histogram of data divided into 1 sec bins. Red curve is a Poisson curve with rate = median count rate of data. |
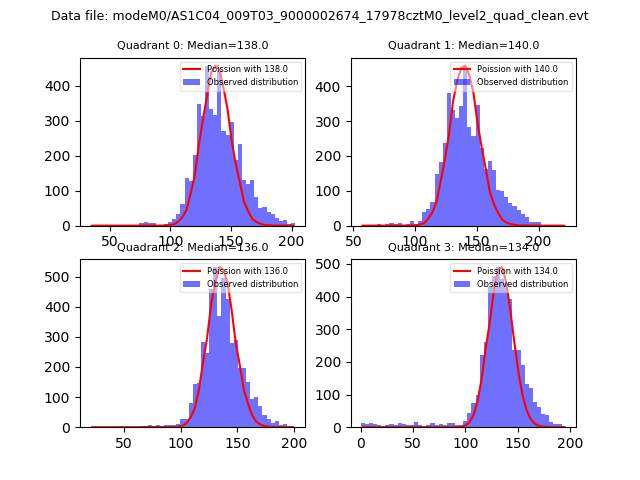 |
 |
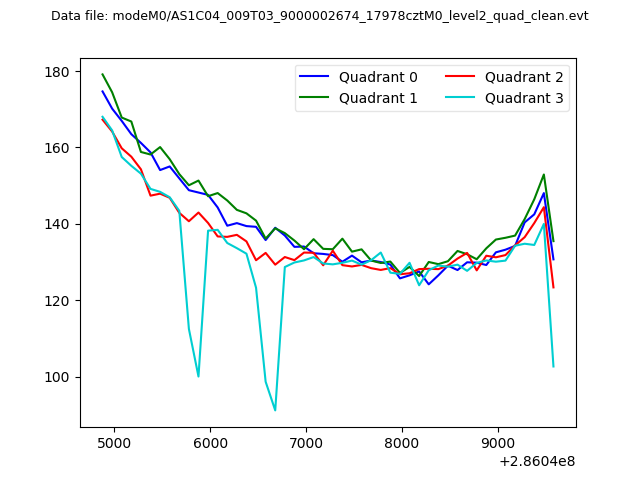
| Quadrant-wise count rates Data is divided into 100 sec bins |
 |
|
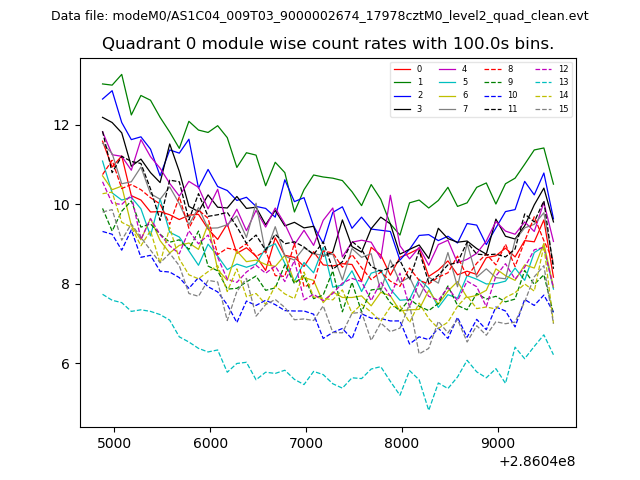
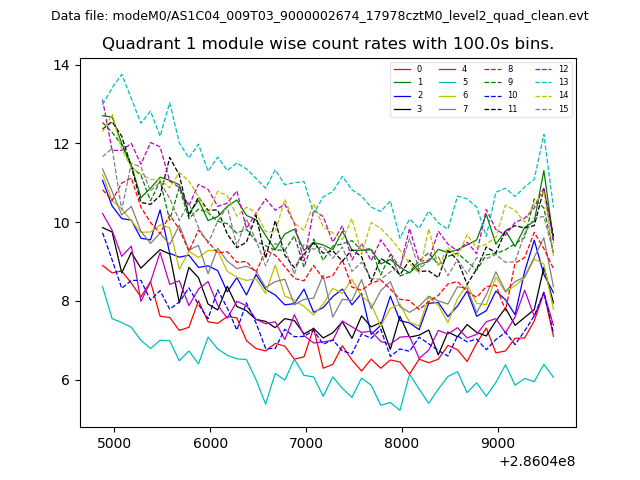
| Module-wise count rates for Quadrant A Data is divided into 100 sec bins |
 |
 |
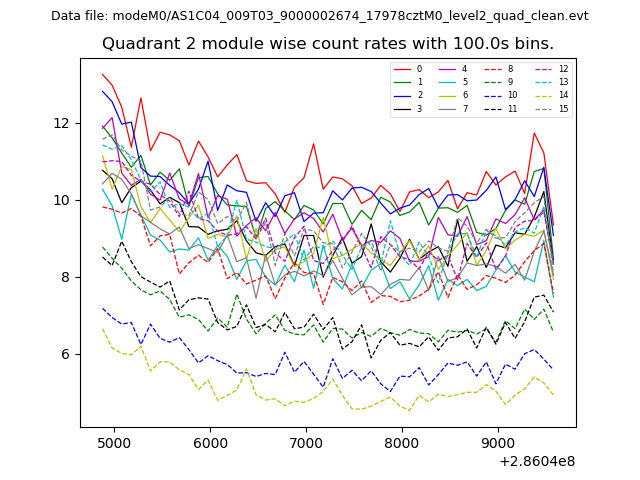
| Module-wise count rates for Quadrant B Data is divided into 100 sec bins |
 |
 |
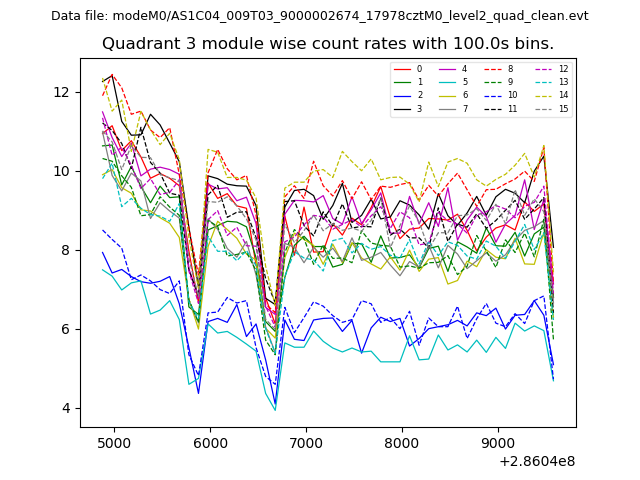
| Module-wise count rates for Quadrant C Data is divided into 100 sec bins |
 |
 |
| Module-wise count rates for Quadrant D Data is divided into 100 sec bins |
 |
 |
| Parameter | Plot |
|---|---|
| CZT HV Monitor | 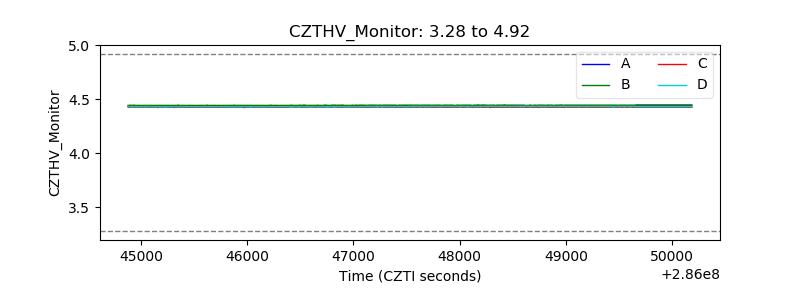 |
| D_VDD | 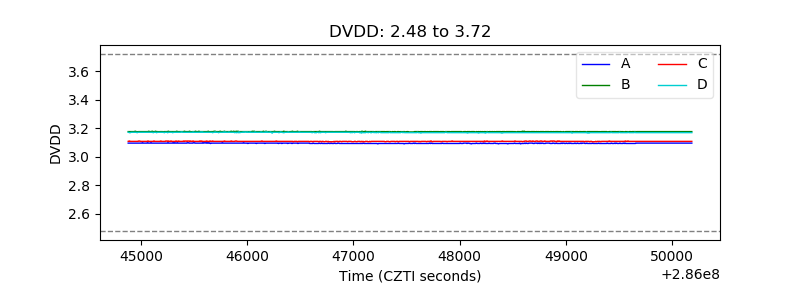 |
| Temperature 1 | 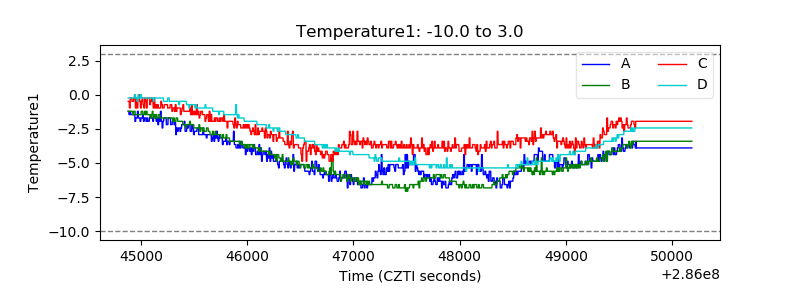 |
| Veto HV Monitor |  |
| Veto LLD | 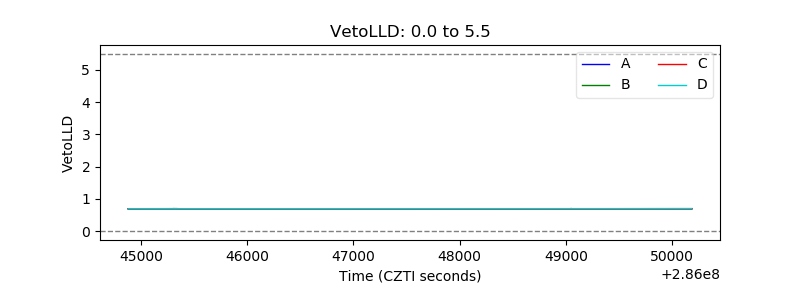 |
| Alpha Counter | 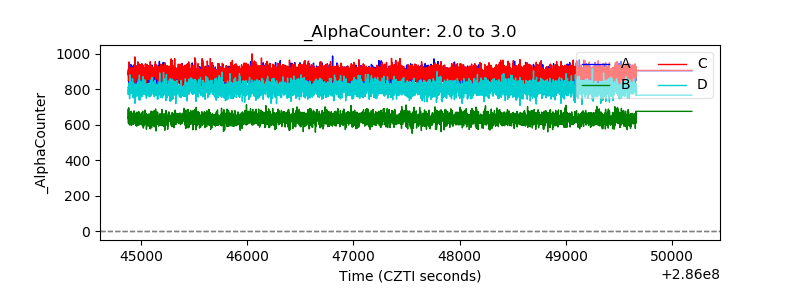 |
| _CPM_Rate | 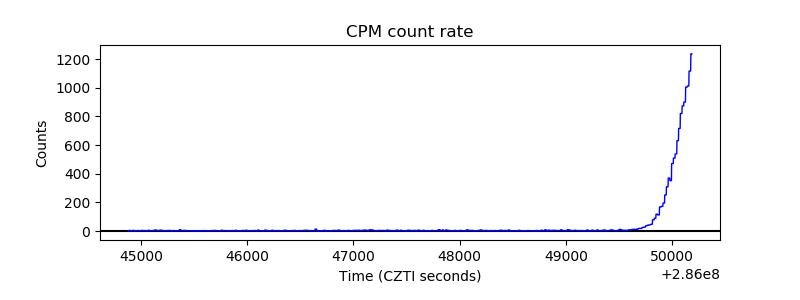 |
| CZT Counter | 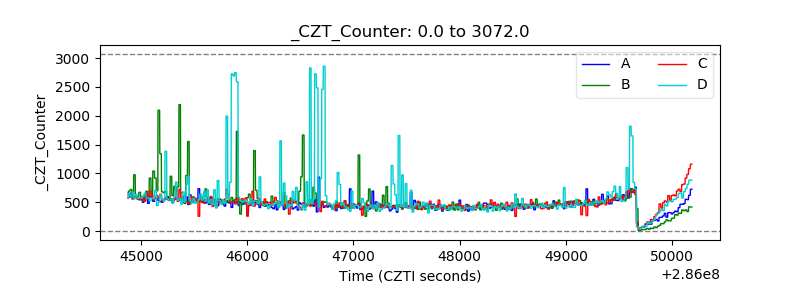 |
| +2.5 Volts monitor | 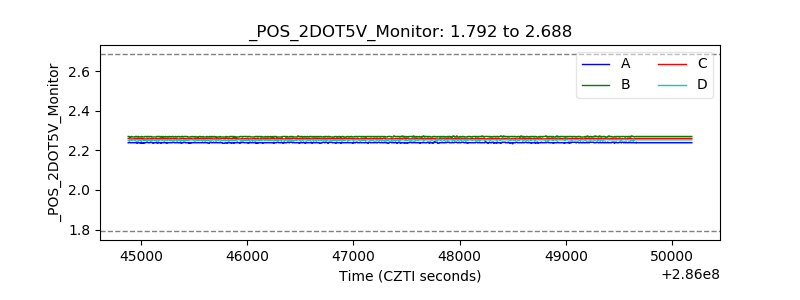 |
| +5 Volts monitor |  |
| _ROLL_ROT | 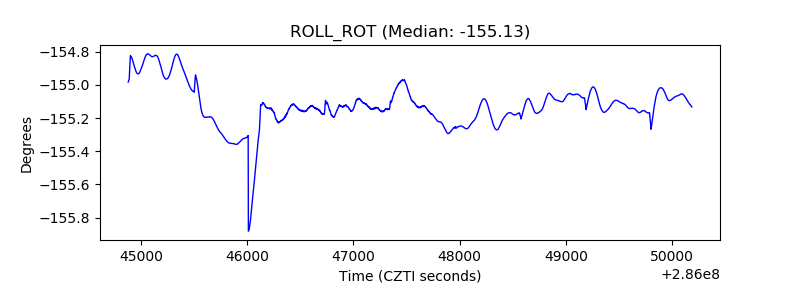 |
| _Roll_DEC | 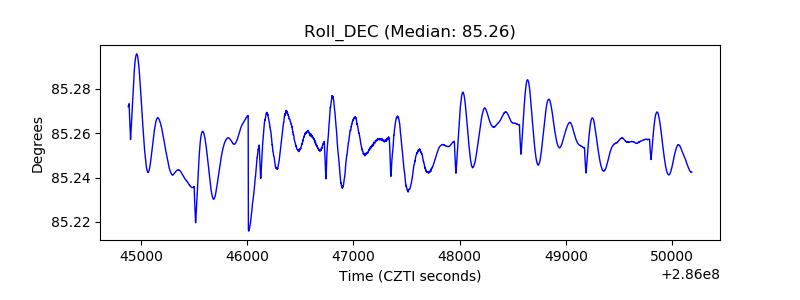 |
| _Roll_RA |  |
| Veto Counter | 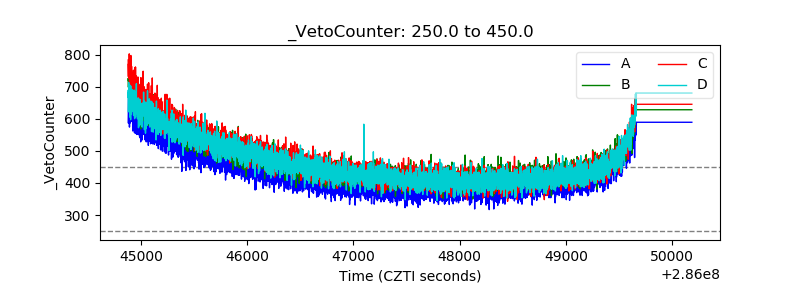 |