| Param | Original file | Final file |
|---|---|---|
| Filename | modeM0/AS1A05_159T01_9000002678_18008cztM0_level2.evt | modeM0/AS1A05_159T01_9000002678_18008cztM0_level2_quad_clean.evt |
| Size (bytes) | 493,476,480 | 104,783,040 |
| Size | 470.6 MB | 99.9 MB |
| Events in quadrant A | 3,475,828 | 695,941 |
| Events in quadrant B | 3,582,003 | 696,538 |
| Events in quadrant C | 3,523,317 | 661,068 |
| Events in quadrant D | 3,909,328 | 653,260 |
| Mode SS | |||
|---|---|---|---|
| Quadrant | BADHDUFLAG | Total packets | Discarded packets |
| A | 0 | 136 | 0 |
| B | 0 | 136 | 0 |
| C | 0 | 136 | 0 |
| D | 0 | 136 | 0 |
| Mode M9 | |||
|---|---|---|---|
| Quadrant | BADHDUFLAG | Total packets | Discarded packets |
| A | 0 | 10 | 0 |
| B | 0 | 11 | 0 |
| C | 0 | 11 | 0 |
| D | 0 | 11 | 0 |
| Mode M0 | |||
|---|---|---|---|
| Quadrant | BADHDUFLAG | Total packets | Discarded packets |
| A | 0 | 14470 | 2 |
| B | 0 | 14740 | 2 |
| C | 0 | 14543 | 2 |
| D | 0 | 15895 | 3 |
| Quadrant | Total seconds | Saturated seconds | Saturation percentage |
|---|---|---|---|
| A | 6693 | 104 | 1.553862% |
| B | 6693 | 133 | 1.987151% |
| C | 6693 | 145 | 2.166443% |
| D | 6692 | 120 | 1.793186% |
Noise dominated data is calculated using 1-second bins in cleaned event files. If a bin has >2000 counts, and if more than 50% of those come from <1% of pixels, then it is considered to be noise-dominated and hence unusable.
| Quadrant | # 1 sec bins | Bins with >0 counts | Bins with >2000 counts | High rate bins dominated by noise | Noise dominated (total time) | Noise dominated (detector-on time) | Marked lightcurve |
|---|---|---|---|---|---|---|---|
| A | 7738 | 6694 | 7 | 7 | 0.09% | 0.10% | 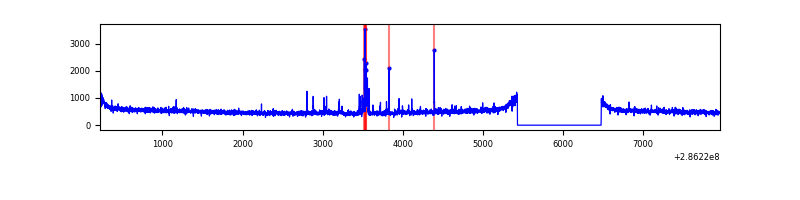 |
| B | 7738 | 6694 | 15 | 15 | 0.19% | 0.22% | 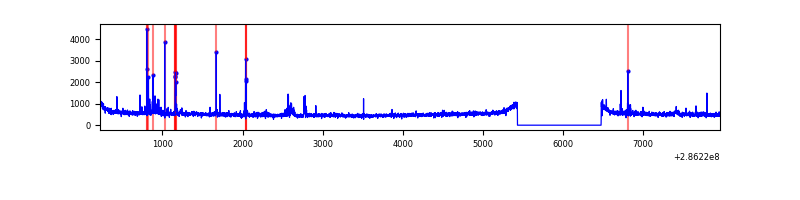 |
| C | 7738 | 6694 | 2 | 2 | 0.03% | 0.03% | 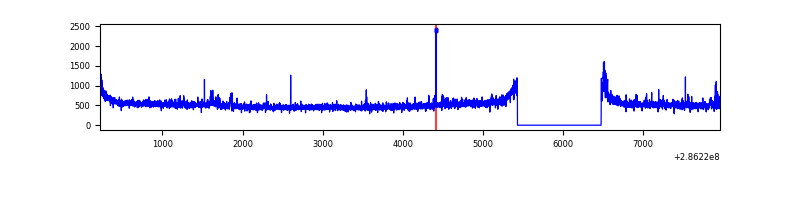 |
| D | 7737 | 6693 | 38 | 38 | 0.49% | 0.57% | 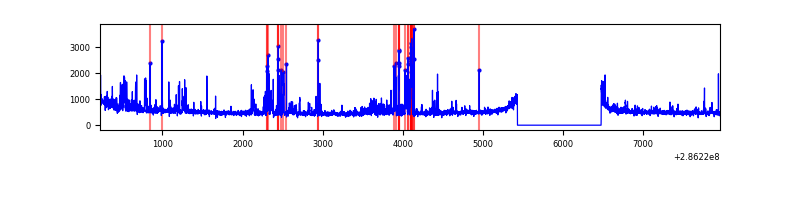 |
Top three noisy pixels from each quadrant. If the there are fewer than three noisy pixels in the level2.evt file, extra rows are filled as -1
| Pixel properties | Quadrant properties | ||||||
|---|---|---|---|---|---|---|---|
| Quadrant | DetID | PixID | Counts | Sigma | Mean | Median | Sigma |
| A | 4 | 2 | 87579 | 487.41 | 876 | 860 | 177.9 |
| A | 15 | 174 | 19748 | 106.16 | 876 | 860 | 177.9 |
| A | 0 | 226 | 7623 | 38.01 | 876 | 860 | 177.9 |
| B | 5 | 172 | 58292 | 344.79 | 869 | 851 | 166.6 |
| B | 7 | 220 | 43149 | 253.9 | 869 | 851 | 166.6 |
| B | 0 | 197 | 18740 | 107.38 | 869 | 851 | 166.6 |
| C | 14 | 238 | 130230 | 665.44 | 830 | 840 | 194.4 |
| C | 0 | 207 | 113076 | 577.22 | 830 | 840 | 194.4 |
| C | 3 | 233 | 23814 | 118.15 | 830 | 840 | 194.4 |
| D | 5 | 222 | 410145 | 1838.66 | 846 | 830 | 222.6 |
| D | 11 | 176 | 120479 | 537.47 | 846 | 830 | 222.6 |
| D | 7 | 38 | 92400 | 411.34 | 846 | 830 | 222.6 |
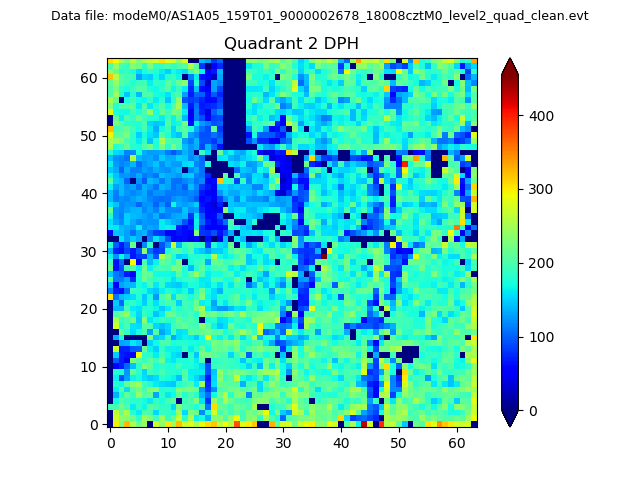
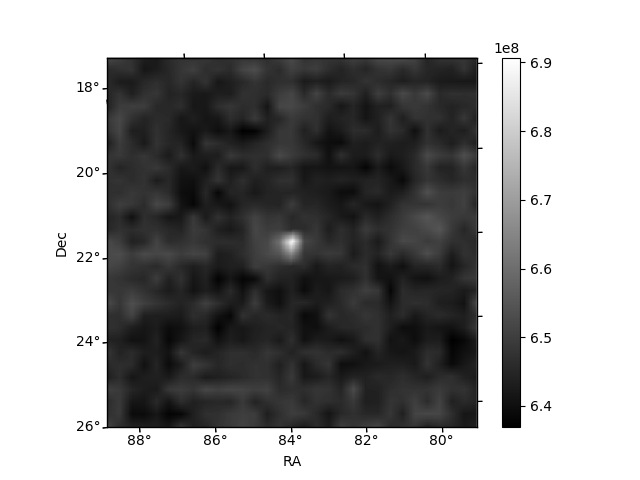
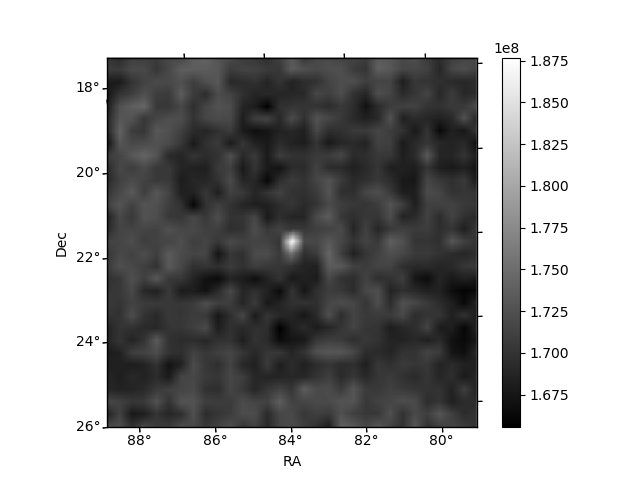
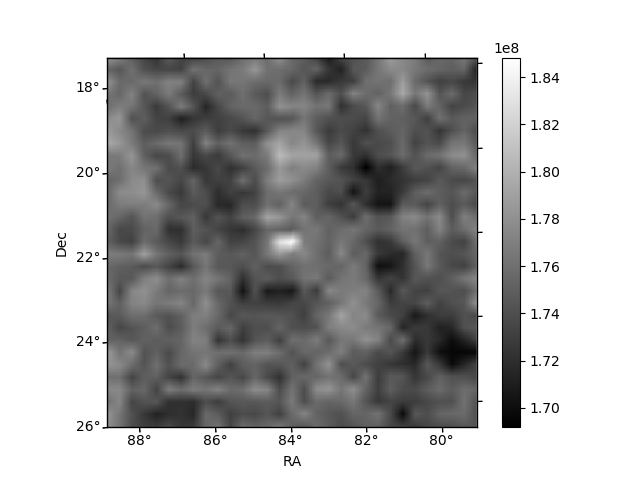
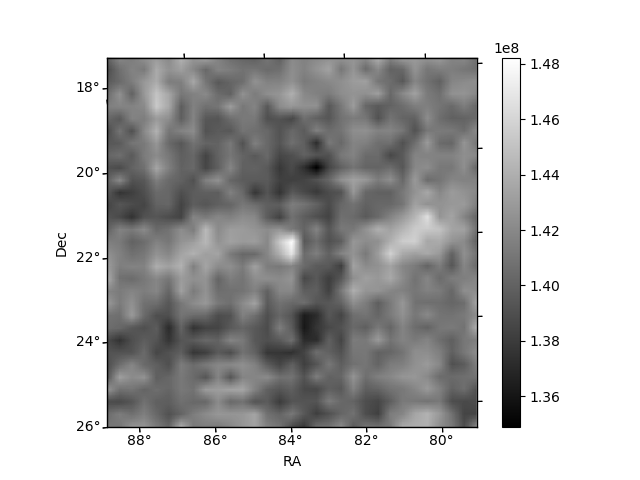
Histogram calculated using DETX and DETY for each event in the final _common_clean file
| Quadrant A | 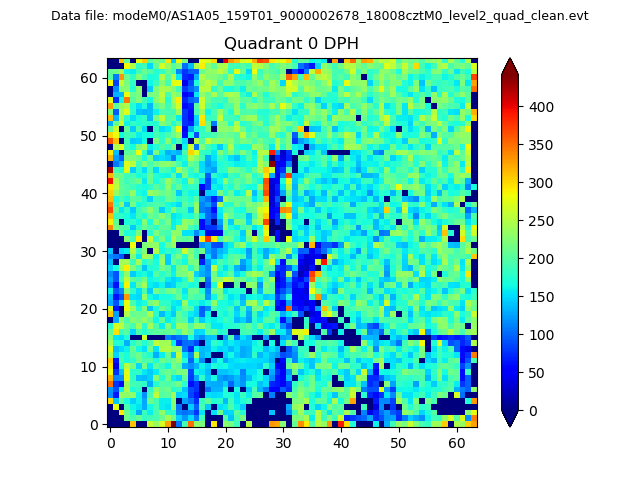 |
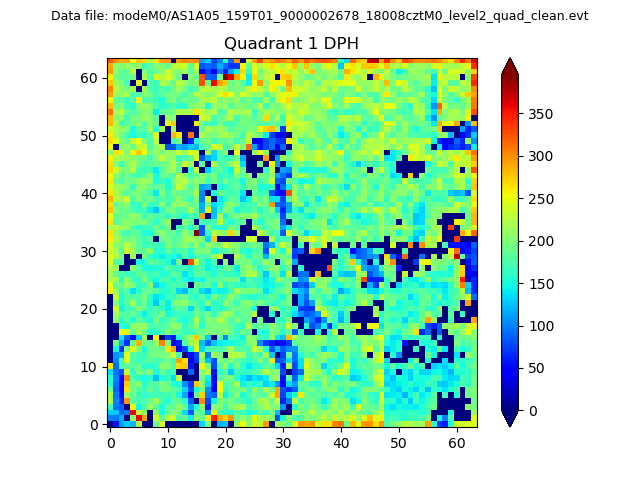 |
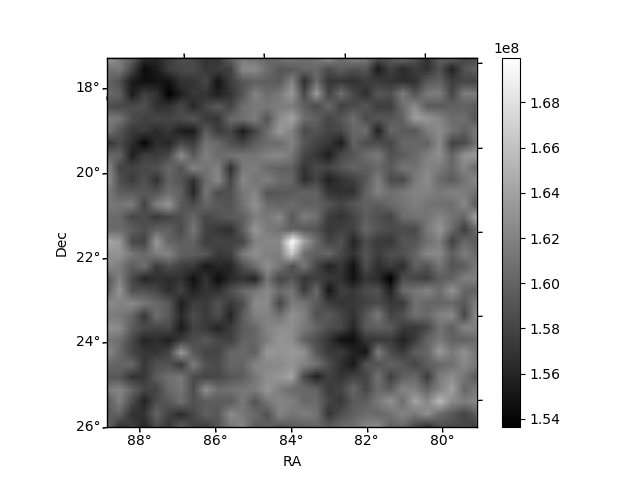
Quadrant B |
|---|---|---|---|
| Quadrant D | 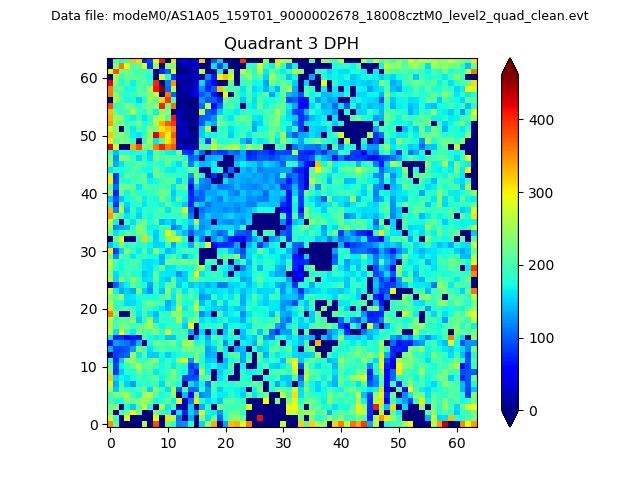 |
 |
Quadrant C |
| Plot type | Count rate plots | Images |
|---|---|---|
| Comparison with Poisson distribution Blue bars denote a histogram of data divided into 1 sec bins. Red curve is a Poisson curve with rate = median count rate of data. |
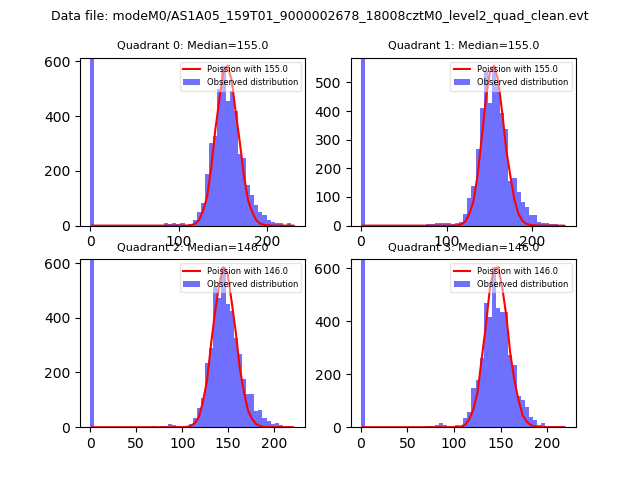 |
 |
| Quadrant-wise count rates Data is divided into 100 sec bins |
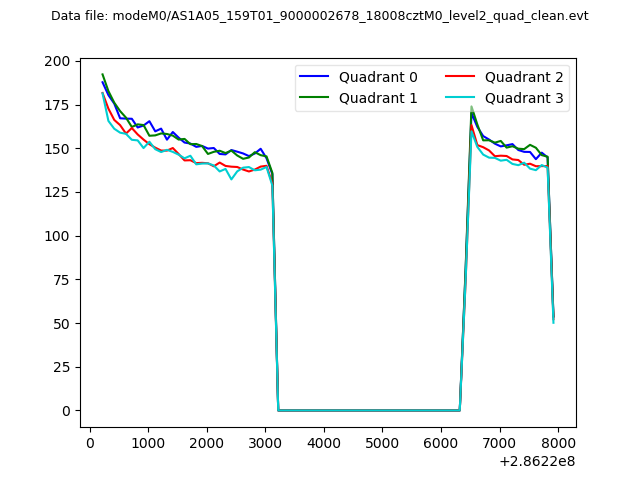 |
|
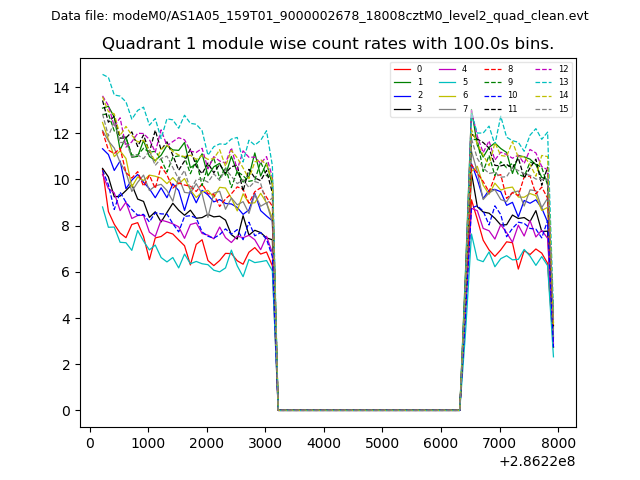
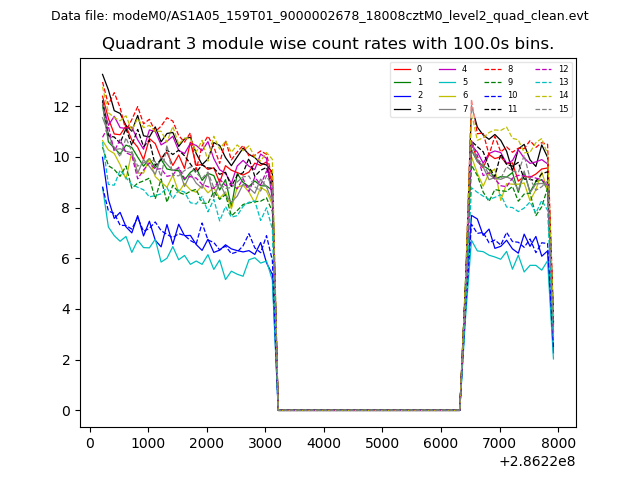
| Module-wise count rates for Quadrant A Data is divided into 100 sec bins |
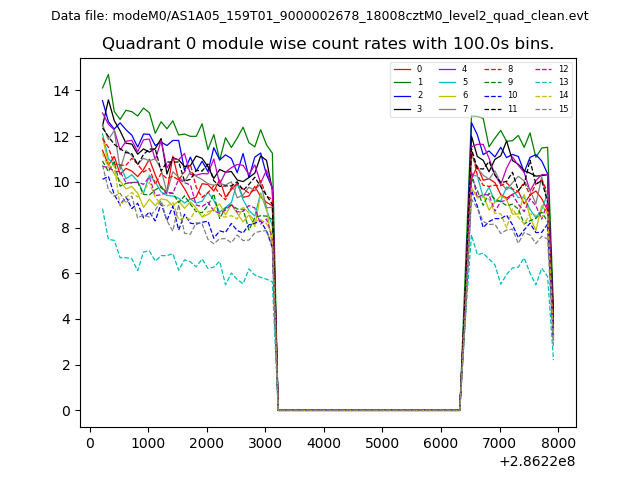 |
 |
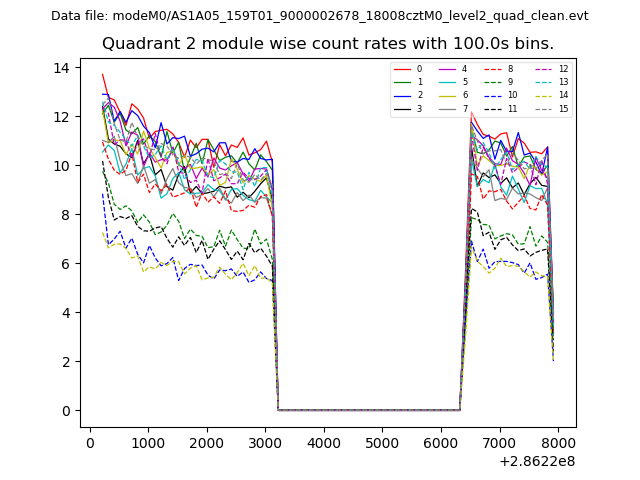
| Module-wise count rates for Quadrant B Data is divided into 100 sec bins |
 |
 |
| Module-wise count rates for Quadrant C Data is divided into 100 sec bins |
 |
 |
| Module-wise count rates for Quadrant D Data is divided into 100 sec bins |
 |
 |
| Parameter | Plot |
|---|---|
| CZT HV Monitor | 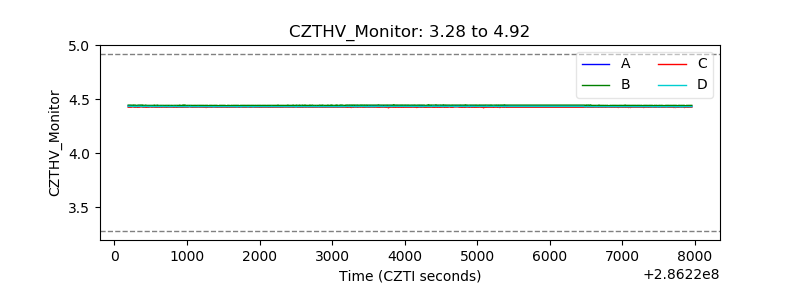 |
| D_VDD | 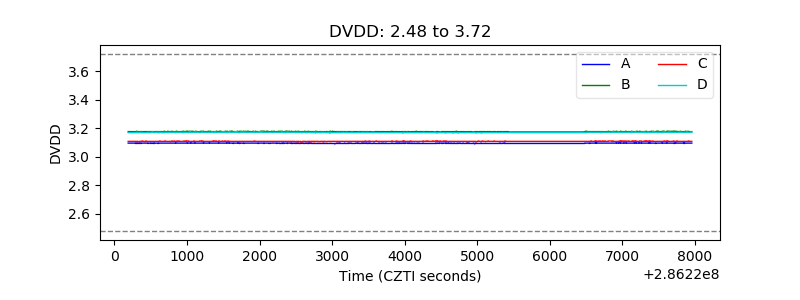 |
| Temperature 1 |  |
| Veto HV Monitor | 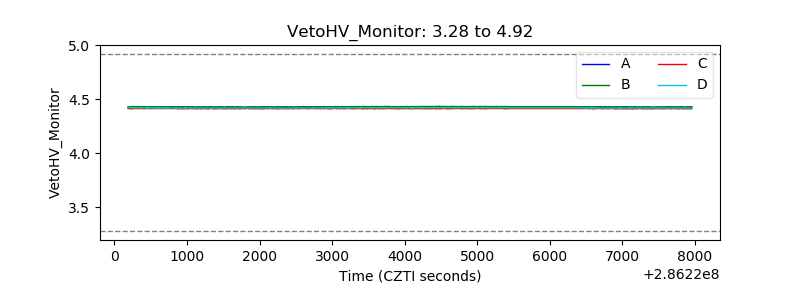 |
| Veto LLD | 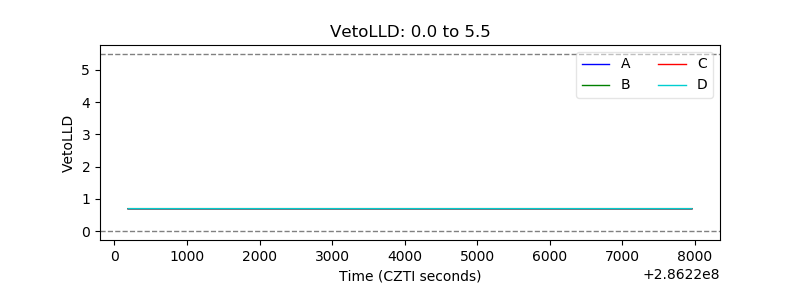 |
| Alpha Counter | 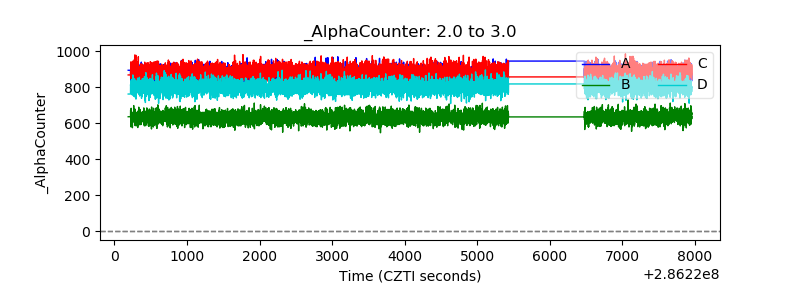 |
| _CPM_Rate | 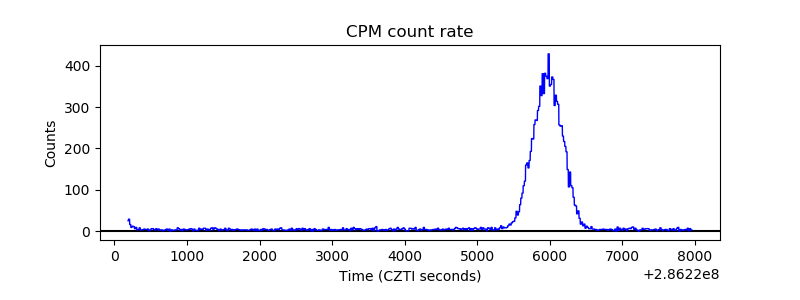 |
| CZT Counter | 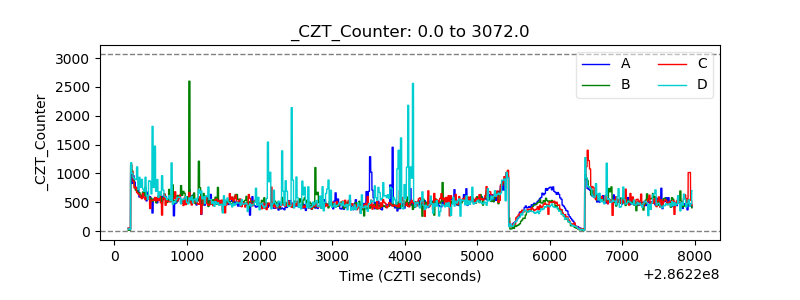 |
| +2.5 Volts monitor | 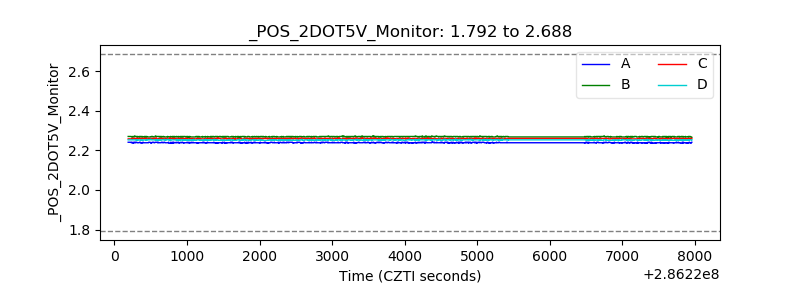 |
| +5 Volts monitor |  |
| _ROLL_ROT | 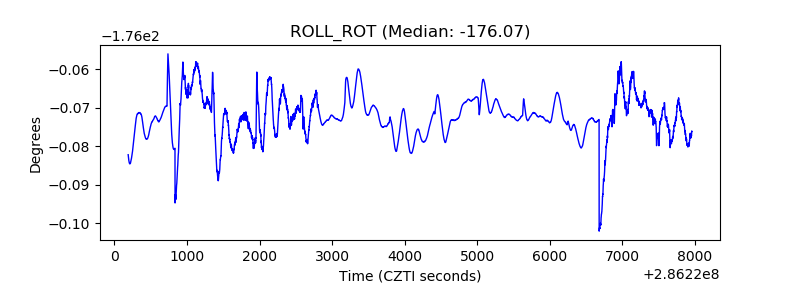 |
| _Roll_DEC | 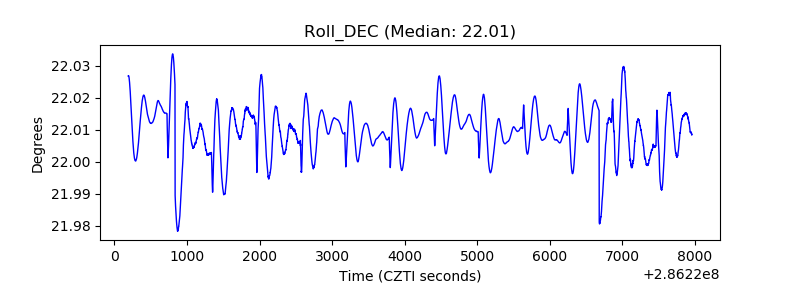 |
| _Roll_RA | 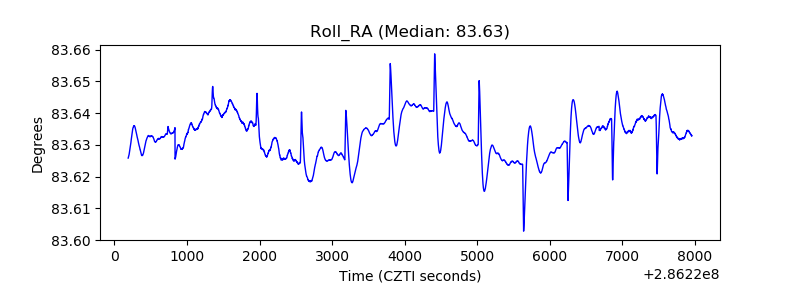 |
| Veto Counter | 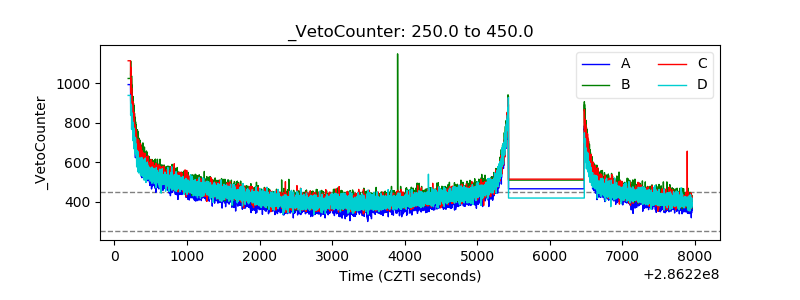 |