| Param | Original file | Final file |
|---|---|---|
| Filename | modeM0/AS1A05_159T01_9000002678_18014cztM0_level2.evt | modeM0/AS1A05_159T01_9000002678_18014cztM0_level2_quad_clean.evt |
| Size (bytes) | 991,080,000 | 162,936,000 |
| Size | 945.2 MB | 155.4 MB |
| Events in quadrant A | 6,883,572 | 1,033,681 |
| Events in quadrant B | 6,593,425 | 1,039,678 |
| Events in quadrant C | 7,195,411 | 998,927 |
| Events in quadrant D | 8,458,965 | 958,838 |
| Mode SS | |||
|---|---|---|---|
| Quadrant | BADHDUFLAG | Total packets | Discarded packets |
| A | 0 | 266 | 0 |
| B | 0 | 266 | 0 |
| C | 0 | 266 | 0 |
| D | 0 | 266 | 0 |
| Mode M9 | |||
|---|---|---|---|
| Quadrant | BADHDUFLAG | Total packets | Discarded packets |
| A | 0 | 19 | 0 |
| B | 0 | 19 | 0 |
| C | 0 | 19 | 0 |
| D | 0 | 19 | 0 |
| Mode M0 | |||
|---|---|---|---|
| Quadrant | BADHDUFLAG | Total packets | Discarded packets |
| A | 0 | 28619 | 3 |
| B | 0 | 27696 | 4 |
| C | 0 | 29477 | 3 |
| D | 0 | 33945 | 3 |
| Quadrant | Total seconds | Saturated seconds | Saturation percentage |
|---|---|---|---|
| A | 13078 | 200 | 1.529286% |
| B | 13077 | 170 | 1.299992% |
| C | 13077 | 187 | 1.429992% |
| D | 13078 | 432 | 3.303257% |
Noise dominated data is calculated using 1-second bins in cleaned event files. If a bin has >2000 counts, and if more than 50% of those come from <1% of pixels, then it is considered to be noise-dominated and hence unusable.
| Quadrant | # 1 sec bins | Bins with >0 counts | Bins with >2000 counts | High rate bins dominated by noise | Noise dominated (total time) | Noise dominated (detector-on time) | Marked lightcurve |
|---|---|---|---|---|---|---|---|
| A | 14953 | 13080 | 81 | 81 | 0.54% | 0.62% | 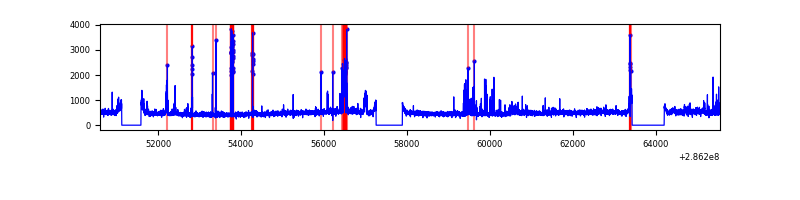 |
| B | 14952 | 13079 | 34 | 34 | 0.23% | 0.26% | 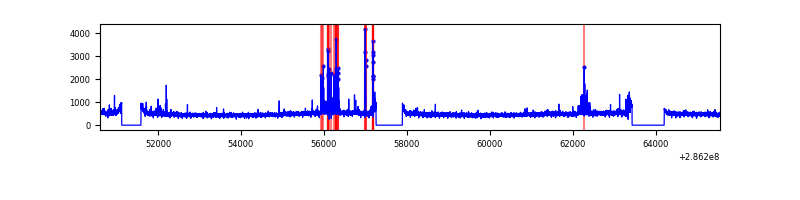 |
| C | 14952 | 13079 | 5 | 5 | 0.03% | 0.04% | 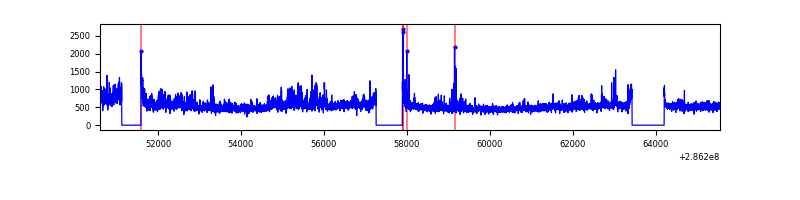 |
| D | 14953 | 13081 | 252 | 252 | 1.69% | 1.93% | 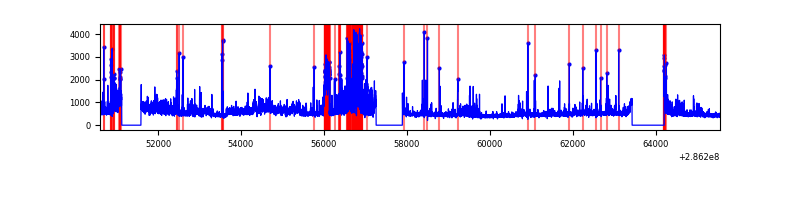 |
Top three noisy pixels from each quadrant. If the there are fewer than three noisy pixels in the level2.evt file, extra rows are filled as -1
| Pixel properties | Quadrant properties | ||||||
|---|---|---|---|---|---|---|---|
| Quadrant | DetID | PixID | Counts | Sigma | Mean | Median | Sigma |
| A | 15 | 174 | 446342 | 1363.89 | 1601 | 1569 | 326.1 |
| A | 6 | 16 | 234536 | 714.39 | 1601 | 1569 | 326.1 |
| A | 15 | 192 | 45156 | 133.66 | 1601 | 1569 | 326.1 |
| B | 7 | 220 | 233969 | 750.38 | 1606 | 1566 | 309.7 |
| B | 12 | 111 | 36612 | 113.16 | 1606 | 1566 | 309.7 |
| B | 11 | 111 | 31195 | 95.67 | 1606 | 1566 | 309.7 |
| C | 0 | 207 | 547770 | 1509.07 | 1542 | 1558 | 362.0 |
| C | 3 | 233 | 377414 | 1038.41 | 1542 | 1558 | 362.0 |
| C | 14 | 238 | 236374 | 648.75 | 1542 | 1558 | 362.0 |
| D | 5 | 222 | 1808239 | 4778.36 | 1546 | 1509 | 378.1 |
| D | 7 | 238 | 274296 | 721.46 | 1546 | 1509 | 378.1 |
| D | 1 | 255 | 209067 | 548.94 | 1546 | 1509 | 378.1 |
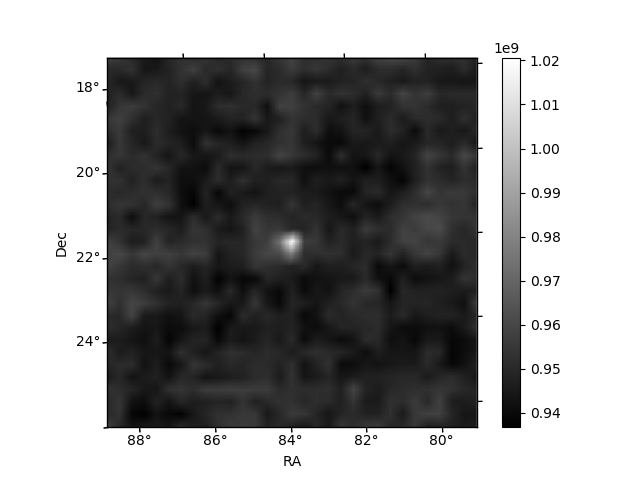
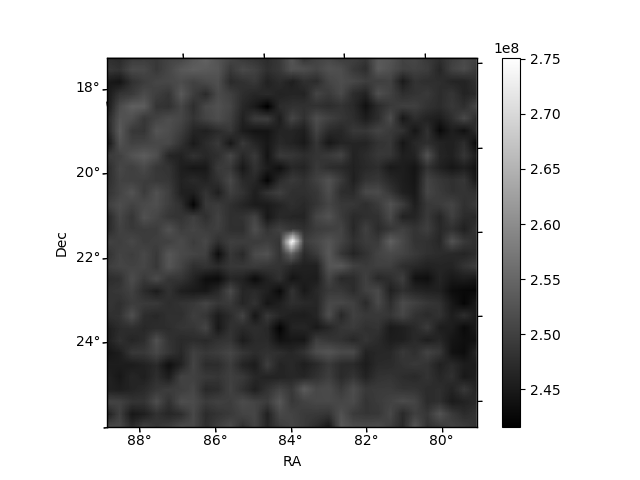
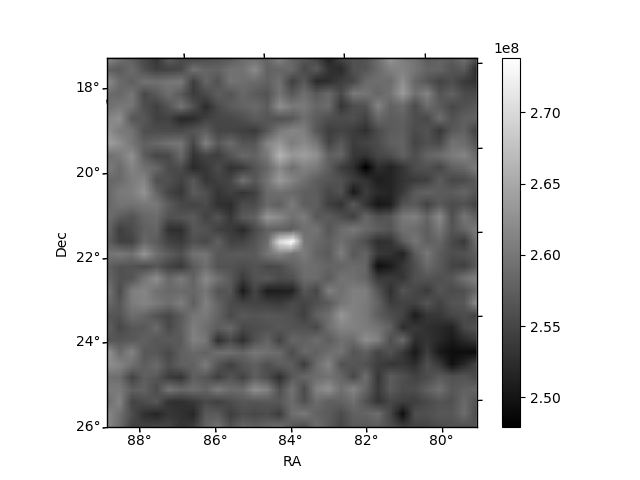
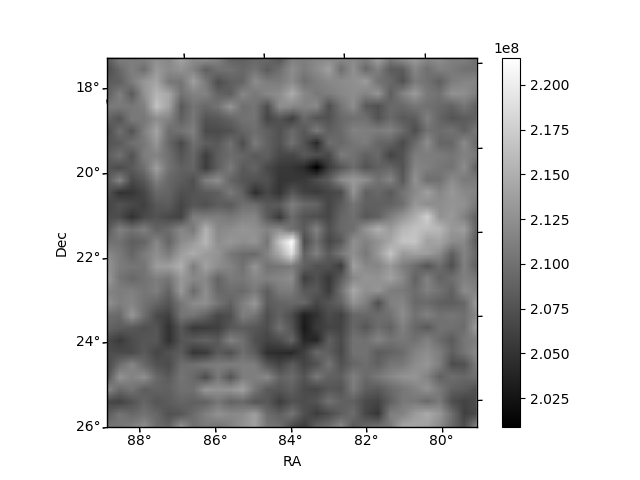
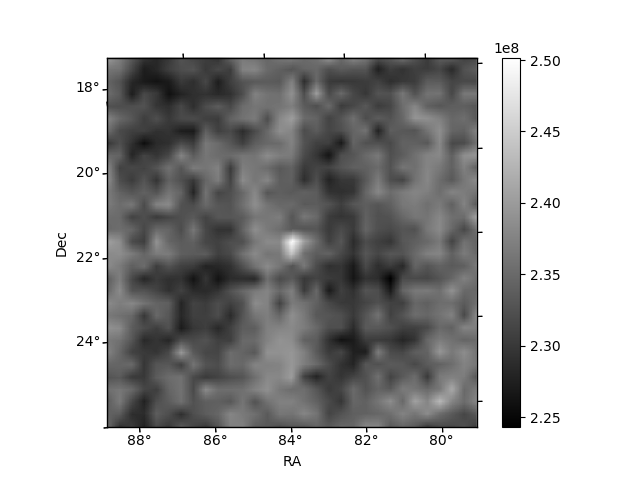
Histogram calculated using DETX and DETY for each event in the final _common_clean file
| Quadrant A | 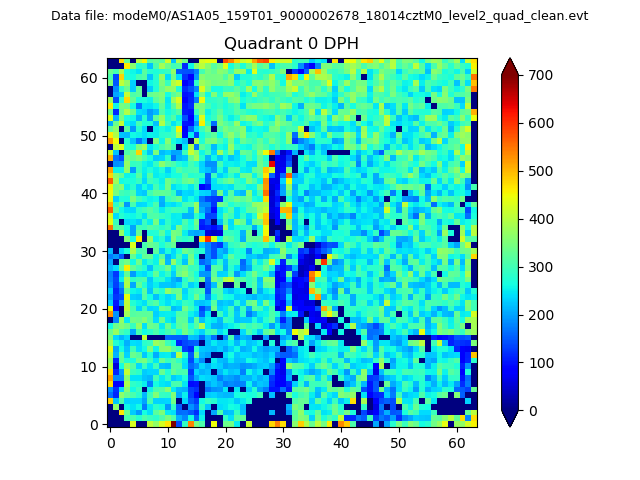 |
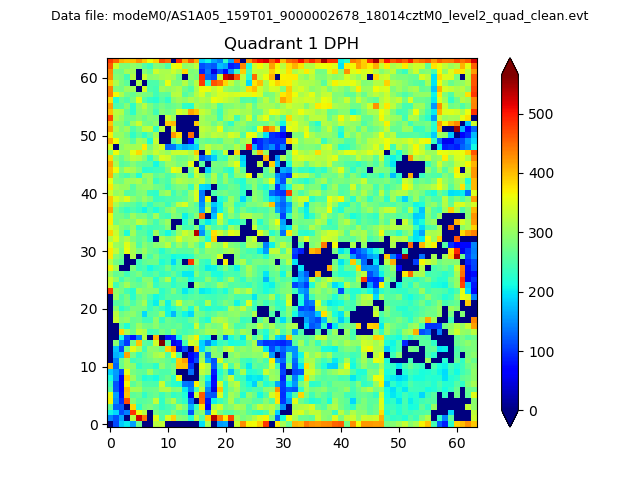 |
Quadrant B |
|---|---|---|---|
| Quadrant D |  |
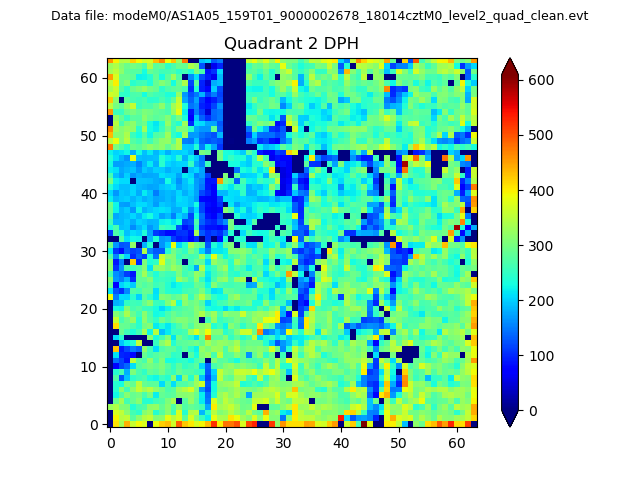 |
Quadrant C |
| Plot type | Count rate plots | Images |
|---|---|---|
| Comparison with Poisson distribution Blue bars denote a histogram of data divided into 1 sec bins. Red curve is a Poisson curve with rate = median count rate of data. |
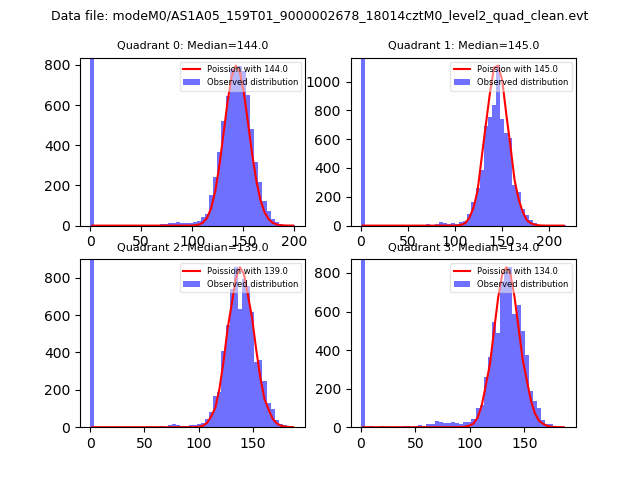 |
 |
| Quadrant-wise count rates Data is divided into 100 sec bins |
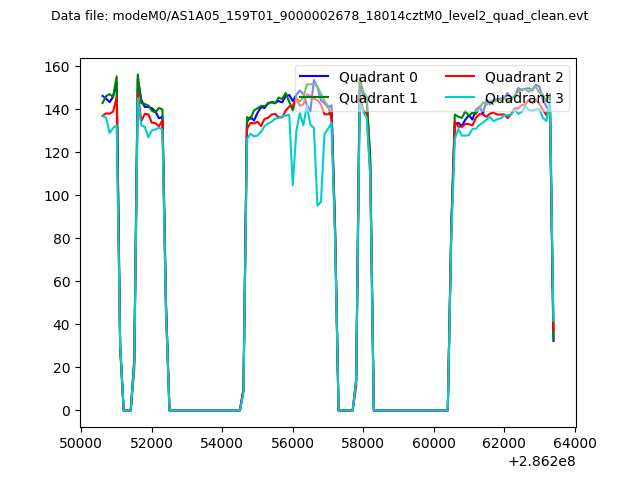 |
|
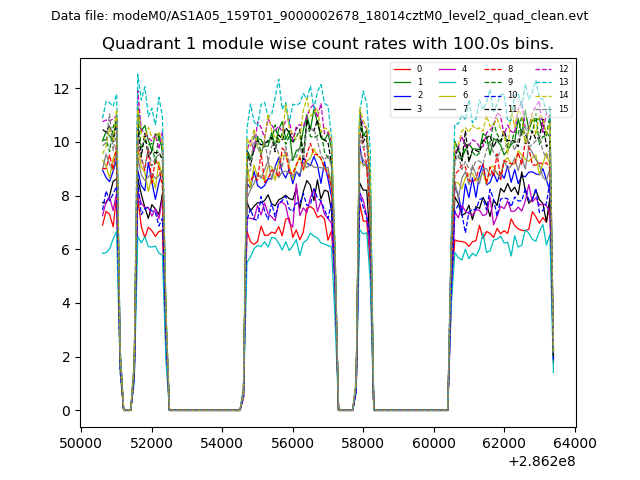
| Module-wise count rates for Quadrant A Data is divided into 100 sec bins |
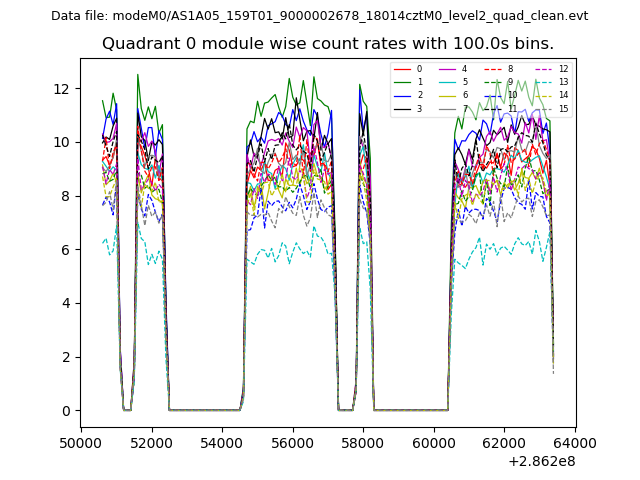 |
 |
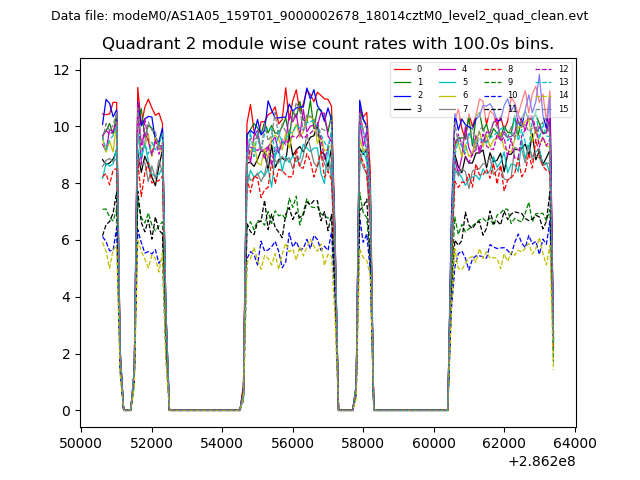
| Module-wise count rates for Quadrant B Data is divided into 100 sec bins |
 |
 |
| Module-wise count rates for Quadrant C Data is divided into 100 sec bins |
 |
 |
| Module-wise count rates for Quadrant D Data is divided into 100 sec bins |
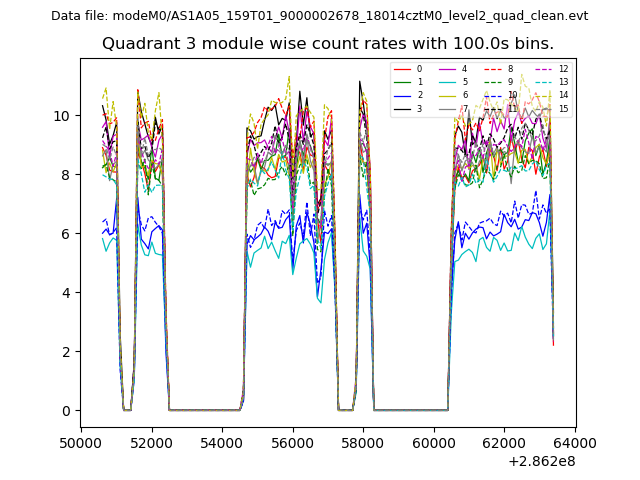 |
 |
| Parameter | Plot |
|---|---|
| CZT HV Monitor | 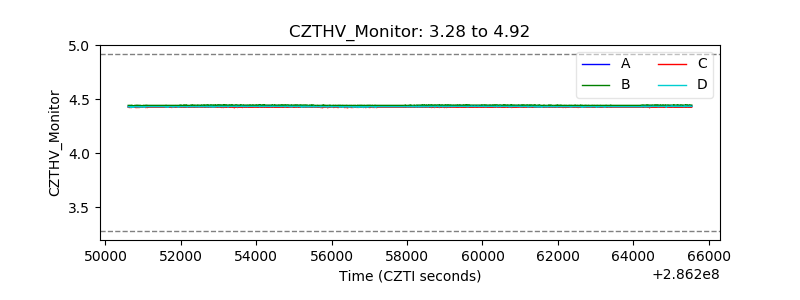 |
| D_VDD |  |
| Temperature 1 | 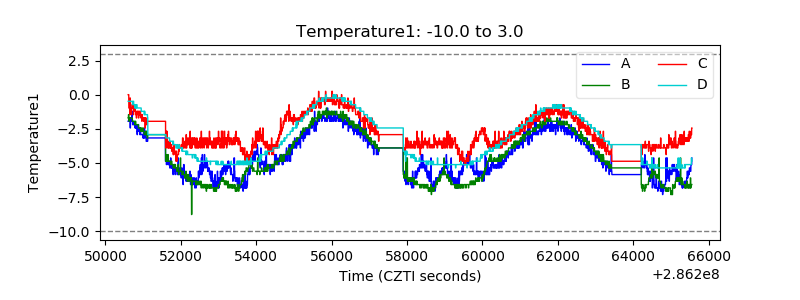 |
| Veto HV Monitor | 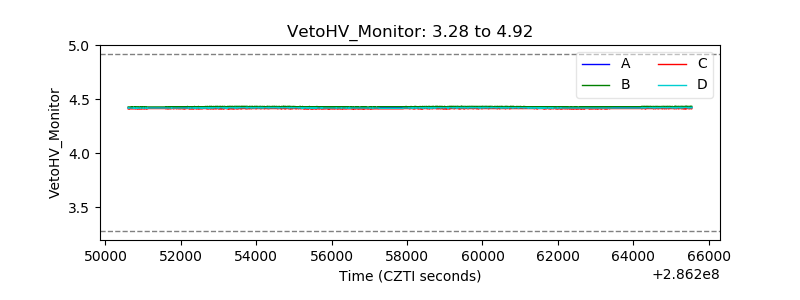 |
| Veto LLD | 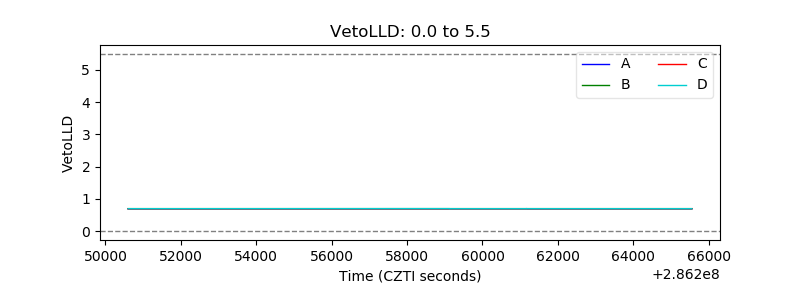 |
| Alpha Counter |  |
| _CPM_Rate |  |
| CZT Counter | 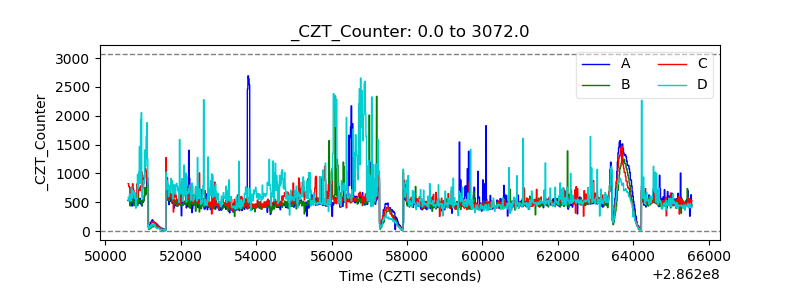 |
| +2.5 Volts monitor |  |
| +5 Volts monitor |  |
| _ROLL_ROT | 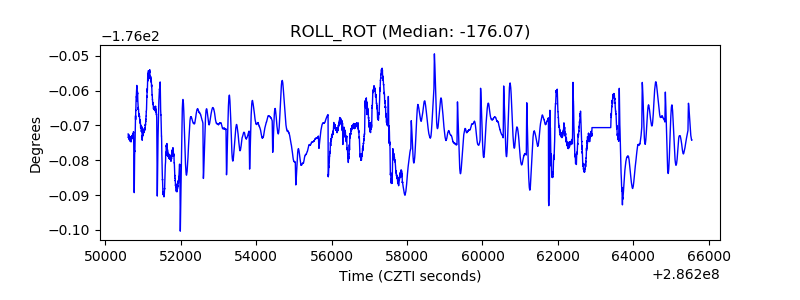 |
| _Roll_DEC | 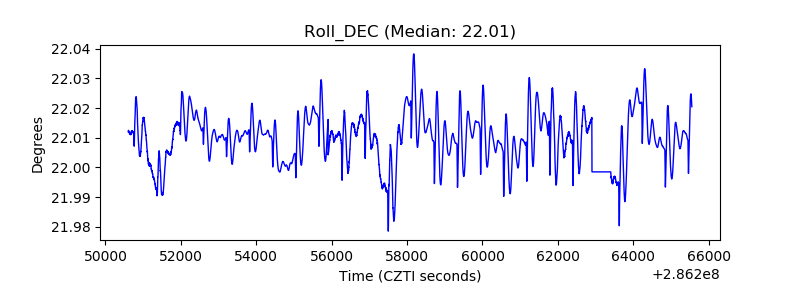 |
| _Roll_RA | 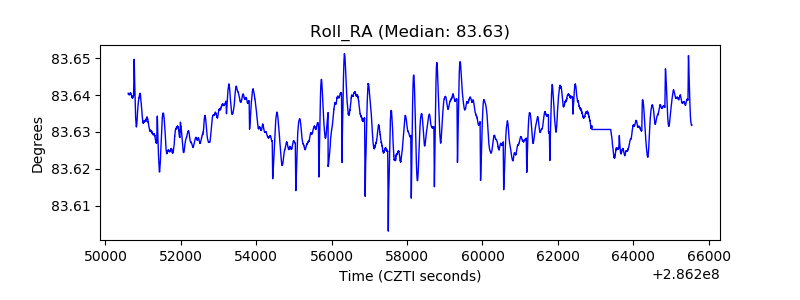 |
| Veto Counter | 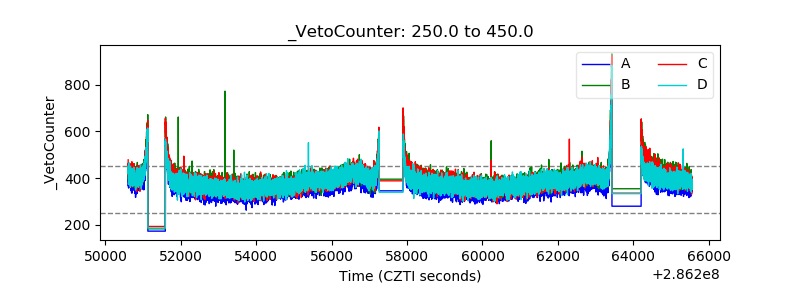 |