| Param | Original file | Final file |
|---|---|---|
| Filename | modeM0/AS1A05_159T01_9000002678_18015cztM0_level2.evt | modeM0/AS1A05_159T01_9000002678_18015cztM0_level2_quad_clean.evt |
| Size (bytes) | 481,144,320 | 73,805,760 |
| Size | 458.9 MB | 70.4 MB |
| Events in quadrant A | 3,536,881 | 448,065 |
| Events in quadrant B | 3,350,212 | 454,167 |
| Events in quadrant C | 3,436,878 | 437,272 |
| Events in quadrant D | 3,792,197 | 427,727 |
| Mode SS | |||
|---|---|---|---|
| Quadrant | BADHDUFLAG | Total packets | Discarded packets |
| A | 0 | 136 | 0 |
| B | 0 | 136 | 0 |
| C | 0 | 136 | 0 |
| D | 0 | 136 | 0 |
| Mode M9 | |||
|---|---|---|---|
| Quadrant | BADHDUFLAG | Total packets | Discarded packets |
| A | 0 | 14 | 0 |
| B | 0 | 15 | 0 |
| C | 0 | 15 | 0 |
| D | 0 | 15 | 0 |
| Mode M0 | |||
|---|---|---|---|
| Quadrant | BADHDUFLAG | Total packets | Discarded packets |
| A | 0 | 14526 | 2 |
| B | 0 | 13932 | 2 |
| C | 0 | 13997 | 2 |
| D | 0 | 15701 | 2 |
| Quadrant | Total seconds | Saturated seconds | Saturation percentage |
|---|---|---|---|
| A | 6707 | 120 | 1.789175% |
| B | 6707 | 64 | 0.954227% |
| C | 6707 | 75 | 1.118235% |
| D | 6707 | 68 | 1.013866% |
Noise dominated data is calculated using 1-second bins in cleaned event files. If a bin has >2000 counts, and if more than 50% of those come from <1% of pixels, then it is considered to be noise-dominated and hence unusable.
| Quadrant | # 1 sec bins | Bins with >0 counts | Bins with >2000 counts | High rate bins dominated by noise | Noise dominated (total time) | Noise dominated (detector-on time) | Marked lightcurve |
|---|---|---|---|---|---|---|---|
| A | 7632 | 6708 | 60 | 60 | 0.79% | 0.89% | 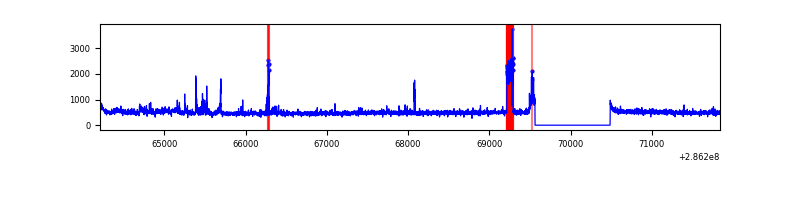 |
| B | 7632 | 6707 | 10 | 10 | 0.13% | 0.15% | 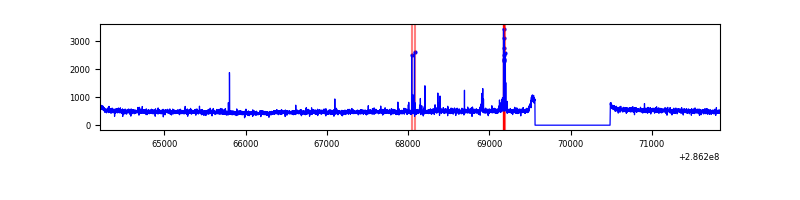 |
| C | 7632 | 6708 | 0 | 0 | 0.00% | 0.00% | 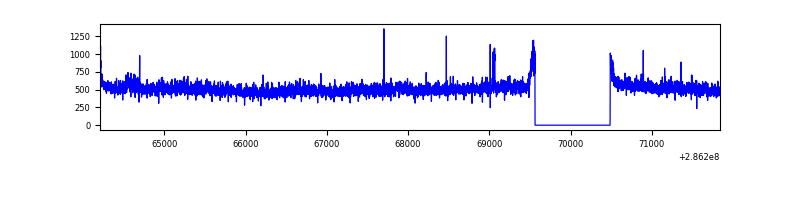 |
| D | 7632 | 6708 | 36 | 36 | 0.47% | 0.54% | 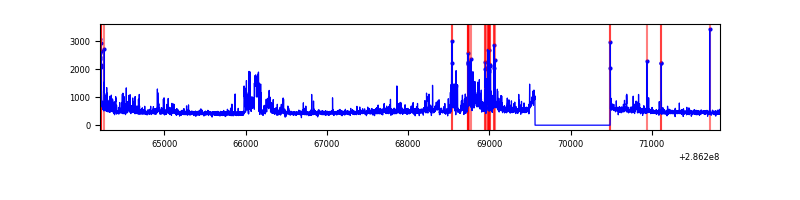 |
Top three noisy pixels from each quadrant. If the there are fewer than three noisy pixels in the level2.evt file, extra rows are filled as -1
| Pixel properties | Quadrant properties | ||||||
|---|---|---|---|---|---|---|---|
| Quadrant | DetID | PixID | Counts | Sigma | Mean | Median | Sigma |
| A | 15 | 174 | 329501 | 1946.66 | 831 | 814 | 168.8 |
| A | 4 | 2 | 9189 | 49.6 | 831 | 814 | 168.8 |
| A | 0 | 226 | 7007 | 36.68 | 831 | 814 | 168.8 |
| B | 4 | 48 | 38636 | 233.93 | 836 | 813 | 161.7 |
| B | 12 | 111 | 18940 | 112.11 | 836 | 813 | 161.7 |
| B | 0 | 190 | 16809 | 98.93 | 836 | 813 | 161.7 |
| C | 3 | 233 | 150355 | 794.85 | 799 | 806 | 188.1 |
| C | 14 | 238 | 123405 | 651.61 | 799 | 806 | 188.1 |
| C | 0 | 207 | 12055 | 59.79 | 799 | 806 | 188.1 |
| D | 7 | 238 | 499198 | 2502.76 | 806 | 784 | 199.1 |
| D | 9 | 68 | 187815 | 939.16 | 806 | 784 | 199.1 |
| D | 2 | 234 | 27462 | 133.96 | 806 | 784 | 199.1 |
Histogram calculated using DETX and DETY for each event in the final _common_clean file
| Quadrant A | 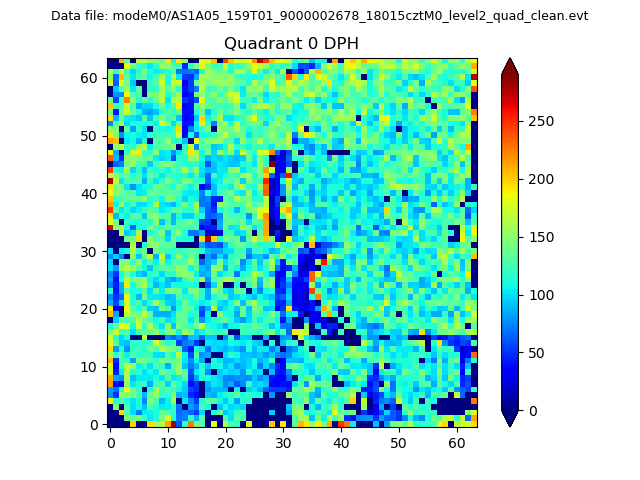 |
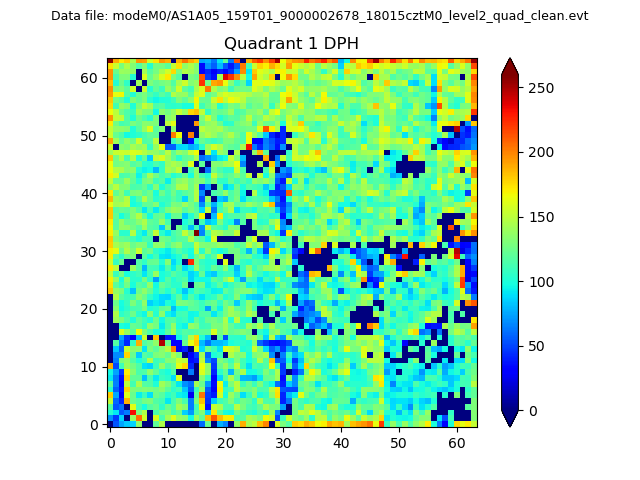 |
Quadrant B |
|---|---|---|---|
| Quadrant D |  |
 |
Quadrant C |
| Plot type | Count rate plots | Images |
|---|---|---|
| Comparison with Poisson distribution Blue bars denote a histogram of data divided into 1 sec bins. Red curve is a Poisson curve with rate = median count rate of data. |
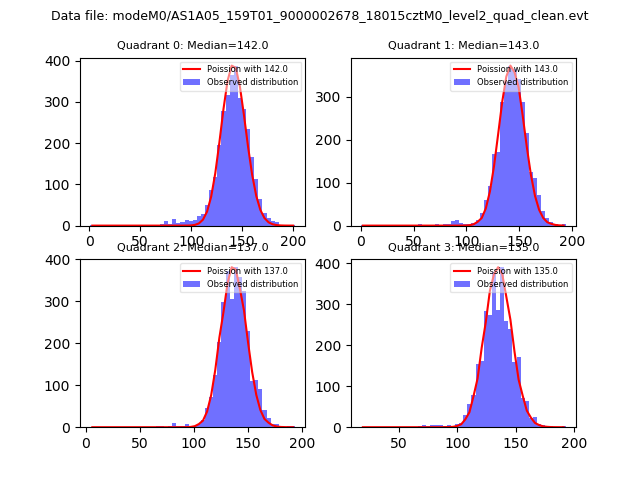 |
 |
| Quadrant-wise count rates Data is divided into 100 sec bins |
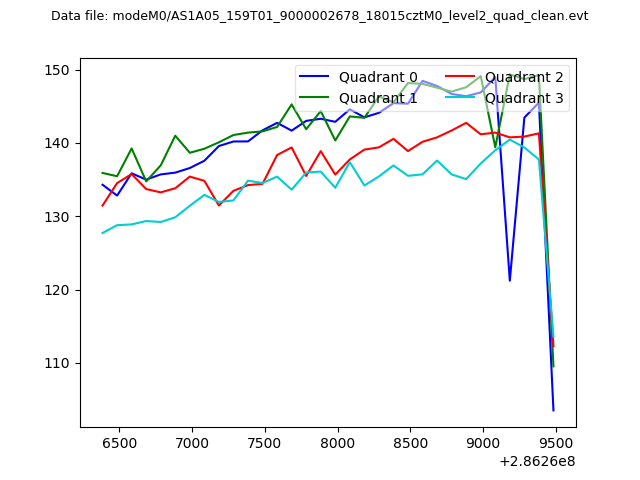 |
|
| Module-wise count rates for Quadrant A Data is divided into 100 sec bins |
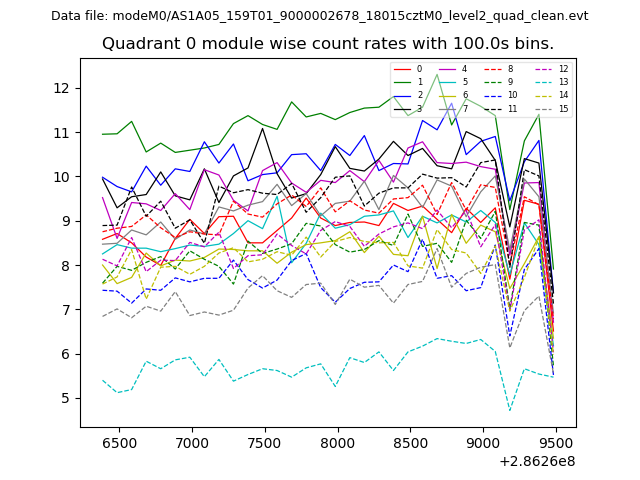 |
 |
| Module-wise count rates for Quadrant B Data is divided into 100 sec bins |
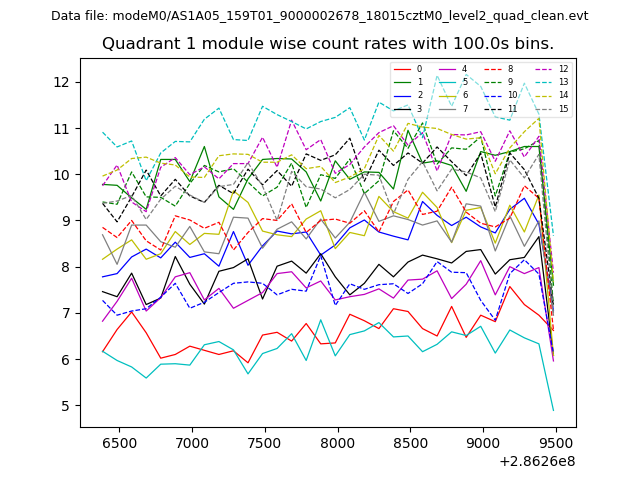 |
 |
| Module-wise count rates for Quadrant C Data is divided into 100 sec bins |
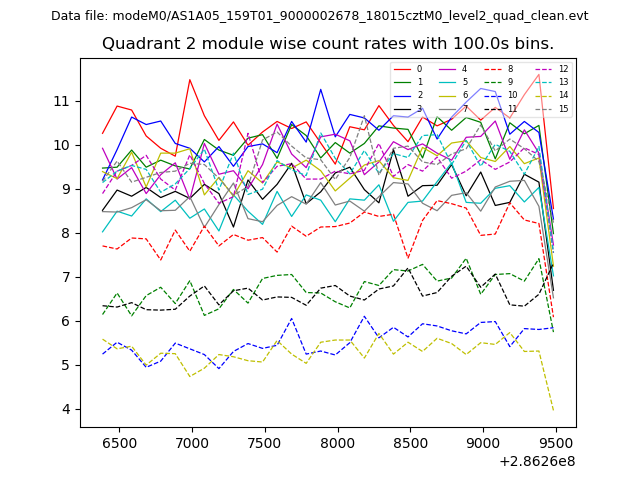 |
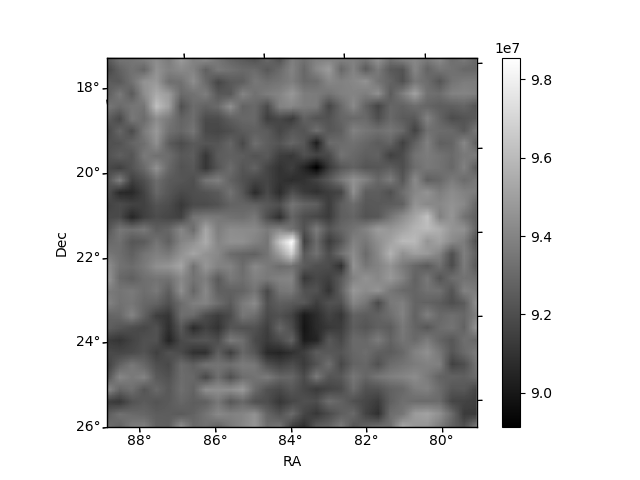 |
| Module-wise count rates for Quadrant D Data is divided into 100 sec bins |
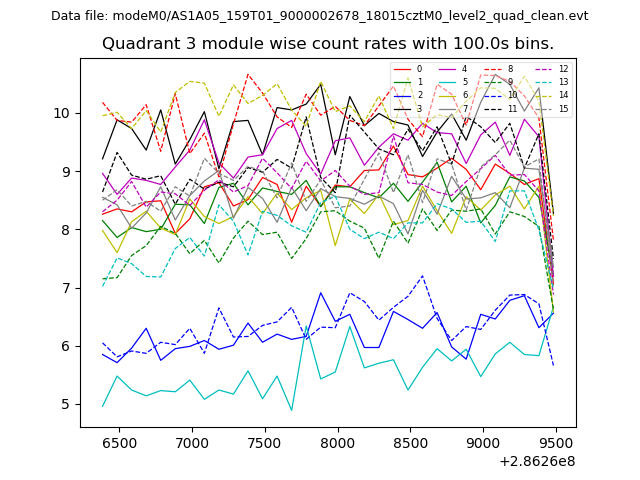 |
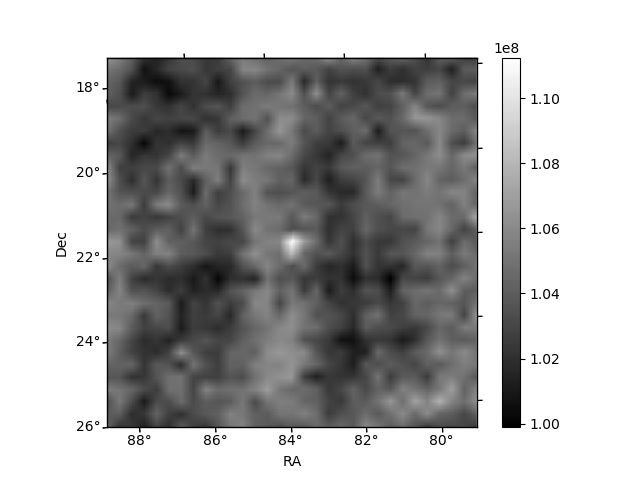 |
| Parameter | Plot |
|---|---|
| CZT HV Monitor | 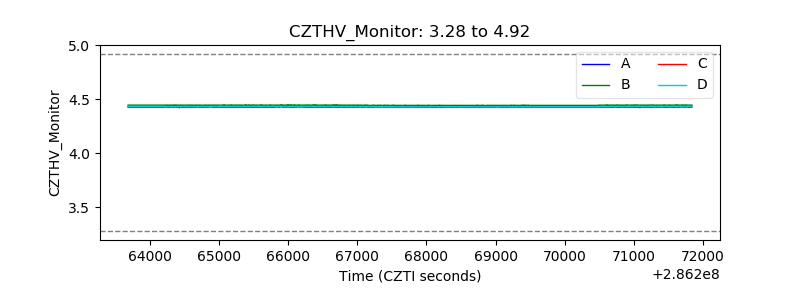 |
| D_VDD | 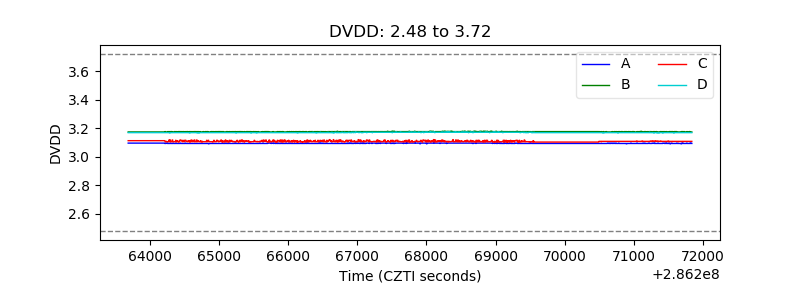 |
| Temperature 1 | 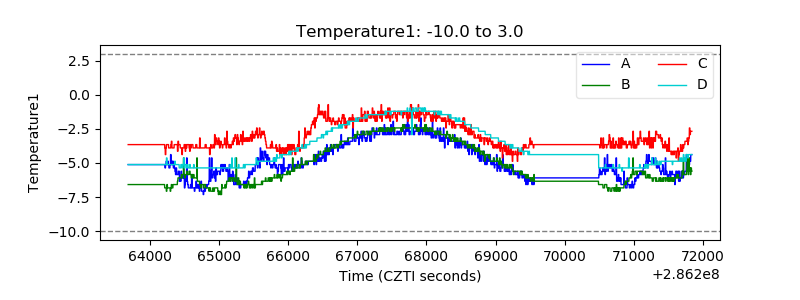 |
| Veto HV Monitor | 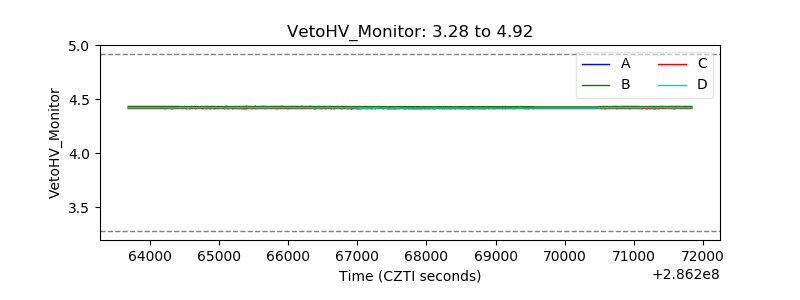 |
| Veto LLD | 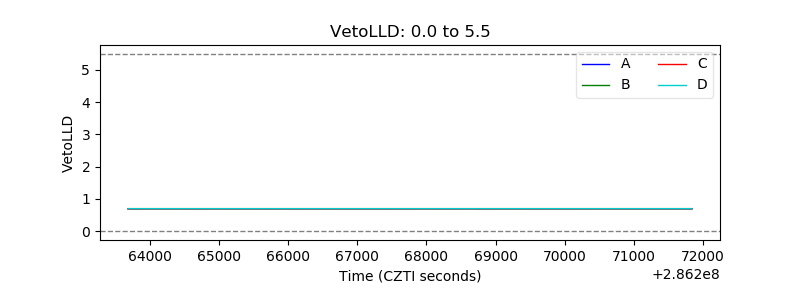 |
| Alpha Counter | 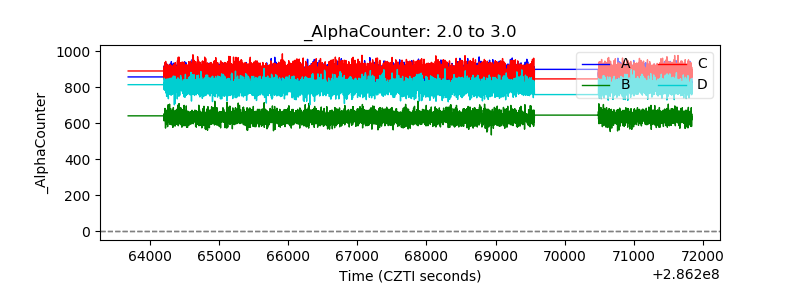 |
| _CPM_Rate | 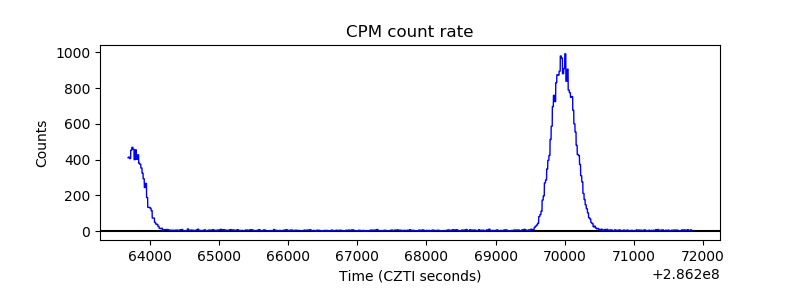 |
| CZT Counter | 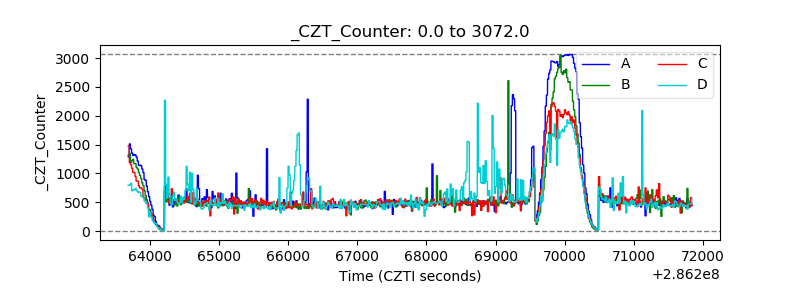 |
| +2.5 Volts monitor |  |
| +5 Volts monitor |  |
| _ROLL_ROT | 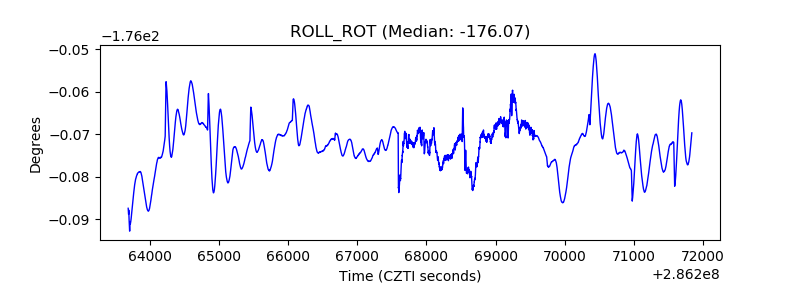 |
| _Roll_DEC | 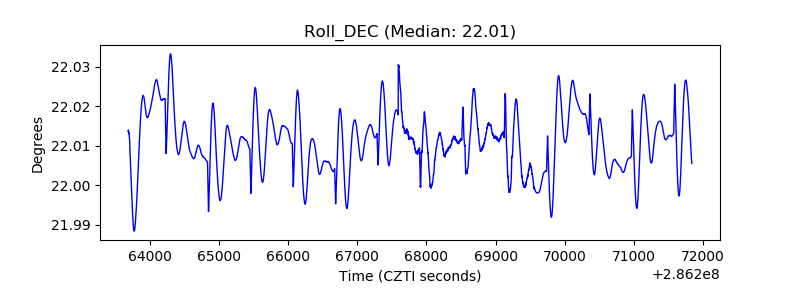 |
| _Roll_RA | 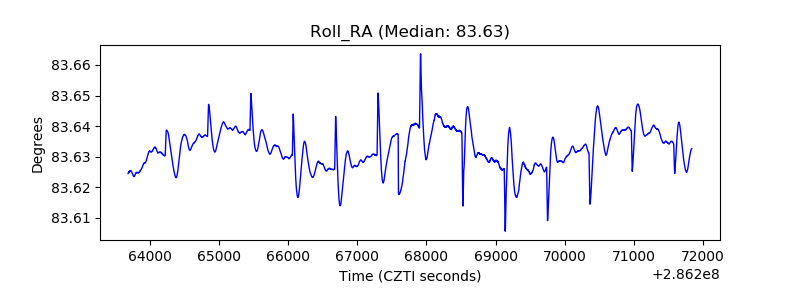 |
| Veto Counter | 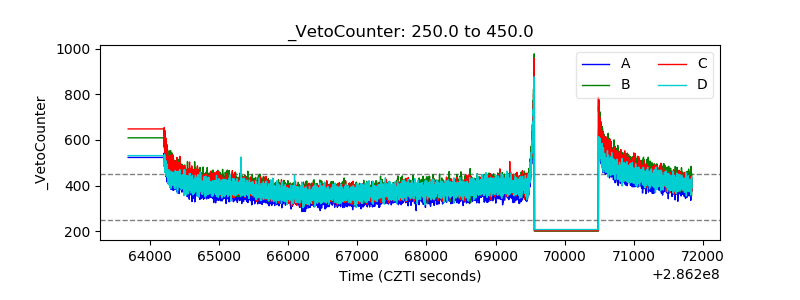 |