| Param | Original file | Final file |
|---|---|---|
| Filename | modeM0/AS1A05_159T01_9000002678_18016cztM0_level2.evt | modeM0/AS1A05_159T01_9000002678_18016cztM0_level2_quad_clean.evt |
| Size (bytes) | 488,574,720 | 85,236,480 |
| Size | 465.9 MB | 81.3 MB |
| Events in quadrant A | 3,470,622 | 538,515 |
| Events in quadrant B | 3,525,508 | 541,578 |
| Events in quadrant C | 3,530,549 | 521,307 |
| Events in quadrant D | 3,808,849 | 506,642 |
| Mode SS | |||
|---|---|---|---|
| Quadrant | BADHDUFLAG | Total packets | Discarded packets |
| A | 0 | 142 | 0 |
| B | 0 | 142 | 0 |
| C | 0 | 142 | 0 |
| D | 0 | 142 | 0 |
| Mode M9 | |||
|---|---|---|---|
| Quadrant | BADHDUFLAG | Total packets | Discarded packets |
| A | 0 | 19 | 0 |
| B | 0 | 19 | 0 |
| C | 0 | 19 | 0 |
| D | 0 | 19 | 0 |
| Mode M0 | |||
|---|---|---|---|
| Quadrant | BADHDUFLAG | Total packets | Discarded packets |
| A | 0 | 14295 | 2 |
| B | 0 | 14479 | 2 |
| C | 0 | 14497 | 2 |
| D | 0 | 15666 | 2 |
| Quadrant | Total seconds | Saturated seconds | Saturation percentage |
|---|---|---|---|
| A | 6779 | 94 | 1.386635% |
| B | 6780 | 116 | 1.710914% |
| C | 6780 | 124 | 1.828909% |
| D | 6780 | 109 | 1.607670% |
Noise dominated data is calculated using 1-second bins in cleaned event files. If a bin has >2000 counts, and if more than 50% of those come from <1% of pixels, then it is considered to be noise-dominated and hence unusable.
| Quadrant | # 1 sec bins | Bins with >0 counts | Bins with >2000 counts | High rate bins dominated by noise | Noise dominated (total time) | Noise dominated (detector-on time) | Marked lightcurve |
|---|---|---|---|---|---|---|---|
| A | 8764 | 6780 | 2 | 2 | 0.02% | 0.03% | 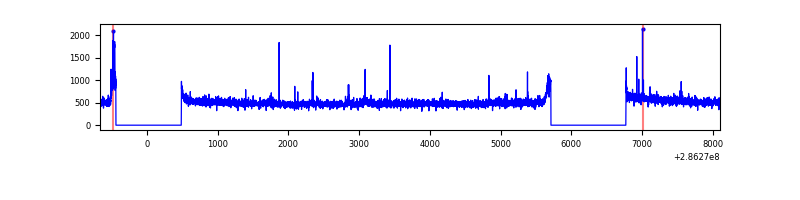 |
| B | 8765 | 6780 | 4 | 4 | 0.05% | 0.06% | 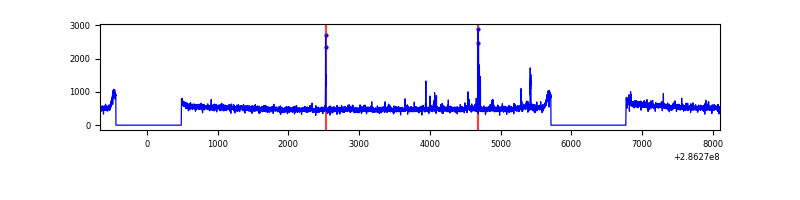 |
| C | 8765 | 6782 | 0 | 0 | 0.00% | 0.00% | 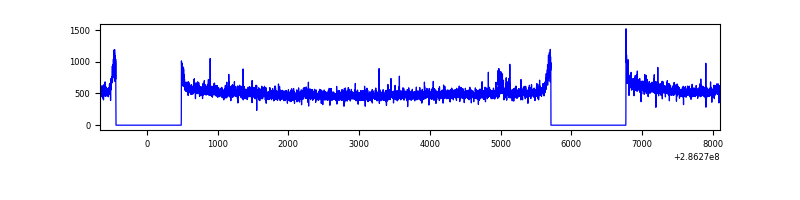 |
| D | 8765 | 6781 | 47 | 47 | 0.54% | 0.69% | 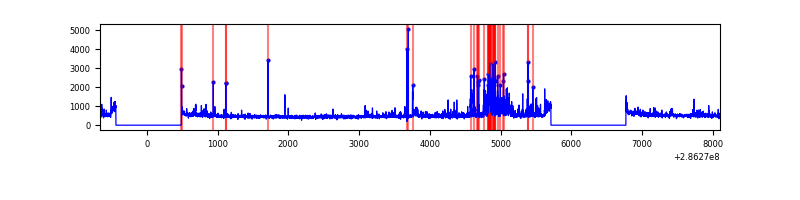 |
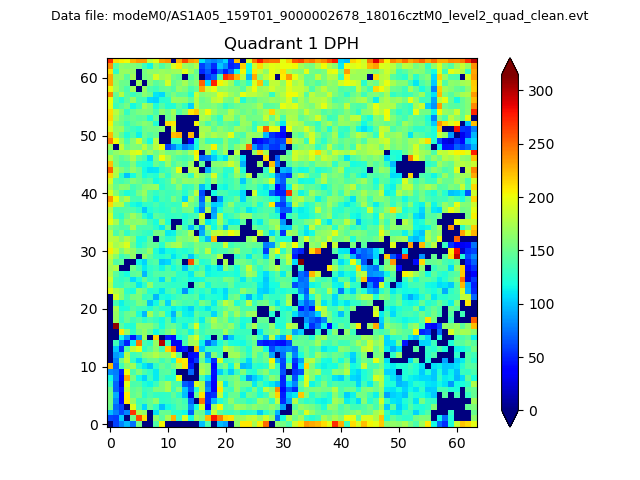
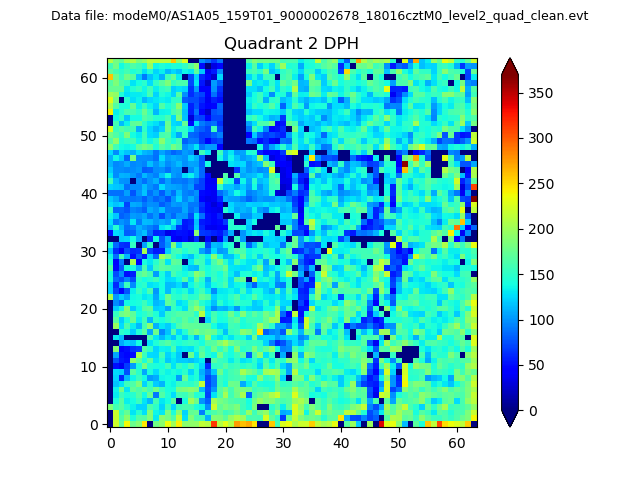
Top three noisy pixels from each quadrant. If the there are fewer than three noisy pixels in the level2.evt file, extra rows are filled as -1
| Pixel properties | Quadrant properties | ||||||
|---|---|---|---|---|---|---|---|
| Quadrant | DetID | PixID | Counts | Sigma | Mean | Median | Sigma |
| A | 15 | 174 | 50996 | 280.78 | 885 | 870 | 178.5 |
| A | 4 | 2 | 18256 | 97.39 | 885 | 870 | 178.5 |
| A | 0 | 226 | 7511 | 37.2 | 885 | 870 | 178.5 |
| B | 0 | 197 | 24725 | 139.54 | 885 | 863 | 171.0 |
| B | 12 | 111 | 20004 | 111.93 | 885 | 863 | 171.0 |
| B | 11 | 111 | 17093 | 94.91 | 885 | 863 | 171.0 |
| C | 14 | 238 | 131019 | 660.5 | 842 | 851 | 197.1 |
| C | 3 | 233 | 66450 | 332.86 | 842 | 851 | 197.1 |
| C | 0 | 207 | 38704 | 192.07 | 842 | 851 | 197.1 |
| D | 7 | 238 | 494397 | 2339.88 | 852 | 827 | 210.9 |
| D | 5 | 222 | 45175 | 210.24 | 852 | 827 | 210.9 |
| D | 2 | 234 | 27877 | 128.23 | 852 | 827 | 210.9 |
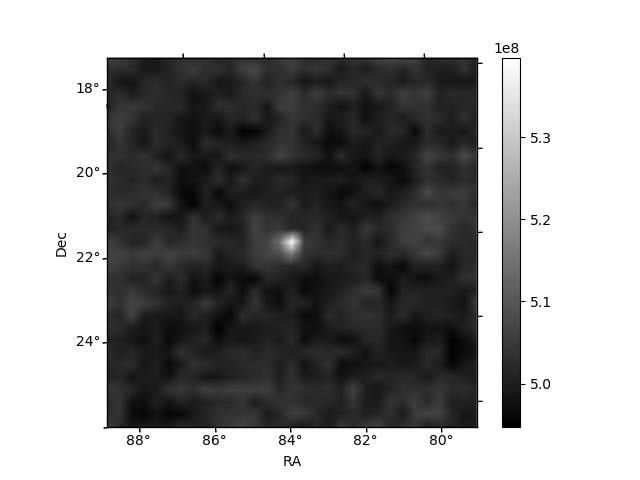
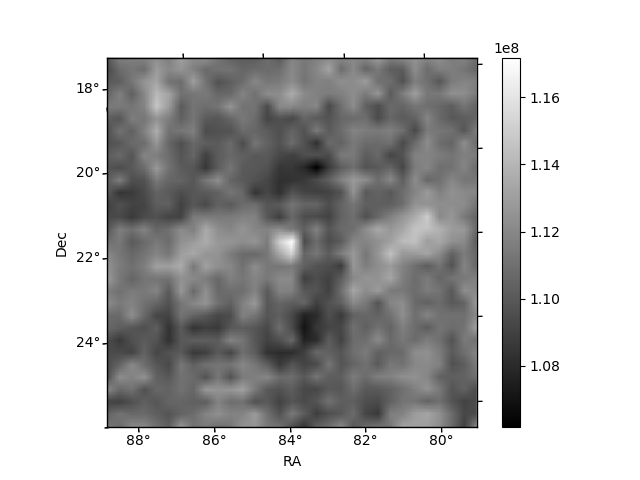
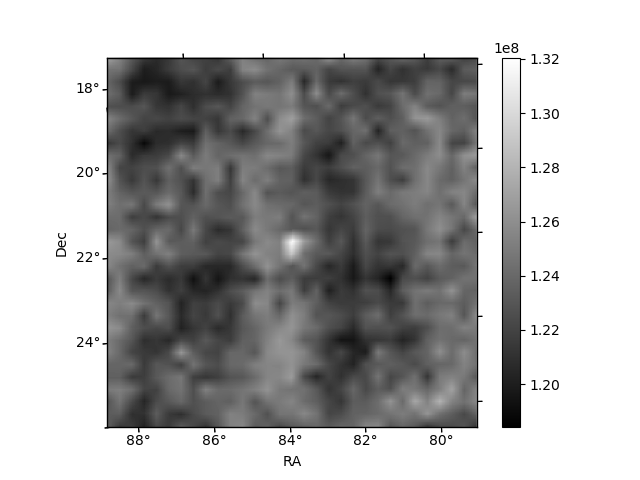
Histogram calculated using DETX and DETY for each event in the final _common_clean file
| Quadrant A | 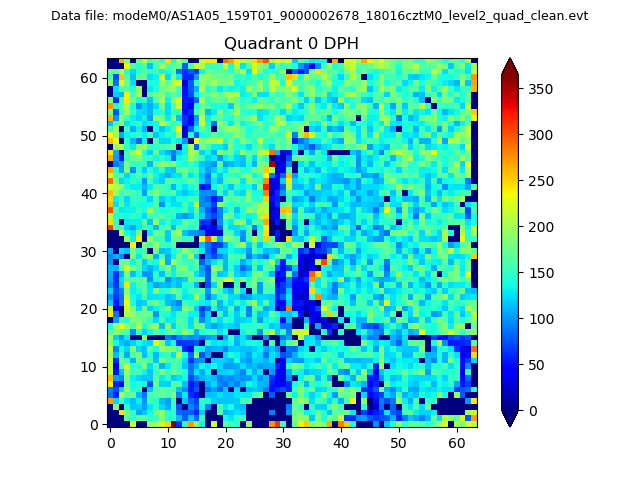 |
 |
Quadrant B |
|---|---|---|---|
| Quadrant D | 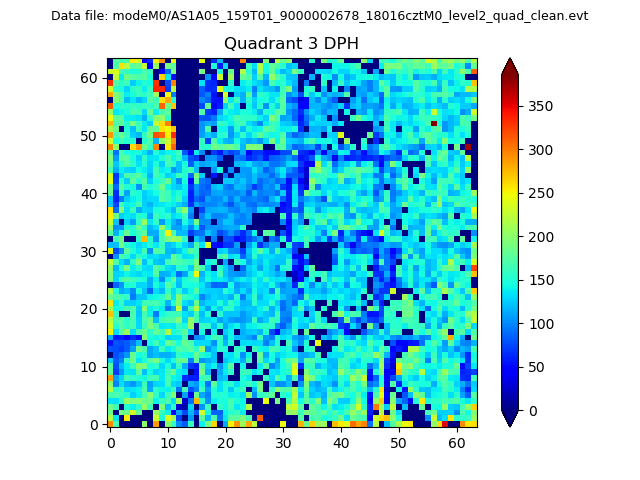 |
 |
Quadrant C |
| Plot type | Count rate plots | Images |
|---|---|---|
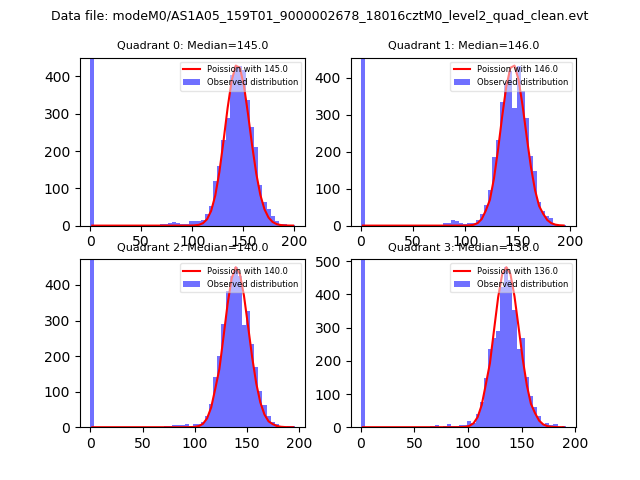
| Comparison with Poisson distribution Blue bars denote a histogram of data divided into 1 sec bins. Red curve is a Poisson curve with rate = median count rate of data. |
 |
 |
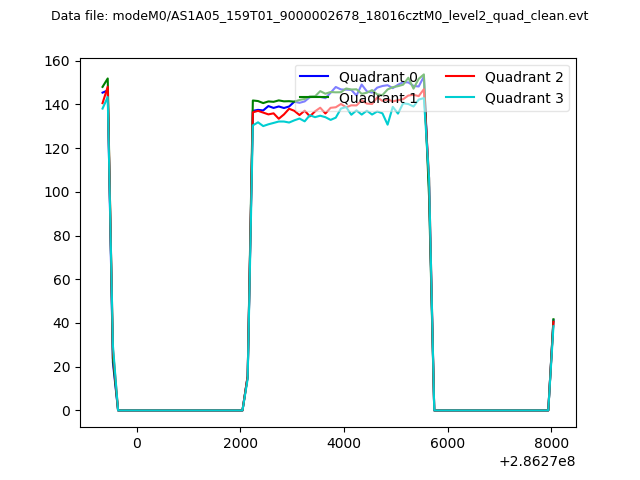
| Quadrant-wise count rates Data is divided into 100 sec bins |
 |
|
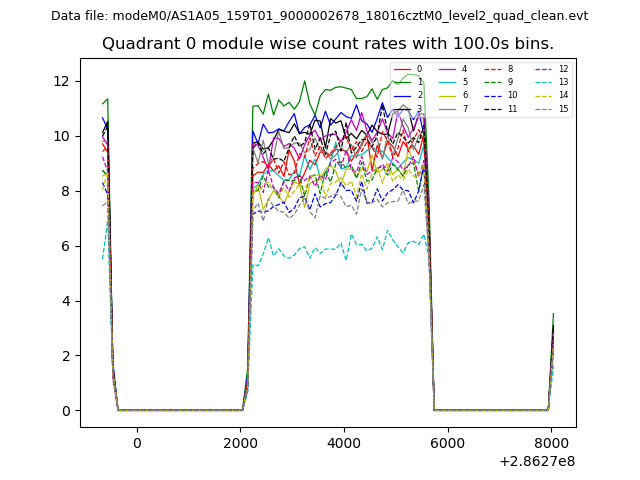
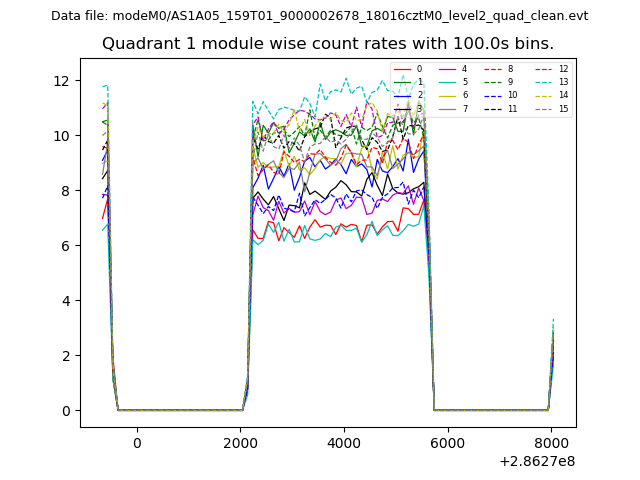
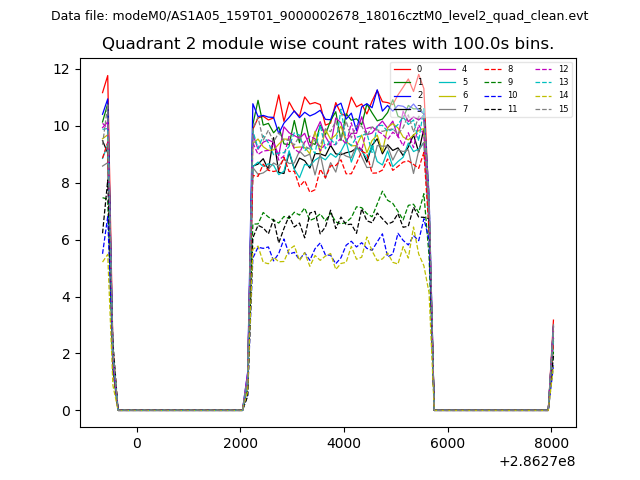
| Module-wise count rates for Quadrant A Data is divided into 100 sec bins |
 |
 |
| Module-wise count rates for Quadrant B Data is divided into 100 sec bins |
 |
 |
| Module-wise count rates for Quadrant C Data is divided into 100 sec bins |
 |
 |
| Module-wise count rates for Quadrant D Data is divided into 100 sec bins |
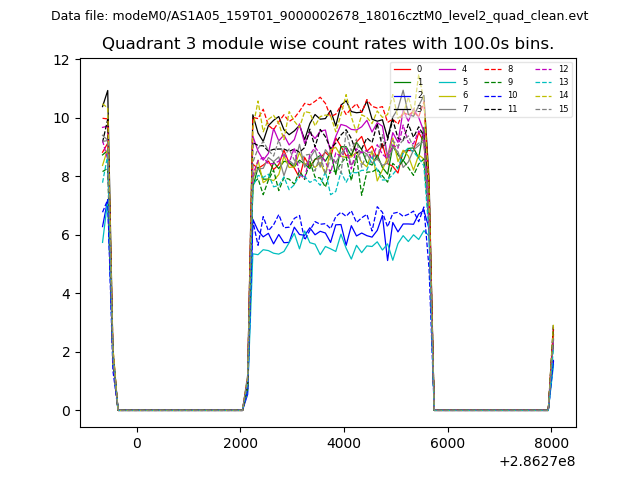 |
 |
| Parameter | Plot |
|---|---|
| CZT HV Monitor | 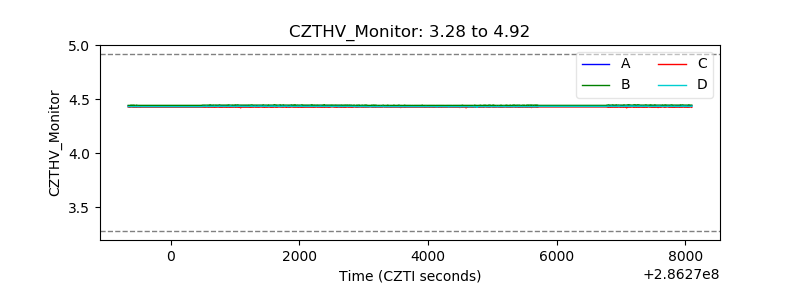 |
| D_VDD | 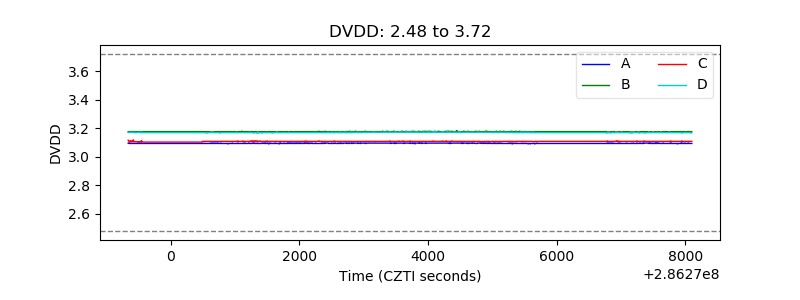 |
| Temperature 1 | 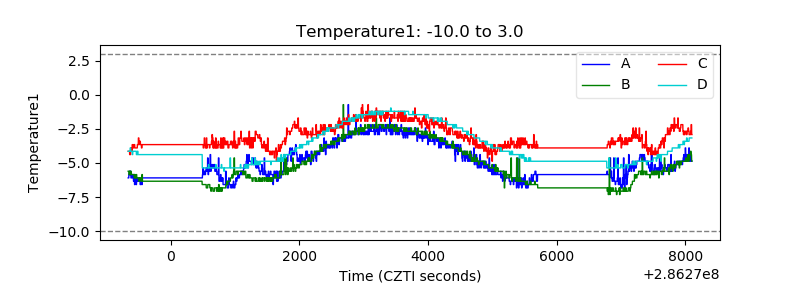 |
| Veto HV Monitor | 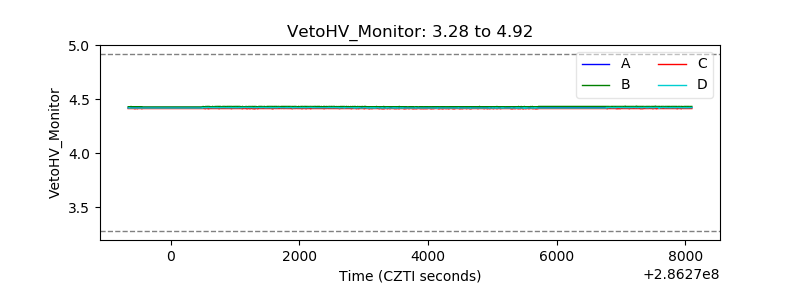 |
| Veto LLD | 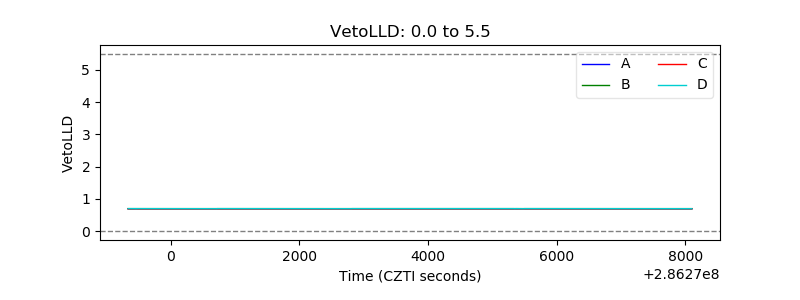 |
| Alpha Counter | 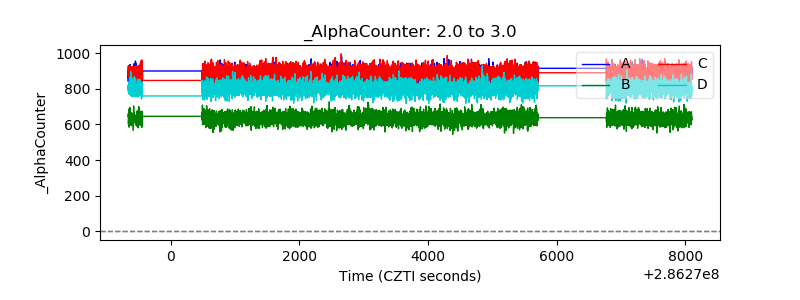 |
| _CPM_Rate | 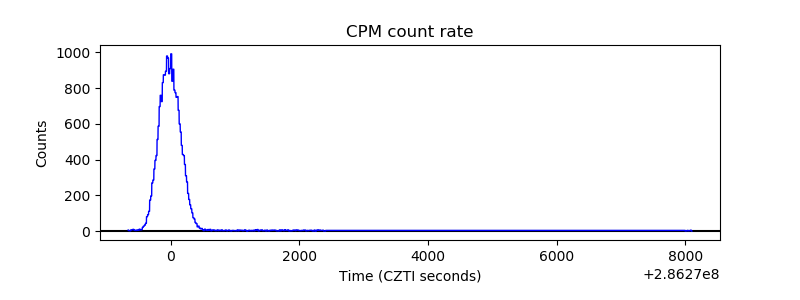 |
| CZT Counter | 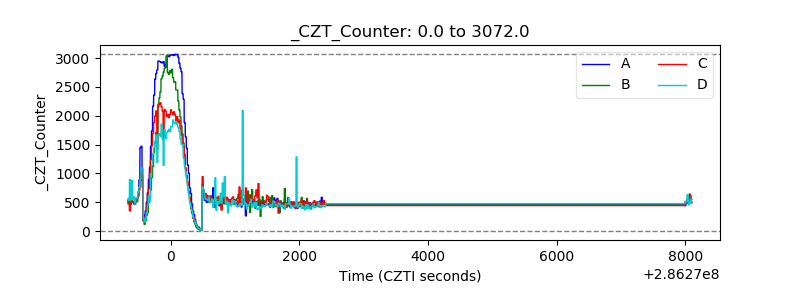 |
| +2.5 Volts monitor |  |
| +5 Volts monitor |  |
| _ROLL_ROT | 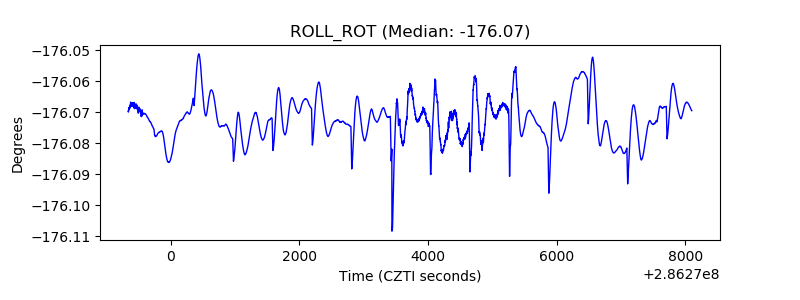 |
| _Roll_DEC | 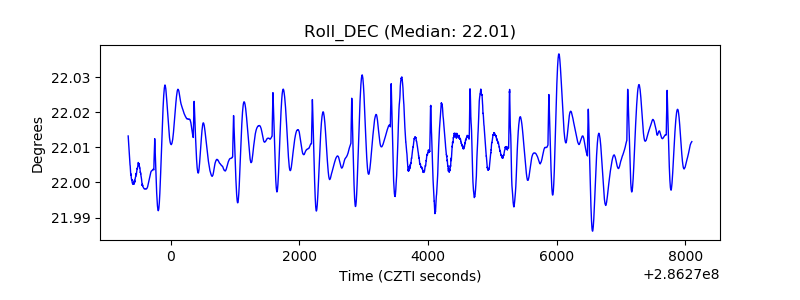 |
| _Roll_RA | 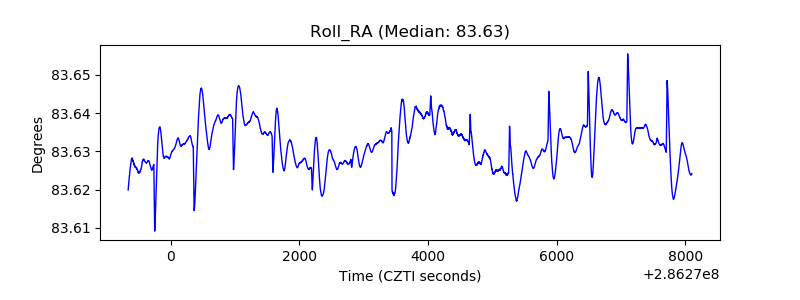 |
| Veto Counter | 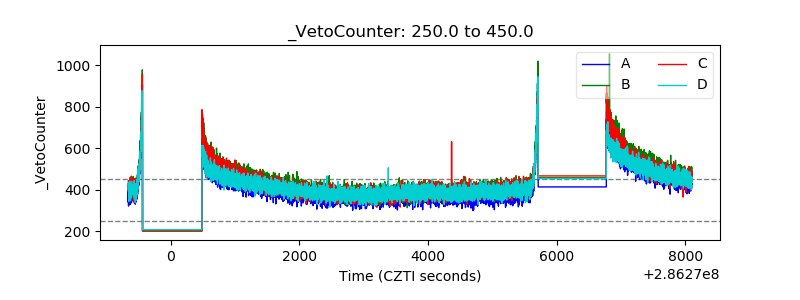 |