| Param | Original file | Final file |
|---|---|---|
| Filename | modeM0/AS1A05_159T01_9000002678_18019cztM0_level2.evt | modeM0/AS1A05_159T01_9000002678_18019cztM0_level2_quad_clean.evt |
| Size (bytes) | 531,276,480 | 106,905,600 |
| Size | 506.7 MB | 102.0 MB |
| Events in quadrant A | 3,686,323 | 722,209 |
| Events in quadrant B | 3,598,197 | 727,123 |
| Events in quadrant C | 3,703,734 | 680,297 |
| Events in quadrant D | 4,670,248 | 664,217 |
| Mode SS | |||
|---|---|---|---|
| Quadrant | BADHDUFLAG | Total packets | Discarded packets |
| A | 0 | 130 | 0 |
| B | 0 | 130 | 0 |
| C | 0 | 130 | 0 |
| D | 0 | 130 | 0 |
| Mode M9 | |||
|---|---|---|---|
| Quadrant | BADHDUFLAG | Total packets | Discarded packets |
| A | 0 | 21 | 0 |
| B | 0 | 22 | 0 |
| C | 0 | 22 | 0 |
| D | 0 | 22 | 0 |
| Mode M0 | |||
|---|---|---|---|
| Quadrant | BADHDUFLAG | Total packets | Discarded packets |
| A | 0 | 15056 | 2 |
| B | 0 | 14693 | 2 |
| C | 0 | 14917 | 2 |
| D | 0 | 18252 | 2 |
| Quadrant | Total seconds | Saturated seconds | Saturation percentage |
|---|---|---|---|
| A | 6360 | 122 | 1.918239% |
| B | 6360 | 108 | 1.698113% |
| C | 6360 | 153 | 2.405660% |
| D | 6360 | 184 | 2.893082% |
Noise dominated data is calculated using 1-second bins in cleaned event files. If a bin has >2000 counts, and if more than 50% of those come from <1% of pixels, then it is considered to be noise-dominated and hence unusable.
| Quadrant | # 1 sec bins | Bins with >0 counts | Bins with >2000 counts | High rate bins dominated by noise | Noise dominated (total time) | Noise dominated (detector-on time) | Marked lightcurve |
|---|---|---|---|---|---|---|---|
| A | 7590 | 6360 | 3 | 3 | 0.04% | 0.05% | 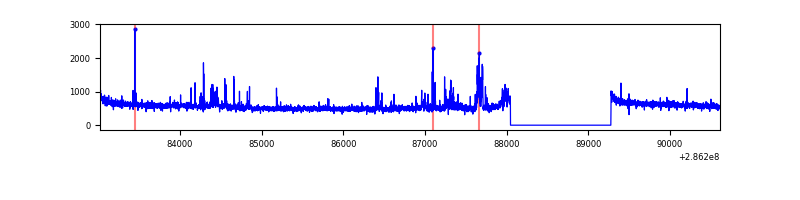 |
| B | 7590 | 6360 | 3 | 3 | 0.04% | 0.05% | 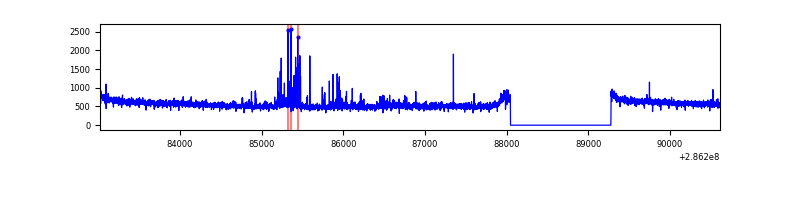 |
| C | 7590 | 6360 | 2 | 2 | 0.03% | 0.03% | 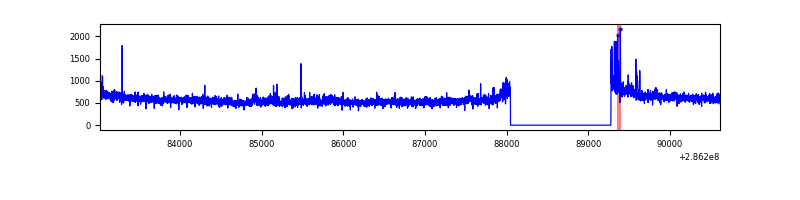 |
| D | 7590 | 6360 | 71 | 71 | 0.94% | 1.12% | 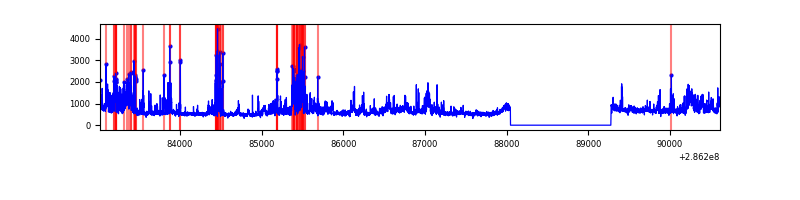 |
Top three noisy pixels from each quadrant. If the there are fewer than three noisy pixels in the level2.evt file, extra rows are filled as -1
| Pixel properties | Quadrant properties | ||||||
|---|---|---|---|---|---|---|---|
| Quadrant | DetID | PixID | Counts | Sigma | Mean | Median | Sigma |
| A | 15 | 174 | 196986 | 1092.89 | 900 | 889 | 179.4 |
| A | 4 | 2 | 27105 | 146.11 | 900 | 889 | 179.4 |
| A | 0 | 226 | 7793 | 38.48 | 900 | 889 | 179.4 |
| B | 7 | 220 | 74991 | 442.88 | 890 | 872 | 167.4 |
| B | 12 | 111 | 18891 | 107.67 | 890 | 872 | 167.4 |
| B | 11 | 111 | 16244 | 91.85 | 890 | 872 | 167.4 |
| C | 3 | 233 | 213097 | 1094.48 | 838 | 848 | 193.9 |
| C | 14 | 238 | 133148 | 682.22 | 838 | 848 | 193.9 |
| C | 0 | 207 | 76847 | 391.9 | 838 | 848 | 193.9 |
| D | 5 | 222 | 908327 | 4295.66 | 860 | 837 | 211.3 |
| D | 11 | 176 | 194663 | 917.49 | 860 | 837 | 211.3 |
| D | 7 | 238 | 133367 | 627.34 | 860 | 837 | 211.3 |
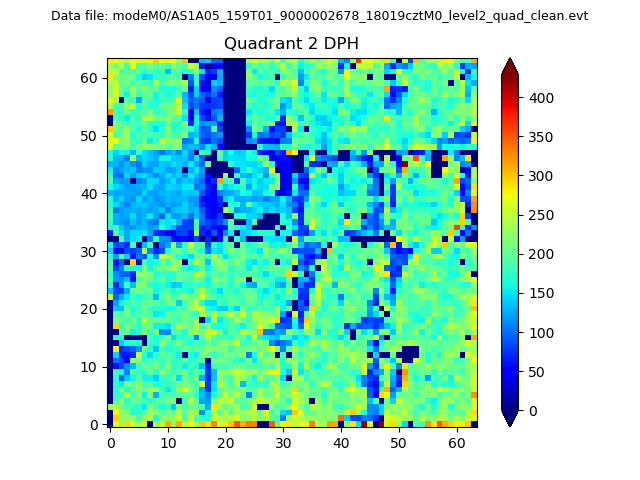
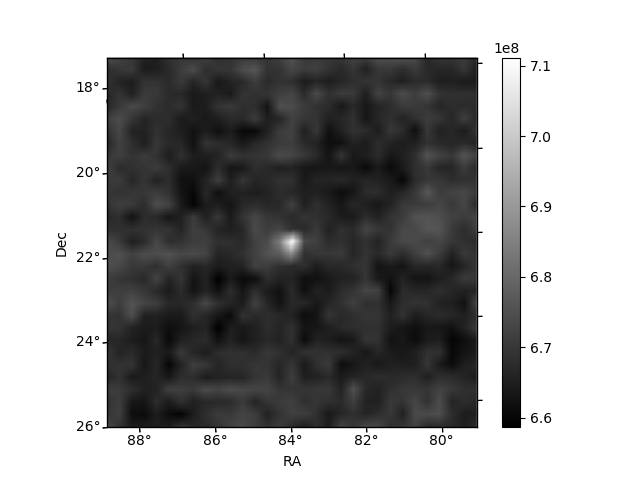
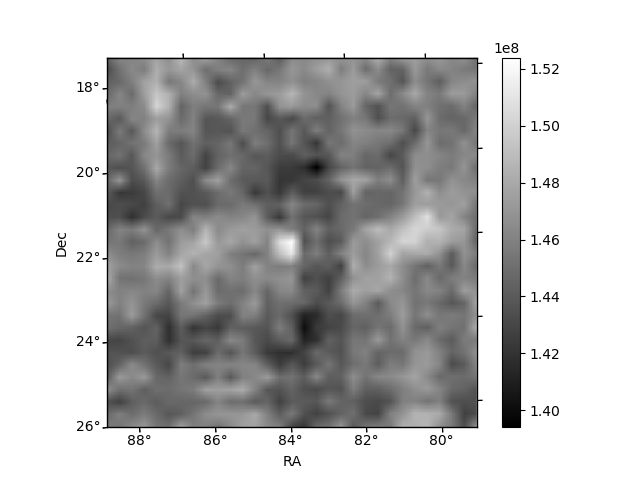
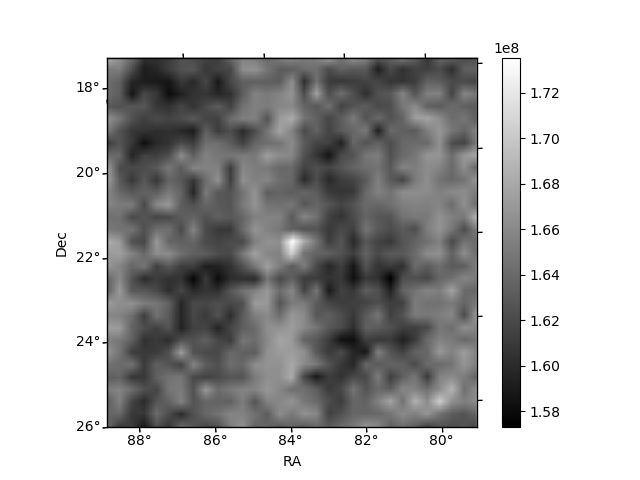
Histogram calculated using DETX and DETY for each event in the final _common_clean file
| Quadrant A | 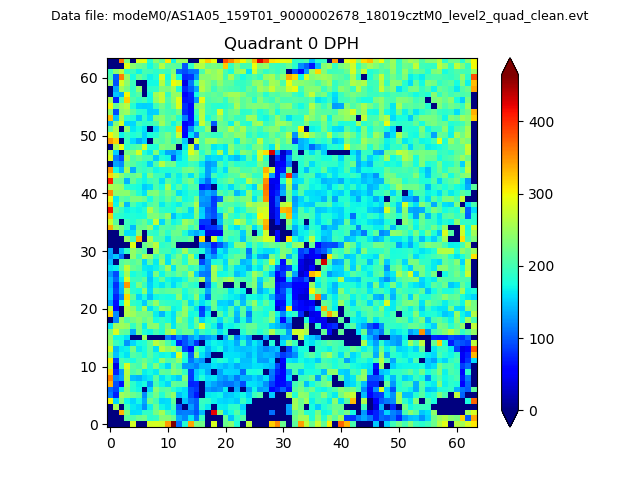 |
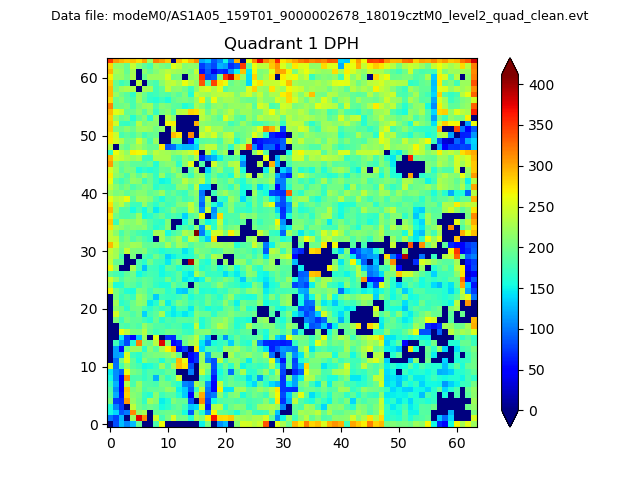 |
Quadrant B |
|---|---|---|---|
| Quadrant D | 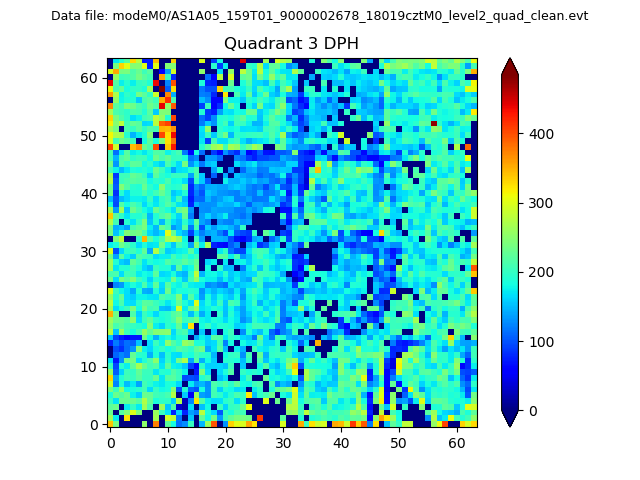 |
 |
Quadrant C |
| Plot type | Count rate plots | Images |
|---|---|---|
| Comparison with Poisson distribution Blue bars denote a histogram of data divided into 1 sec bins. Red curve is a Poisson curve with rate = median count rate of data. |
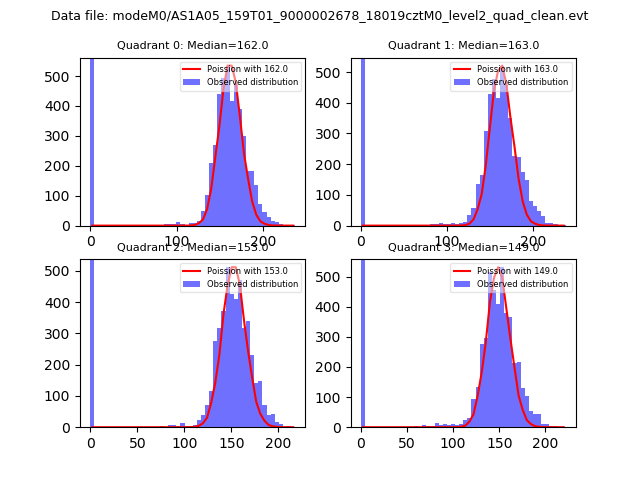 |
 |
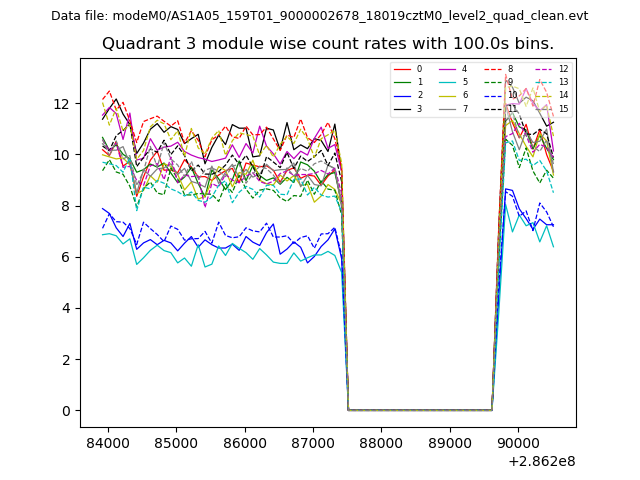
| Quadrant-wise count rates Data is divided into 100 sec bins |
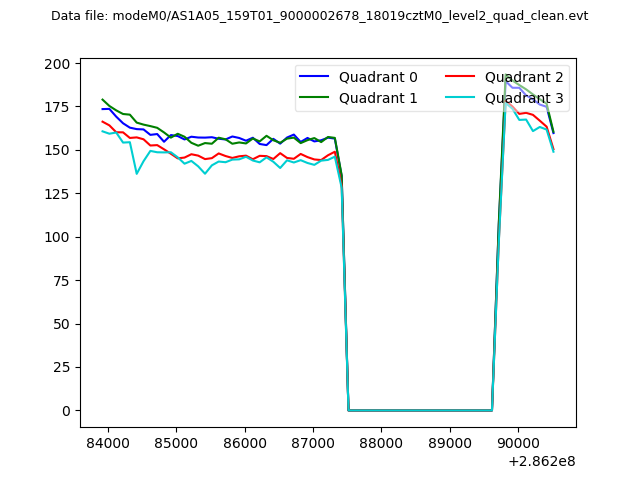 |
|
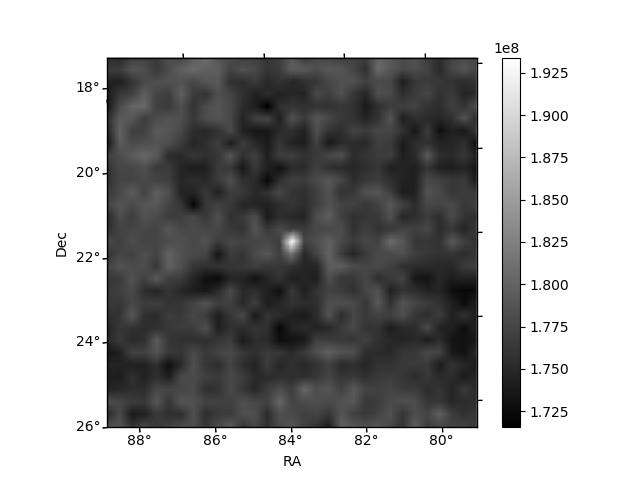
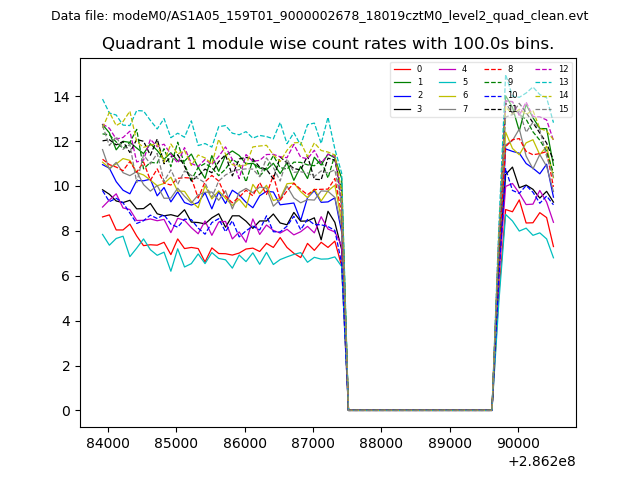
| Module-wise count rates for Quadrant A Data is divided into 100 sec bins |
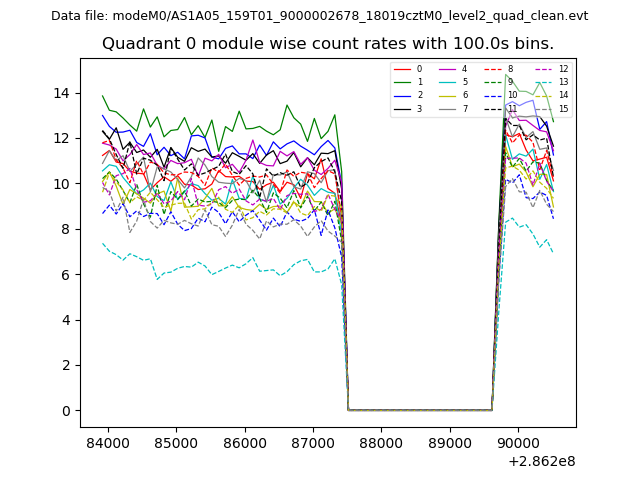 |
 |
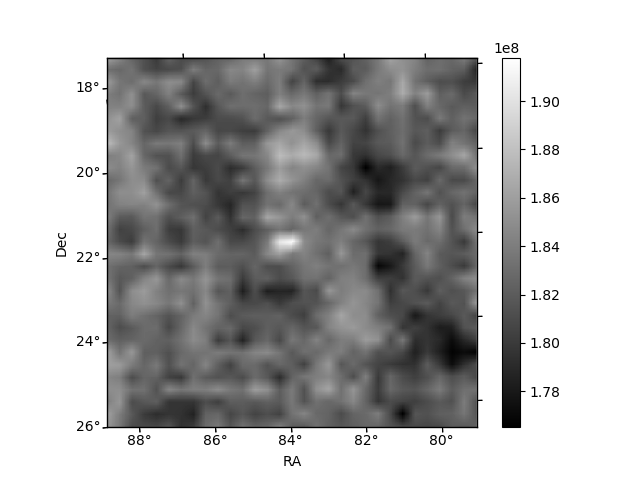
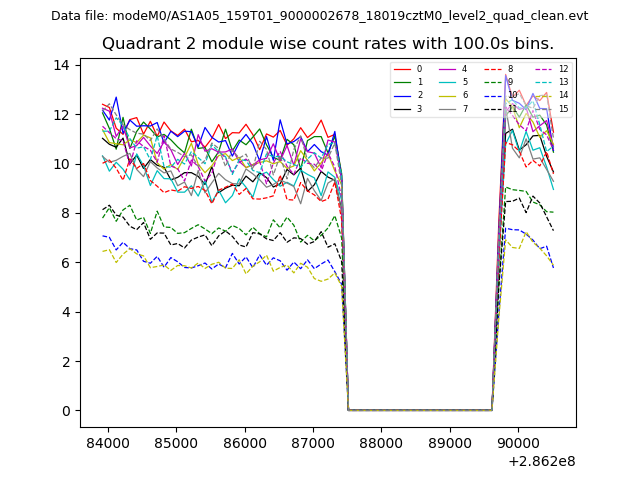
| Module-wise count rates for Quadrant B Data is divided into 100 sec bins |
 |
 |
| Module-wise count rates for Quadrant C Data is divided into 100 sec bins |
 |
 |
| Module-wise count rates for Quadrant D Data is divided into 100 sec bins |
 |
 |
| Parameter | Plot |
|---|---|
| CZT HV Monitor | 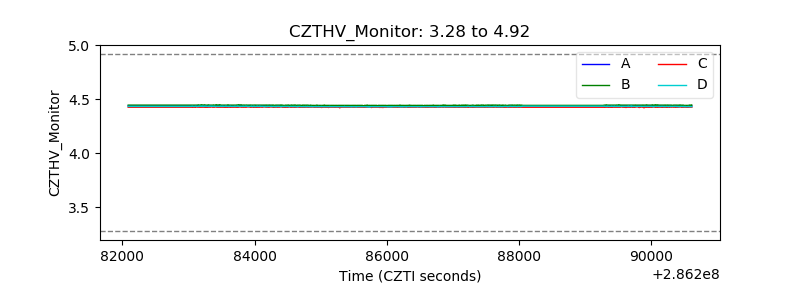 |
| D_VDD | 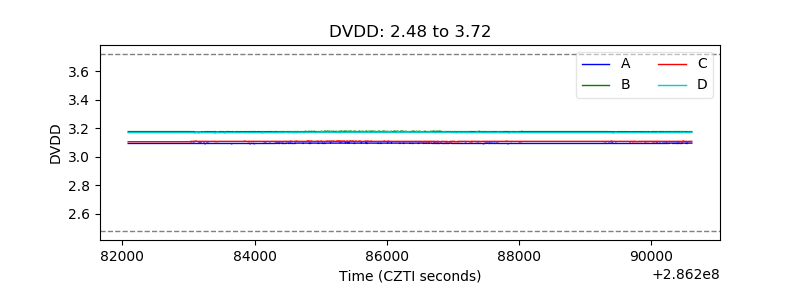 |
| Temperature 1 | 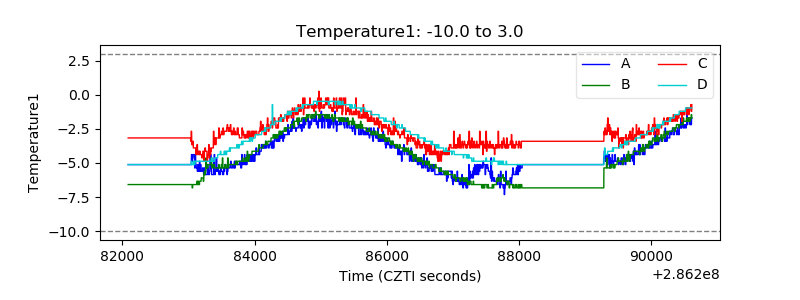 |
| Veto HV Monitor | 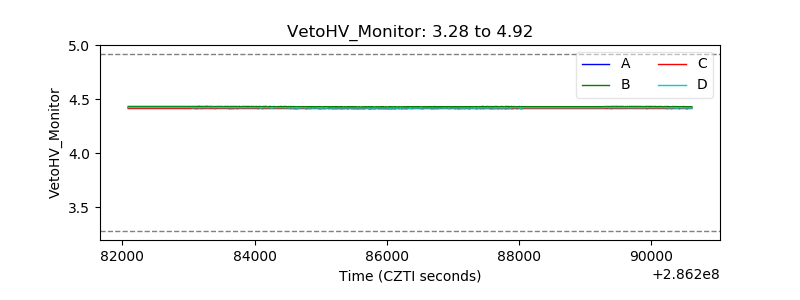 |
| Veto LLD | 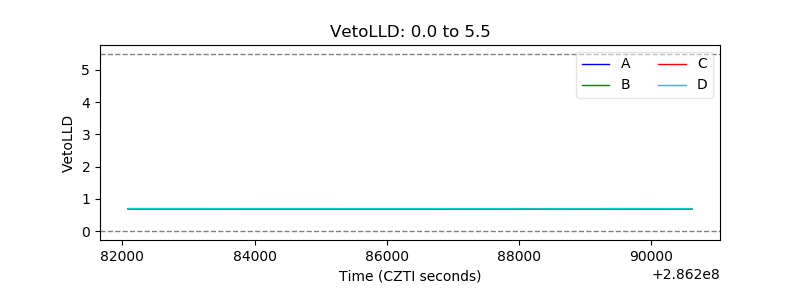 |
| Alpha Counter | 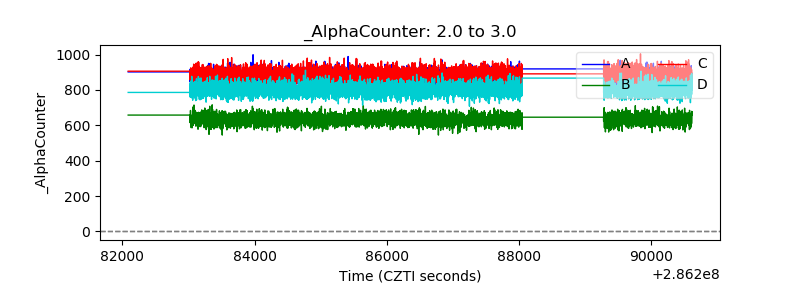 |
| _CPM_Rate |  |
| CZT Counter | 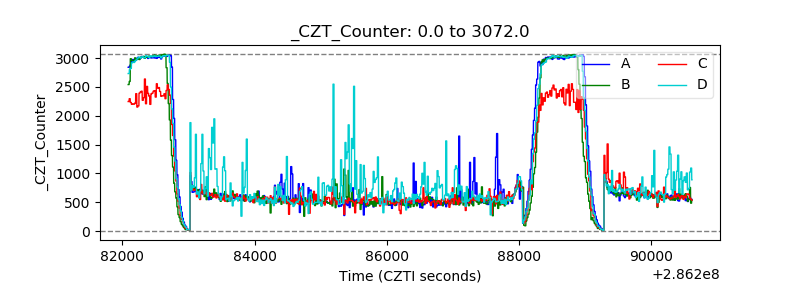 |
| +2.5 Volts monitor | 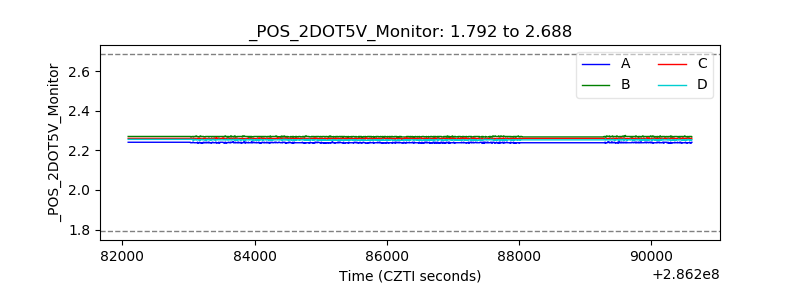 |
| +5 Volts monitor |  |
| _ROLL_ROT | 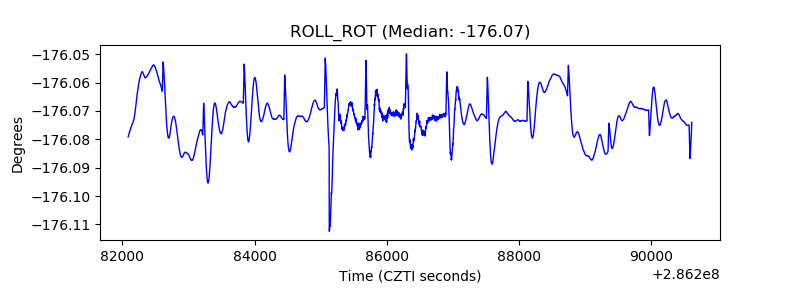 |
| _Roll_DEC | 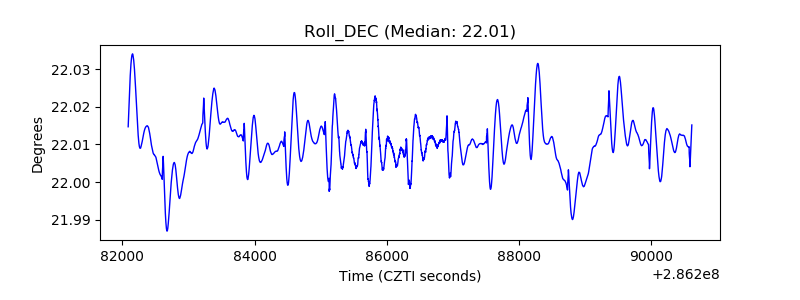 |
| _Roll_RA |  |
| Veto Counter | 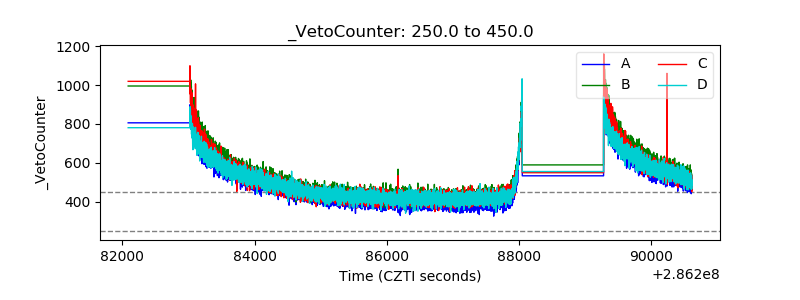 |