| Param | Original file | Final file |
|---|---|---|
| Filename | modeM0/AS1A05_159T01_9000002678_18020cztM0_level2.evt | modeM0/AS1A05_159T01_9000002678_18020cztM0_level2_quad_clean.evt |
| Size (bytes) | 529,741,440 | 116,467,200 |
| Size | 505.2 MB | 111.1 MB |
| Events in quadrant A | 3,371,838 | 816,009 |
| Events in quadrant B | 3,263,852 | 819,248 |
| Events in quadrant C | 3,338,448 | 761,454 |
| Events in quadrant D | 5,678,225 | 727,259 |
| Mode SS | |||
|---|---|---|---|
| Quadrant | BADHDUFLAG | Total packets | Discarded packets |
| A | 0 | 118 | 0 |
| B | 0 | 118 | 0 |
| C | 0 | 118 | 0 |
| D | 0 | 118 | 0 |
| Mode M9 | |||
|---|---|---|---|
| Quadrant | BADHDUFLAG | Total packets | Discarded packets |
| A | 0 | 13 | 0 |
| B | 0 | 13 | 0 |
| C | 0 | 13 | 0 |
| D | 0 | 13 | 0 |
| Mode M0 | |||
|---|---|---|---|
| Quadrant | BADHDUFLAG | Total packets | Discarded packets |
| A | 0 | 13710 | 1 |
| B | 0 | 13259 | 1 |
| C | 0 | 13488 | 1 |
| D | 0 | 21137 | 1 |
| Quadrant | Total seconds | Saturated seconds | Saturation percentage |
|---|---|---|---|
| A | 5770 | 124 | 2.149047% |
| B | 5771 | 115 | 1.992722% |
| C | 5771 | 137 | 2.373939% |
| D | 5771 | 451 | 7.814937% |
Noise dominated data is calculated using 1-second bins in cleaned event files. If a bin has >2000 counts, and if more than 50% of those come from <1% of pixels, then it is considered to be noise-dominated and hence unusable.
| Quadrant | # 1 sec bins | Bins with >0 counts | Bins with >2000 counts | High rate bins dominated by noise | Noise dominated (total time) | Noise dominated (detector-on time) | Marked lightcurve |
|---|---|---|---|---|---|---|---|
| A | 7045 | 5770 | 22 | 22 | 0.31% | 0.38% | 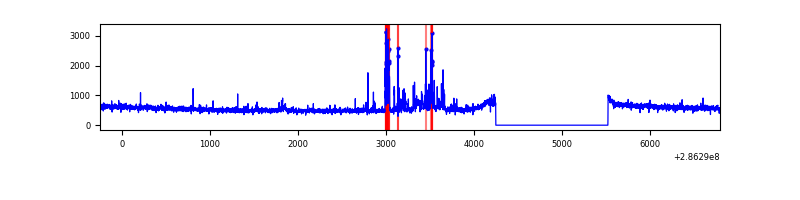 |
| B | 7046 | 5771 | 8 | 8 | 0.11% | 0.14% | 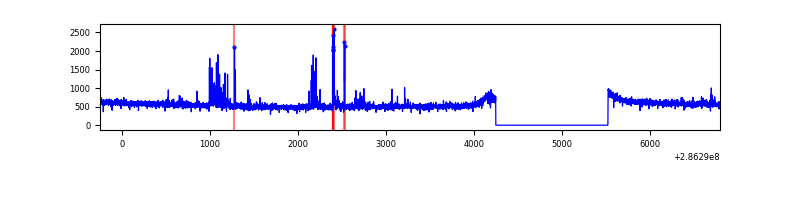 |
| C | 7046 | 5772 | 0 | 0 | 0.00% | 0.00% | 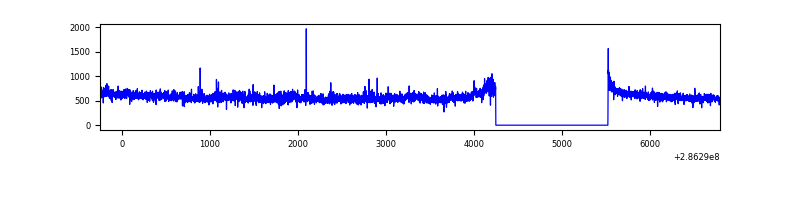 |
| D | 7046 | 5771 | 312 | 312 | 4.43% | 5.41% | 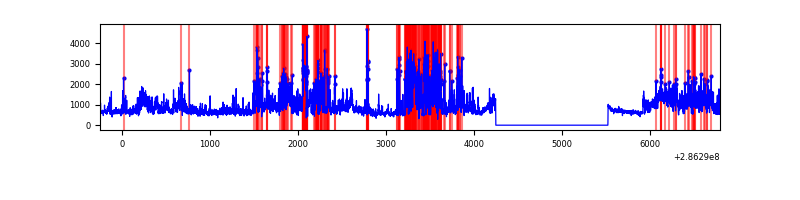 |
Top three noisy pixels from each quadrant. If the there are fewer than three noisy pixels in the level2.evt file, extra rows are filled as -1
| Pixel properties | Quadrant properties | ||||||
|---|---|---|---|---|---|---|---|
| Quadrant | DetID | PixID | Counts | Sigma | Mean | Median | Sigma |
| A | 15 | 174 | 237944 | 1448.96 | 812 | 802 | 163.7 |
| A | 4 | 2 | 10493 | 59.21 | 812 | 802 | 163.7 |
| A | 0 | 226 | 7159 | 38.84 | 812 | 802 | 163.7 |
| B | 7 | 220 | 58785 | 380.72 | 801 | 787 | 152.3 |
| B | 5 | 172 | 23822 | 151.21 | 801 | 787 | 152.3 |
| B | 0 | 197 | 21387 | 135.23 | 801 | 787 | 152.3 |
| C | 3 | 233 | 209253 | 1195.69 | 754 | 763 | 174.4 |
| C | 14 | 238 | 119936 | 683.46 | 754 | 763 | 174.4 |
| C | 0 | 207 | 58341 | 330.21 | 754 | 763 | 174.4 |
| D | 5 | 222 | 1644320 | 8853.36 | 762 | 742 | 185.6 |
| D | 7 | 238 | 601136 | 3234.1 | 762 | 742 | 185.6 |
| D | 7 | 38 | 212000 | 1137.97 | 762 | 742 | 185.6 |
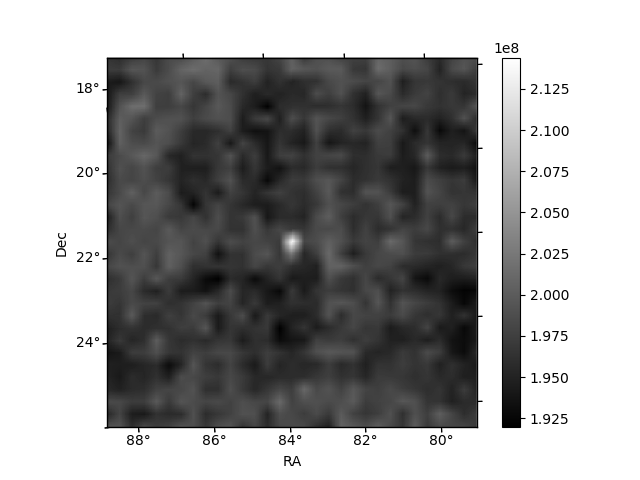
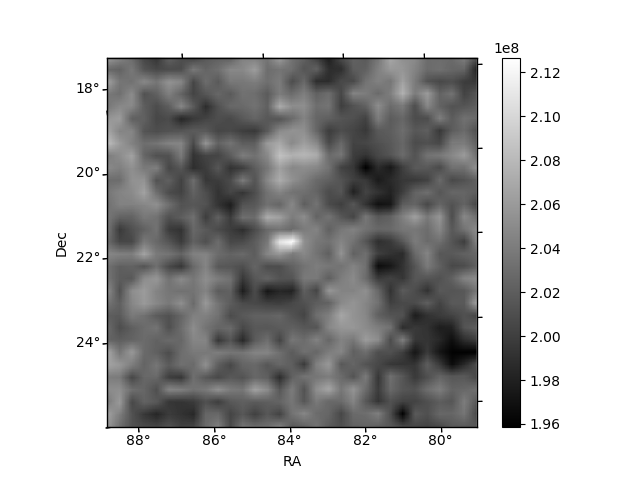
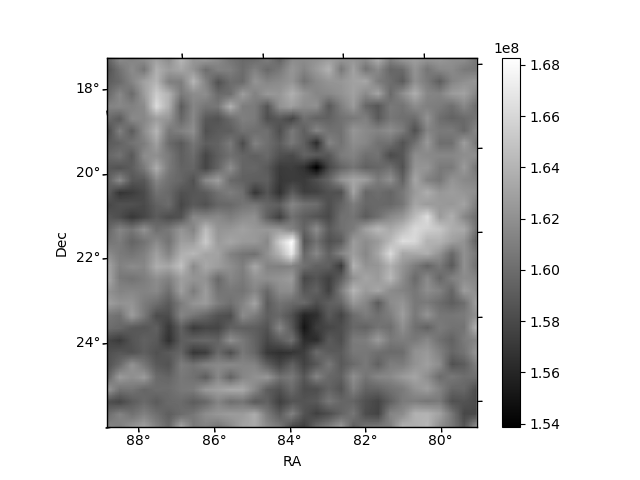
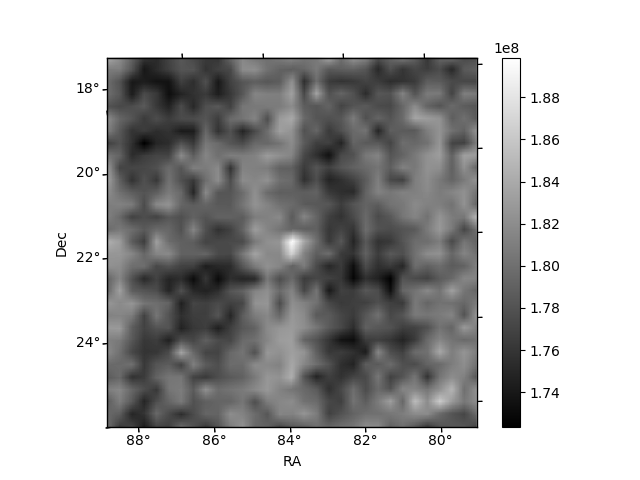
Histogram calculated using DETX and DETY for each event in the final _common_clean file
| Quadrant A | 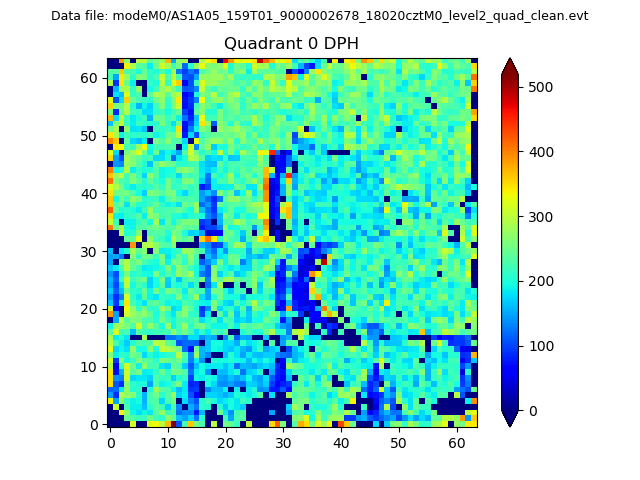 |
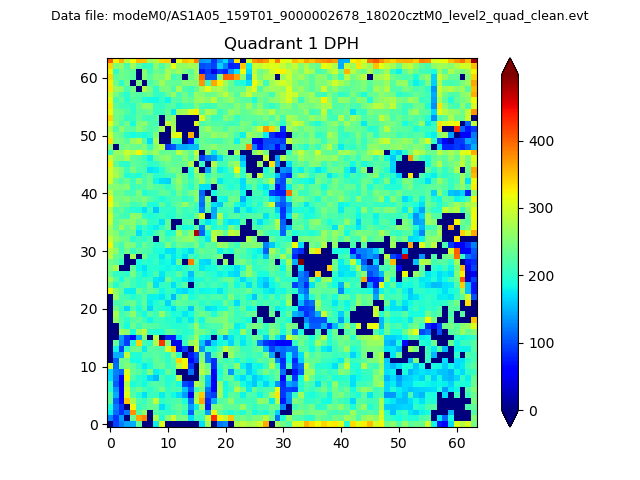 |
Quadrant B |
|---|---|---|---|
| Quadrant D | 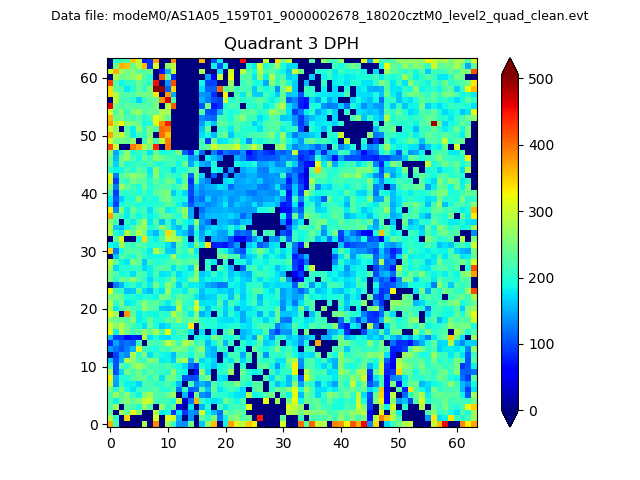 |
 |
Quadrant C |
| Plot type | Count rate plots | Images |
|---|---|---|
| Comparison with Poisson distribution Blue bars denote a histogram of data divided into 1 sec bins. Red curve is a Poisson curve with rate = median count rate of data. |
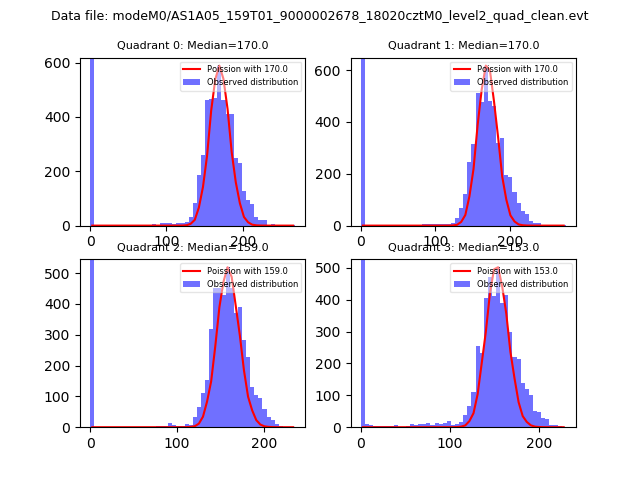 |
 |
| Quadrant-wise count rates Data is divided into 100 sec bins |
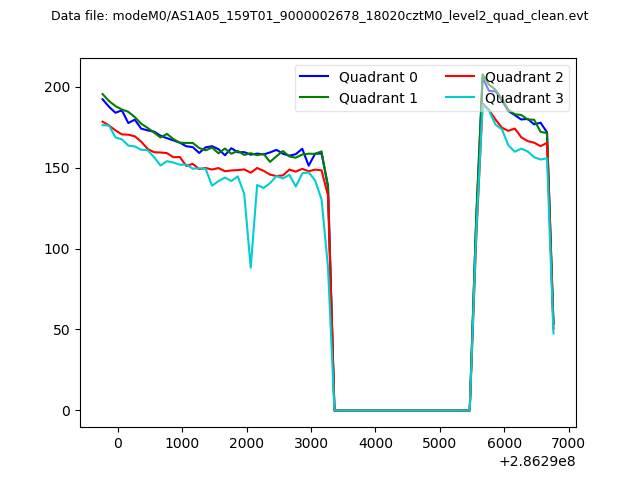 |
|
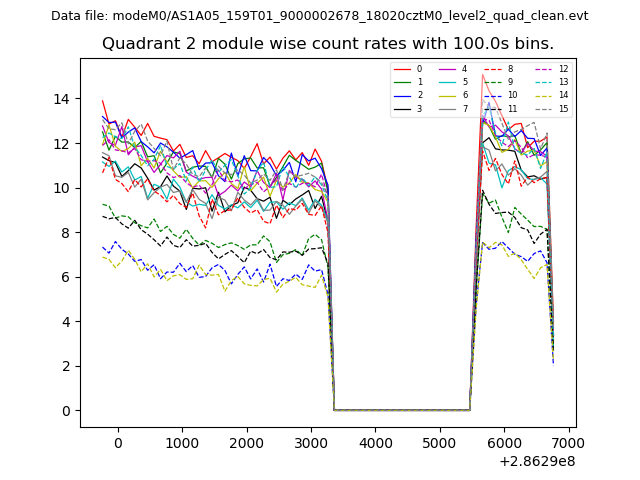
| Module-wise count rates for Quadrant A Data is divided into 100 sec bins |
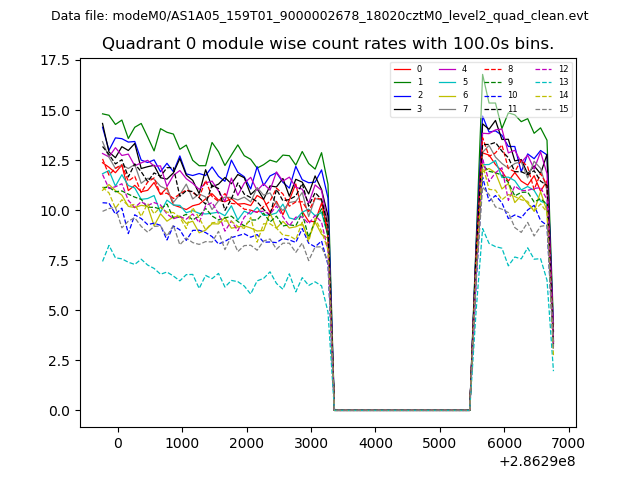 |
 |
| Module-wise count rates for Quadrant B Data is divided into 100 sec bins |
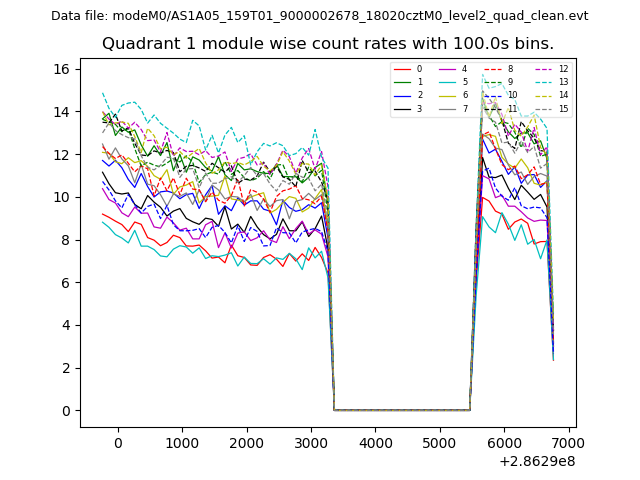 |
 |
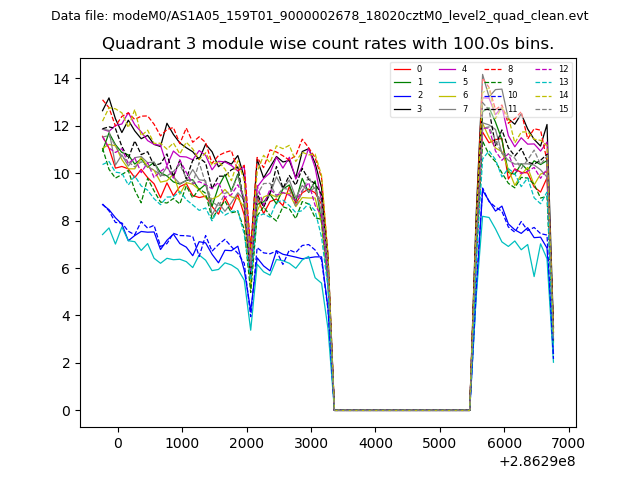
| Module-wise count rates for Quadrant C Data is divided into 100 sec bins |
 |
 |
| Module-wise count rates for Quadrant D Data is divided into 100 sec bins |
 |
 |
| Parameter | Plot |
|---|---|
| CZT HV Monitor | 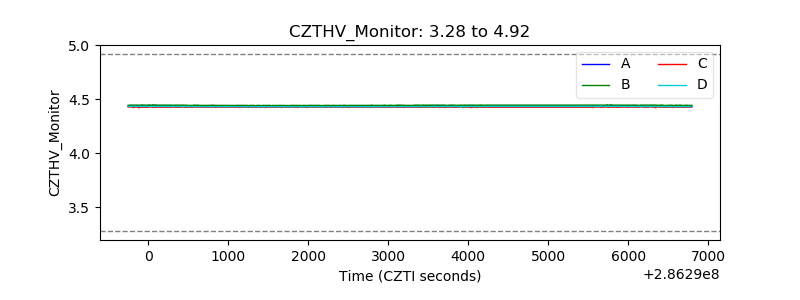 |
| D_VDD | 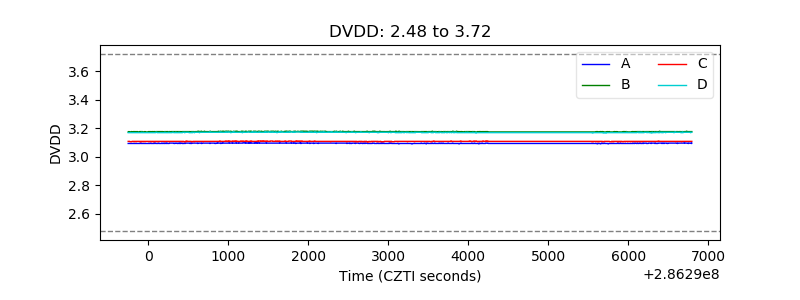 |
| Temperature 1 | 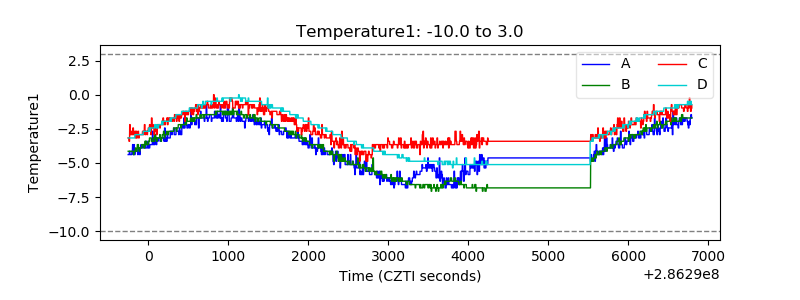 |
| Veto HV Monitor | 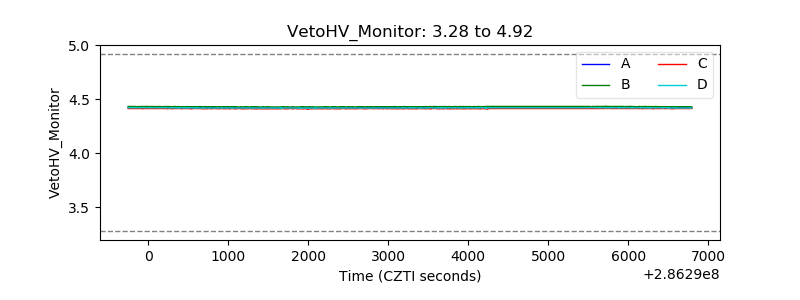 |
| Veto LLD | 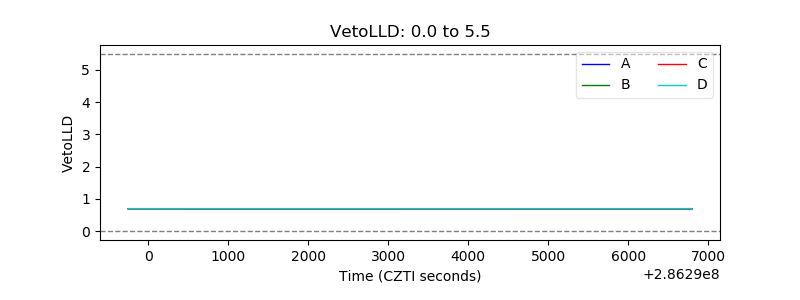 |
| Alpha Counter | 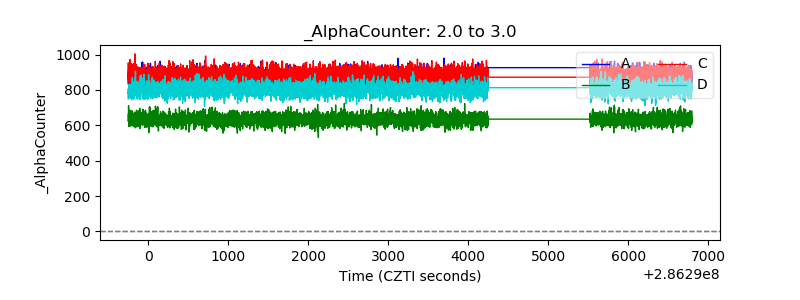 |
| _CPM_Rate | 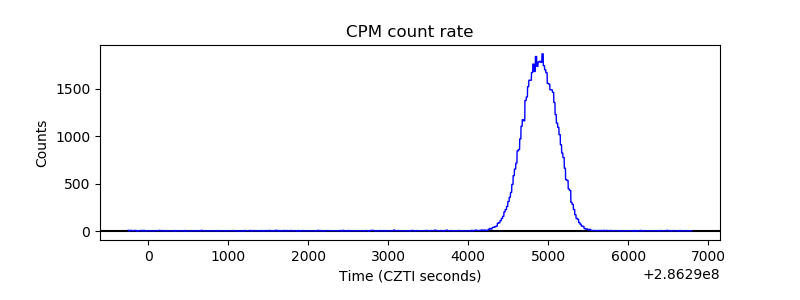 |
| CZT Counter |  |
| +2.5 Volts monitor |  |
| +5 Volts monitor | 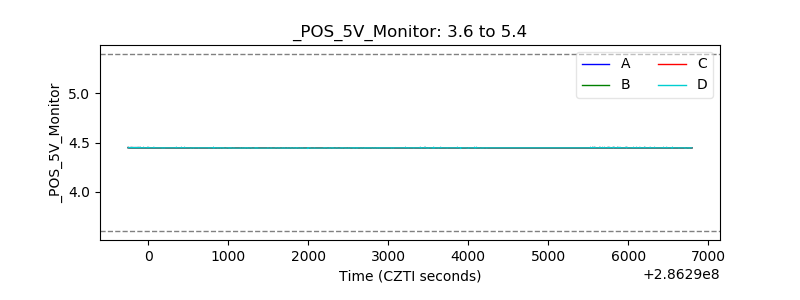 |
| _ROLL_ROT | 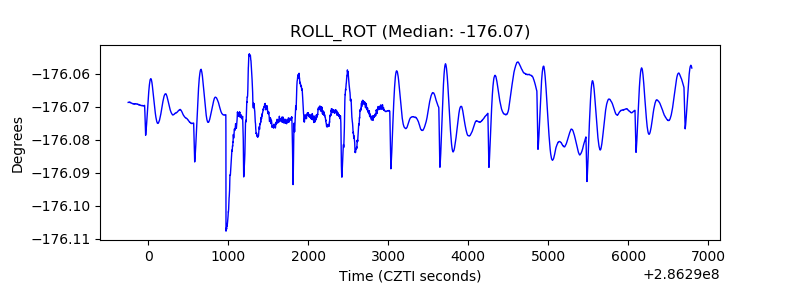 |
| _Roll_DEC | 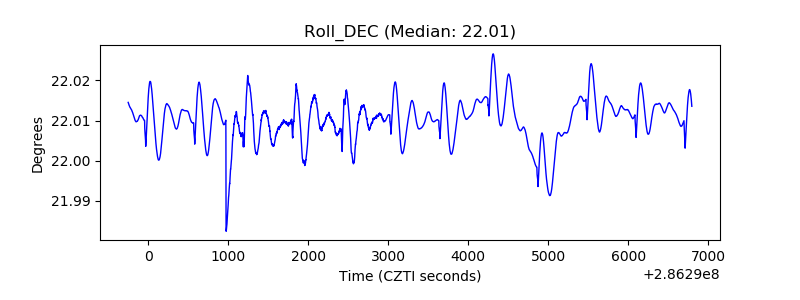 |
| _Roll_RA | 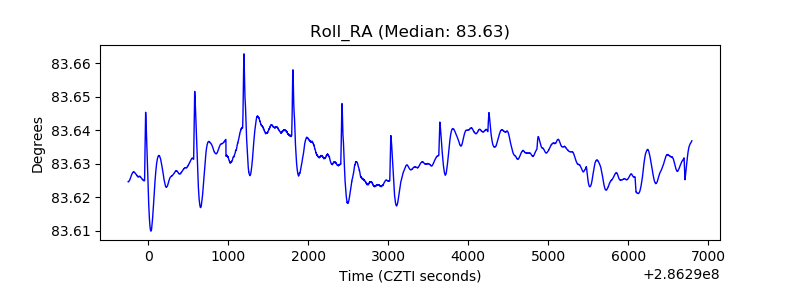 |
| Veto Counter | 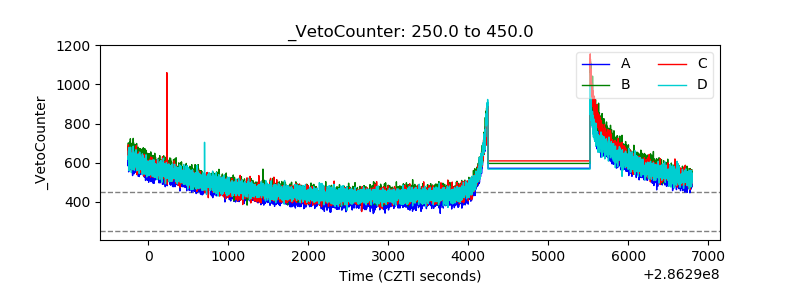 |