| Param | Original file | Final file |
|---|---|---|
| Filename | modeM0/AS1A05_159T01_9000002678_18021cztM0_level2.evt | modeM0/AS1A05_159T01_9000002678_18021cztM0_level2_quad_clean.evt |
| Size (bytes) | 543,867,840 | 124,960,320 |
| Size | 518.7 MB | 119.2 MB |
| Events in quadrant A | 3,625,248 | 869,360 |
| Events in quadrant B | 3,642,337 | 872,073 |
| Events in quadrant C | 3,687,133 | 812,746 |
| Events in quadrant D | 5,075,483 | 776,999 |
| Mode SS | |||
|---|---|---|---|
| Quadrant | BADHDUFLAG | Total packets | Discarded packets |
| A | 0 | 132 | 0 |
| B | 0 | 132 | 0 |
| C | 0 | 132 | 0 |
| D | 0 | 132 | 0 |
| Mode M9 | |||
|---|---|---|---|
| Quadrant | BADHDUFLAG | Total packets | Discarded packets |
| A | 0 | 15 | 0 |
| B | 0 | 16 | 0 |
| C | 0 | 16 | 0 |
| D | 0 | 16 | 0 |
| Mode M0 | |||
|---|---|---|---|
| Quadrant | BADHDUFLAG | Total packets | Discarded packets |
| A | 0 | 14828 | 2 |
| B | 0 | 14835 | 2 |
| C | 0 | 15170 | 2 |
| D | 0 | 19294 | 2 |
| Quadrant | Total seconds | Saturated seconds | Saturation percentage |
|---|---|---|---|
| A | 6504 | 120 | 1.845018% |
| B | 6504 | 112 | 1.722017% |
| C | 6504 | 134 | 2.060271% |
| D | 6504 | 372 | 5.719557% |
Noise dominated data is calculated using 1-second bins in cleaned event files. If a bin has >2000 counts, and if more than 50% of those come from <1% of pixels, then it is considered to be noise-dominated and hence unusable.
| Quadrant | # 1 sec bins | Bins with >0 counts | Bins with >2000 counts | High rate bins dominated by noise | Noise dominated (total time) | Noise dominated (detector-on time) | Marked lightcurve |
|---|---|---|---|---|---|---|---|
| A | 7794 | 6505 | 22 | 22 | 0.28% | 0.34% | 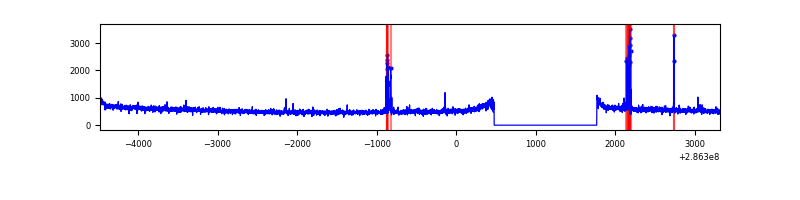 |
| B | 7794 | 6505 | 13 | 13 | 0.17% | 0.20% | 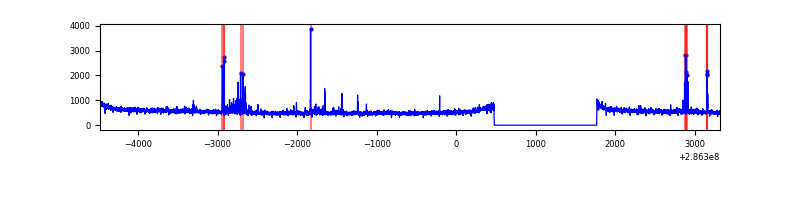 |
| C | 7794 | 6505 | 0 | 0 | 0.00% | 0.00% | 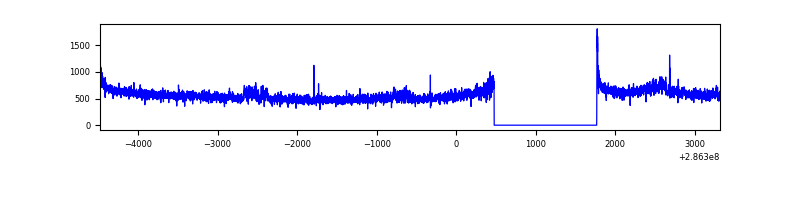 |
| D | 7794 | 6505 | 228 | 228 | 2.93% | 3.50% | 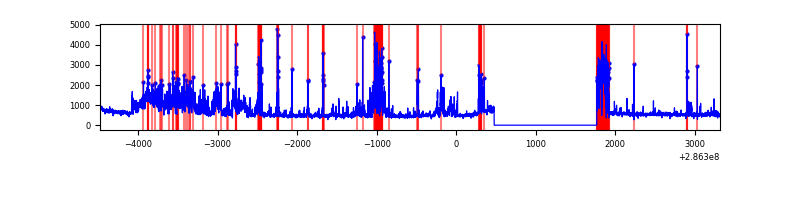 |
Top three noisy pixels from each quadrant. If the there are fewer than three noisy pixels in the level2.evt file, extra rows are filled as -1
| Pixel properties | Quadrant properties | ||||||
|---|---|---|---|---|---|---|---|
| Quadrant | DetID | PixID | Counts | Sigma | Mean | Median | Sigma |
| A | 4 | 2 | 102613 | 562.34 | 907 | 894 | 180.9 |
| A | 15 | 174 | 34694 | 186.86 | 907 | 894 | 180.9 |
| A | 0 | 226 | 7855 | 38.48 | 907 | 894 | 180.9 |
| B | 7 | 220 | 77542 | 457.22 | 892 | 874 | 167.7 |
| B | 5 | 172 | 29340 | 169.76 | 892 | 874 | 167.7 |
| B | 12 | 111 | 18434 | 104.72 | 892 | 874 | 167.7 |
| C | 3 | 233 | 209262 | 1072.45 | 842 | 852 | 194.3 |
| C | 14 | 238 | 134616 | 688.33 | 842 | 852 | 194.3 |
| C | 0 | 207 | 46773 | 236.3 | 842 | 852 | 194.3 |
| D | 5 | 222 | 975271 | 4688.99 | 852 | 832 | 207.8 |
| D | 9 | 68 | 442121 | 2123.48 | 852 | 832 | 207.8 |
| D | 9 | 64 | 180360 | 863.89 | 852 | 832 | 207.8 |
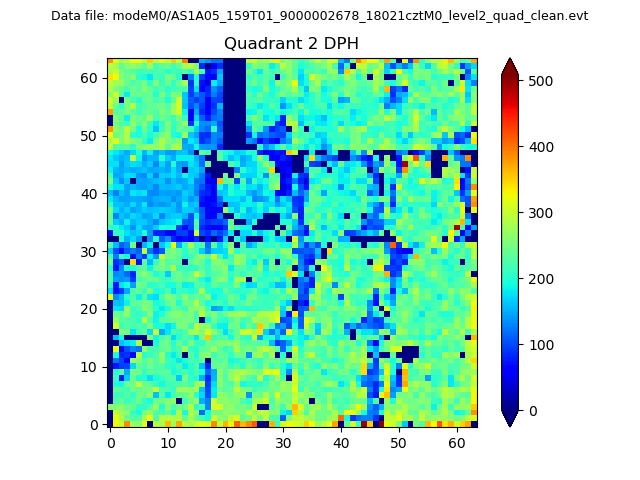
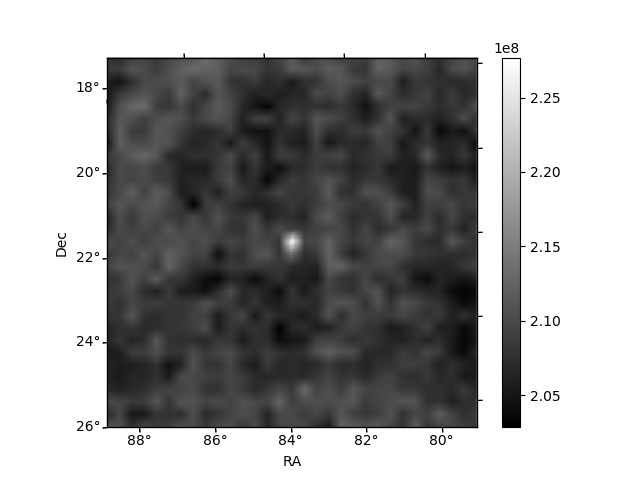
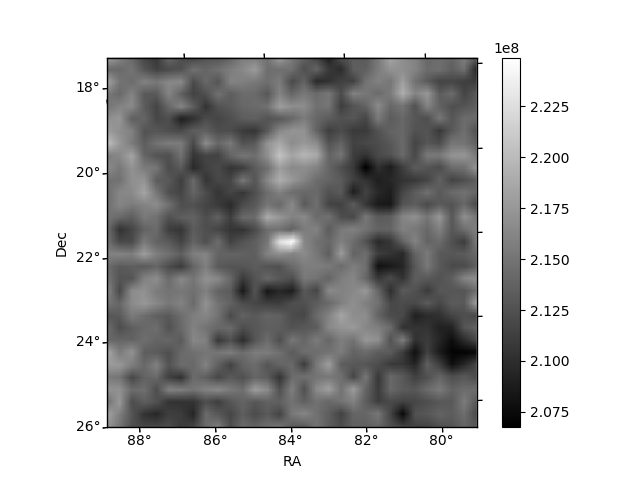
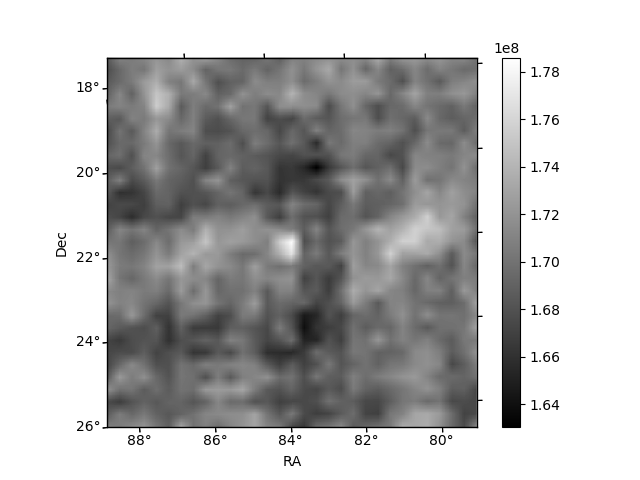
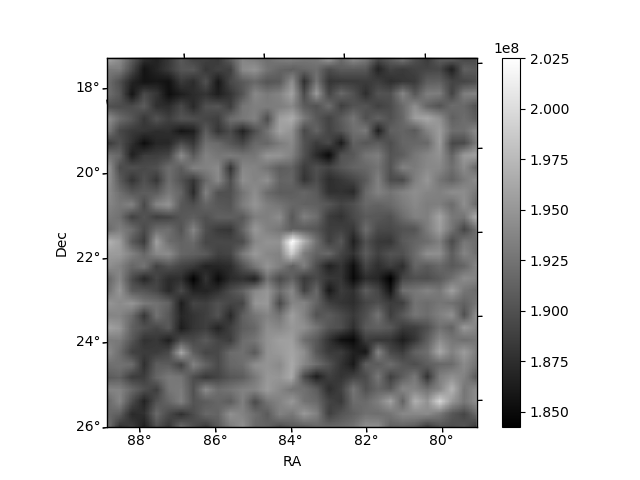
Histogram calculated using DETX and DETY for each event in the final _common_clean file
| Quadrant A |  |
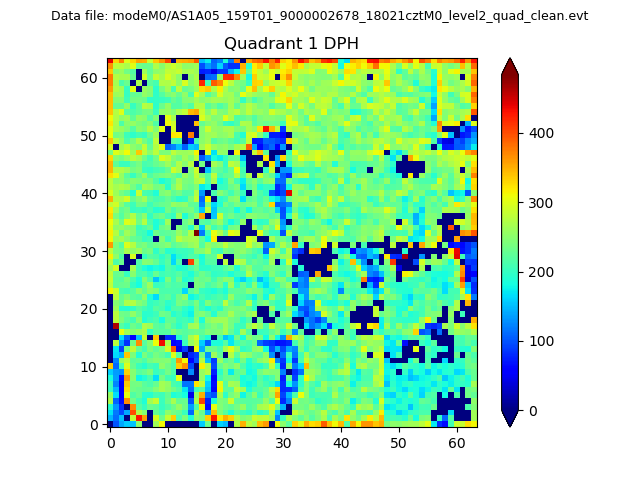 |
Quadrant B |
|---|---|---|---|
| Quadrant D | 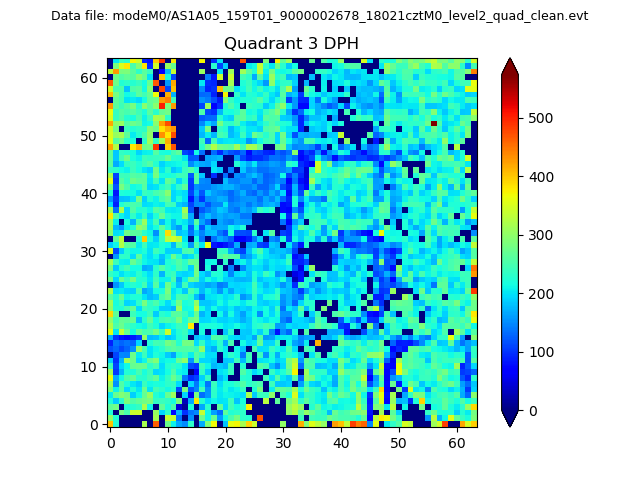 |
 |
Quadrant C |
| Plot type | Count rate plots | Images |
|---|---|---|
| Comparison with Poisson distribution Blue bars denote a histogram of data divided into 1 sec bins. Red curve is a Poisson curve with rate = median count rate of data. |
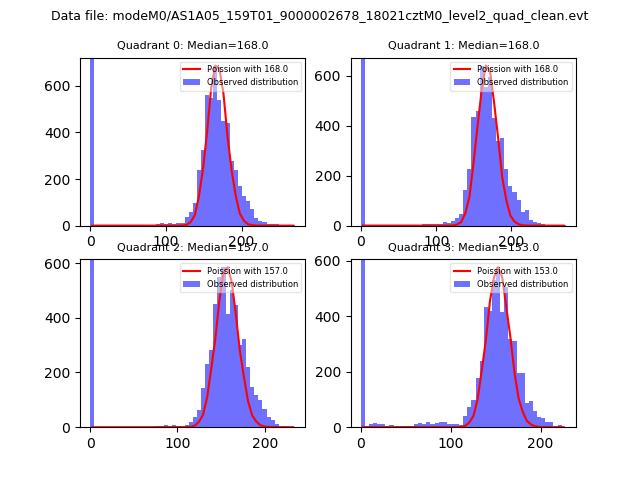 |
 |
| Quadrant-wise count rates Data is divided into 100 sec bins |
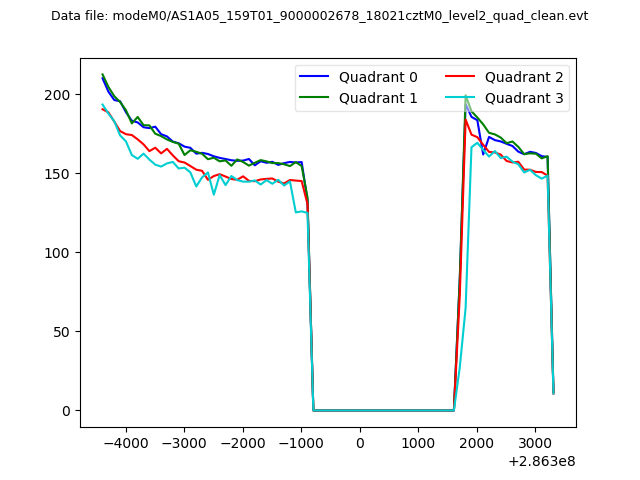 |
|
| Module-wise count rates for Quadrant A Data is divided into 100 sec bins |
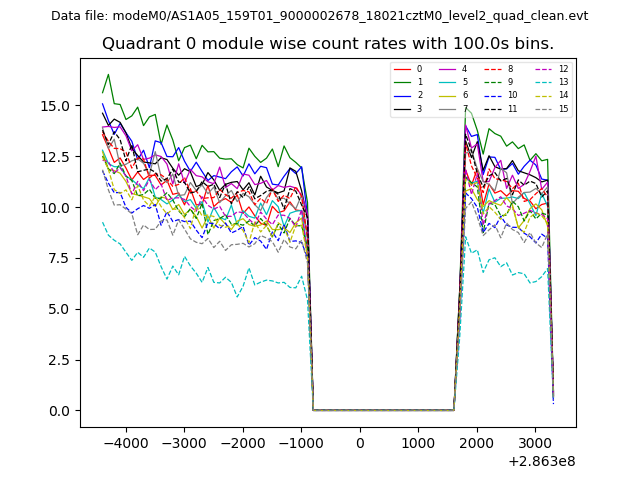 |
 |
| Module-wise count rates for Quadrant B Data is divided into 100 sec bins |
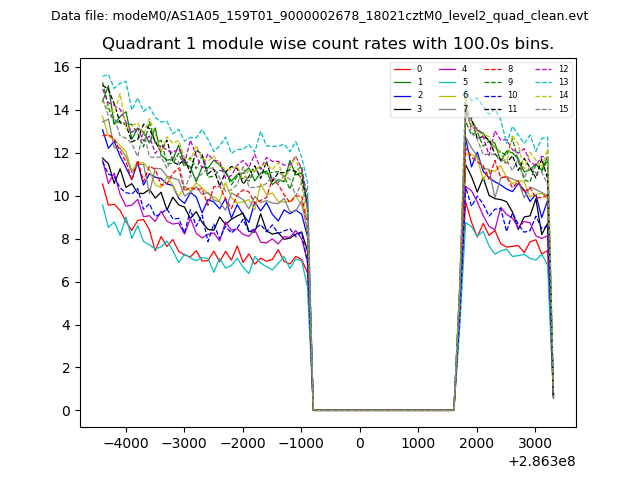 |
 |
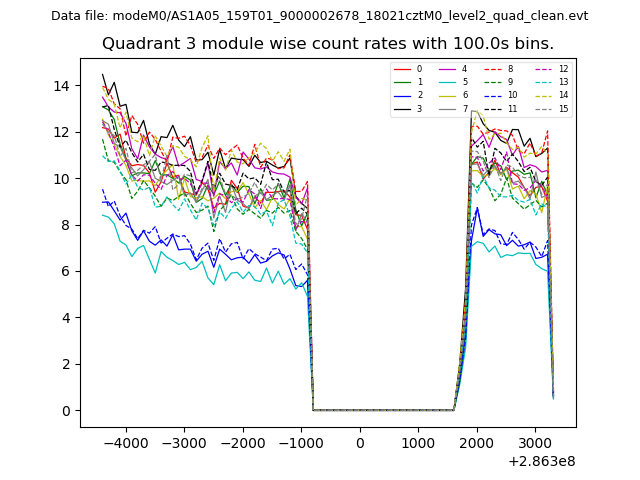
| Module-wise count rates for Quadrant C Data is divided into 100 sec bins |
 |
 |
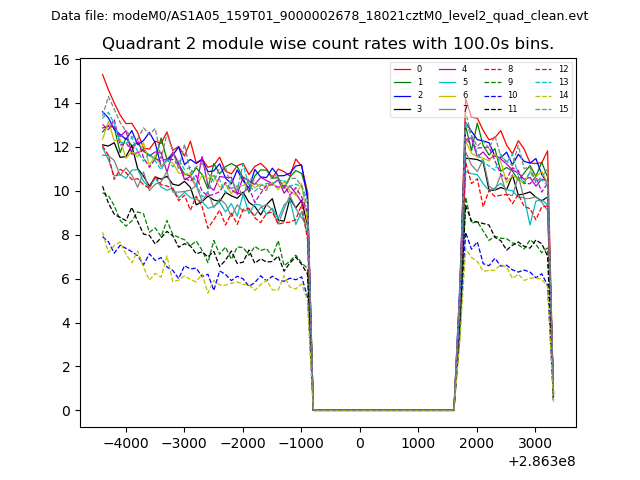
| Module-wise count rates for Quadrant D Data is divided into 100 sec bins |
 |
 |
| Parameter | Plot |
|---|---|
| CZT HV Monitor | 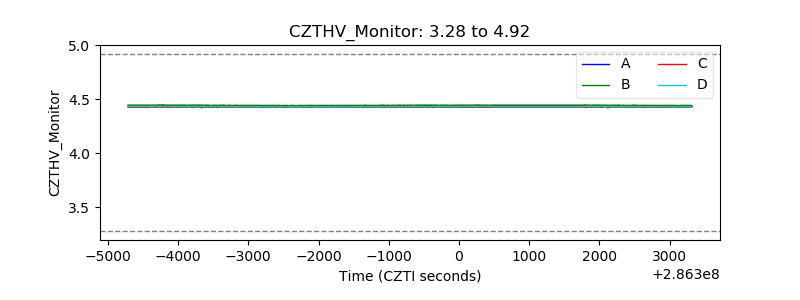 |
| D_VDD | 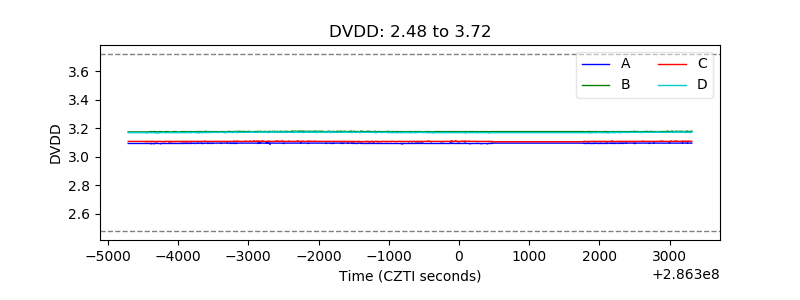 |
| Temperature 1 | 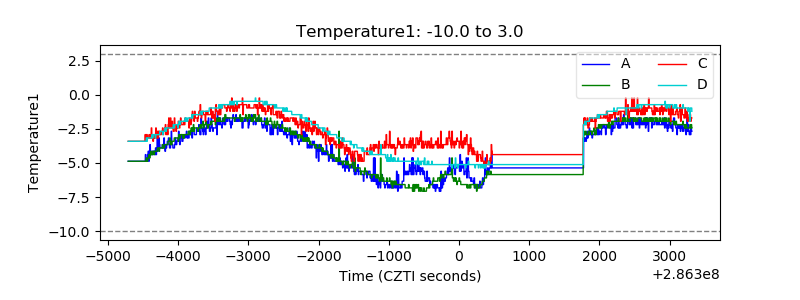 |
| Veto HV Monitor | 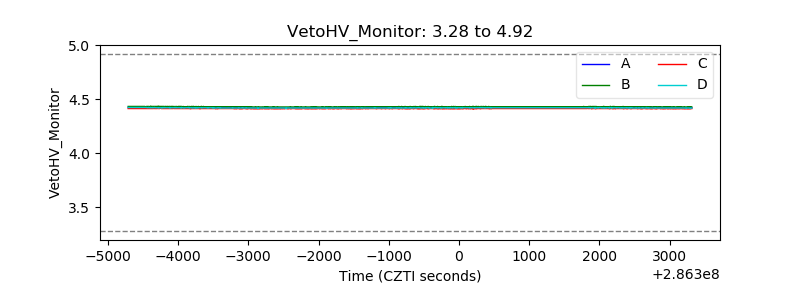 |
| Veto LLD | 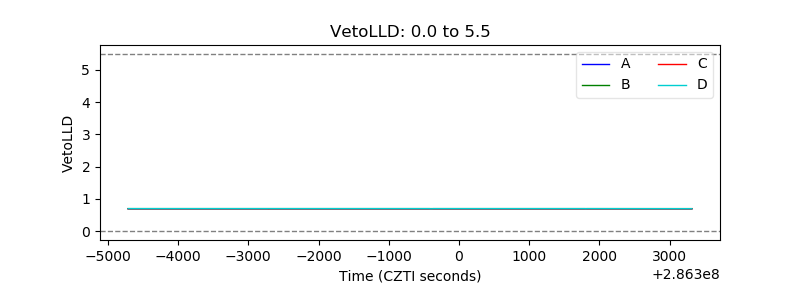 |
| Alpha Counter | 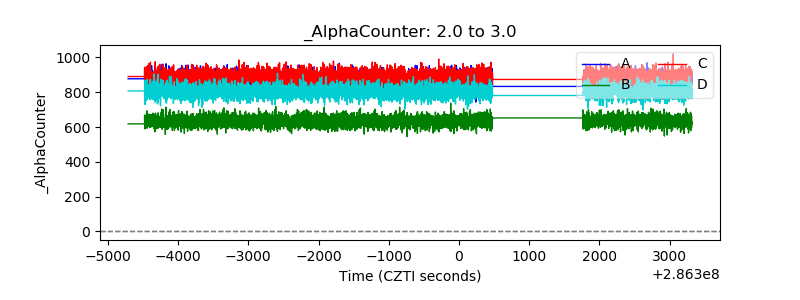 |
| _CPM_Rate | 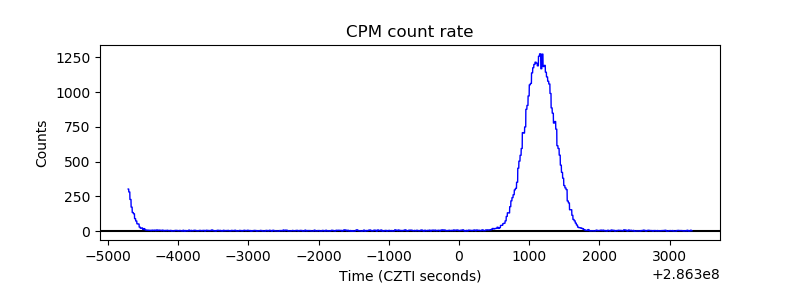 |
| CZT Counter | 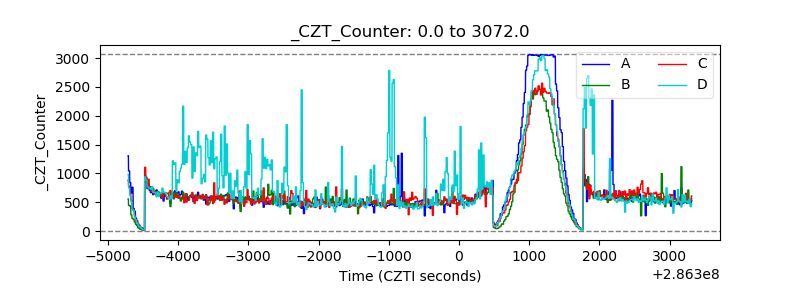 |
| +2.5 Volts monitor | 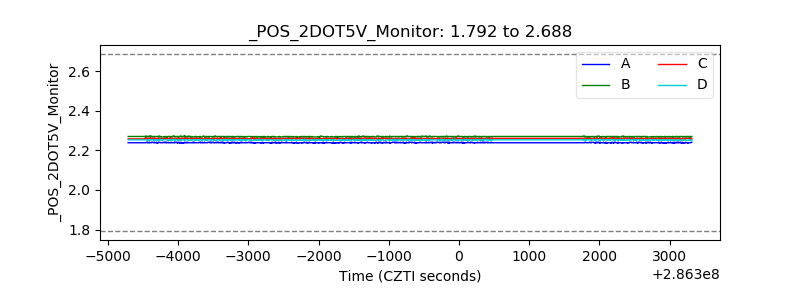 |
| +5 Volts monitor |  |
| _ROLL_ROT | 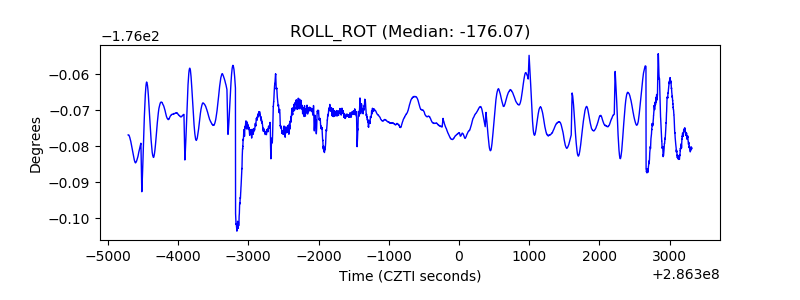 |
| _Roll_DEC | 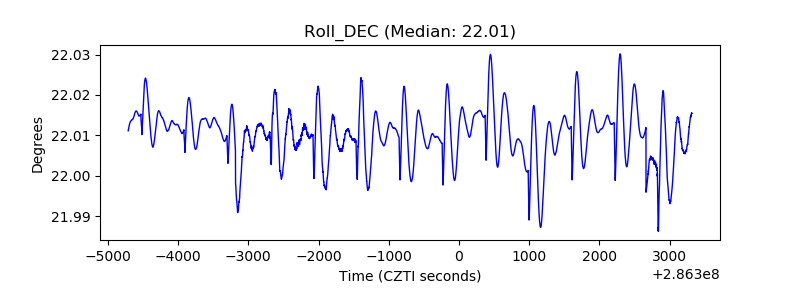 |
| _Roll_RA | 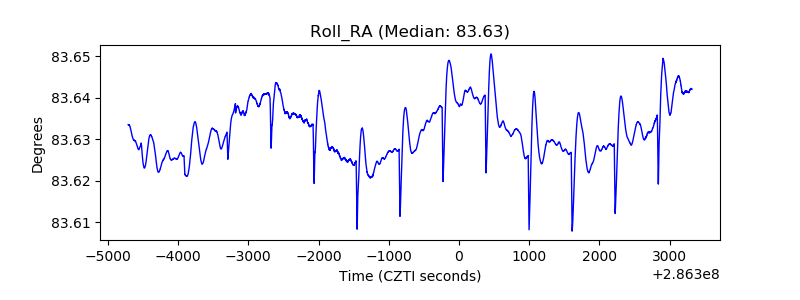 |
| Veto Counter | 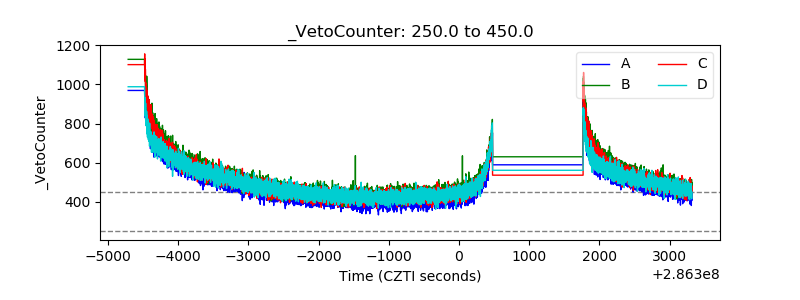 |