| Param | Original file | Final file |
|---|---|---|
| Filename | modeM0/AS1A05_159T01_9000002678_18022cztM0_level2.evt | modeM0/AS1A05_159T01_9000002678_18022cztM0_level2_quad_clean.evt |
| Size (bytes) | 498,553,920 | 105,972,480 |
| Size | 475.5 MB | 101.1 MB |
| Events in quadrant A | 3,390,893 | 718,680 |
| Events in quadrant B | 3,433,465 | 715,987 |
| Events in quadrant C | 3,558,040 | 674,423 |
| Events in quadrant D | 4,287,776 | 659,434 |
| Mode SS | |||
|---|---|---|---|
| Quadrant | BADHDUFLAG | Total packets | Discarded packets |
| A | 0 | 128 | 0 |
| B | 0 | 128 | 0 |
| C | 0 | 128 | 0 |
| D | 0 | 128 | 0 |
| Mode M9 | |||
|---|---|---|---|
| Quadrant | BADHDUFLAG | Total packets | Discarded packets |
| A | 0 | 12 | 0 |
| B | 0 | 12 | 0 |
| C | 0 | 12 | 0 |
| D | 0 | 12 | 0 |
| Mode M0 | |||
|---|---|---|---|
| Quadrant | BADHDUFLAG | Total packets | Discarded packets |
| A | 0 | 13853 | 1 |
| B | 0 | 13926 | 1 |
| C | 0 | 14584 | 1 |
| D | 0 | 16772 | 1 |
| Quadrant | Total seconds | Saturated seconds | Saturation percentage |
|---|---|---|---|
| A | 6318 | 91 | 1.440329% |
| B | 6319 | 124 | 1.962336% |
| C | 6319 | 107 | 1.693306% |
| D | 6319 | 272 | 4.304479% |
Noise dominated data is calculated using 1-second bins in cleaned event files. If a bin has >2000 counts, and if more than 50% of those come from <1% of pixels, then it is considered to be noise-dominated and hence unusable.
| Quadrant | # 1 sec bins | Bins with >0 counts | Bins with >2000 counts | High rate bins dominated by noise | Noise dominated (total time) | Noise dominated (detector-on time) | Marked lightcurve |
|---|---|---|---|---|---|---|---|
| A | 7488 | 6319 | 18 | 18 | 0.24% | 0.28% | 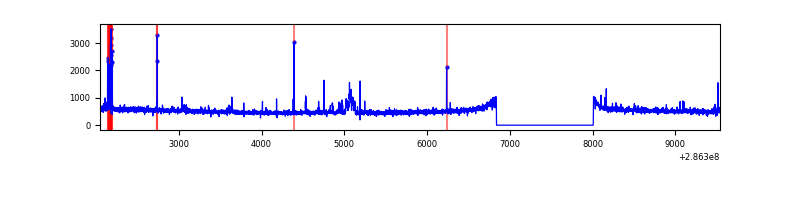 |
| B | 7489 | 6320 | 37 | 37 | 0.49% | 0.59% | 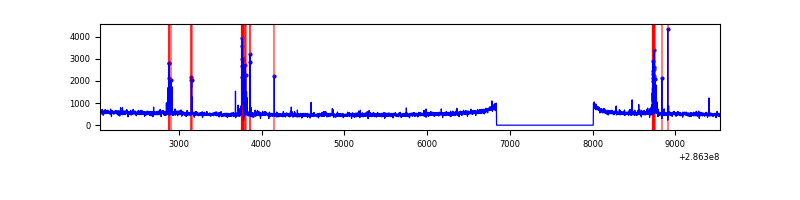 |
| C | 7489 | 6320 | 0 | 0 | 0.00% | 0.00% | 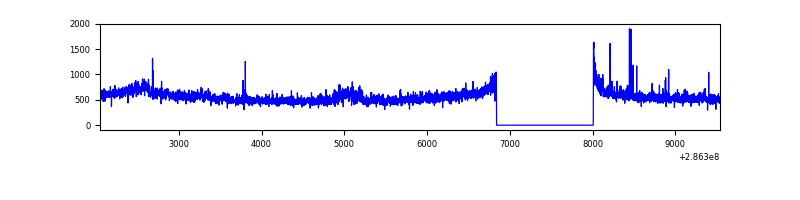 |
| D | 7489 | 6320 | 179 | 179 | 2.39% | 2.83% | 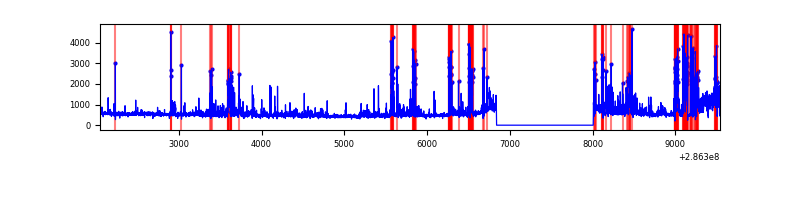 |
Top three noisy pixels from each quadrant. If the there are fewer than three noisy pixels in the level2.evt file, extra rows are filled as -1
| Pixel properties | Quadrant properties | ||||||
|---|---|---|---|---|---|---|---|
| Quadrant | DetID | PixID | Counts | Sigma | Mean | Median | Sigma |
| A | 4 | 2 | 107044 | 631.24 | 833 | 820 | 168.3 |
| A | 15 | 174 | 84283 | 495.98 | 833 | 820 | 168.3 |
| A | 0 | 226 | 7371 | 38.93 | 833 | 820 | 168.3 |
| B | 7 | 220 | 140142 | 898.08 | 821 | 805 | 155.1 |
| B | 5 | 172 | 26376 | 164.82 | 821 | 805 | 155.1 |
| B | 0 | 229 | 17409 | 107.02 | 821 | 805 | 155.1 |
| C | 3 | 233 | 267541 | 1455.53 | 784 | 793 | 183.3 |
| C | 14 | 238 | 123534 | 669.75 | 784 | 793 | 183.3 |
| C | 0 | 207 | 92359 | 499.64 | 784 | 793 | 183.3 |
| D | 5 | 222 | 547626 | 2860.75 | 794 | 773 | 191.2 |
| D | 11 | 176 | 509763 | 2662.67 | 794 | 773 | 191.2 |
| D | 7 | 38 | 89987 | 466.7 | 794 | 773 | 191.2 |
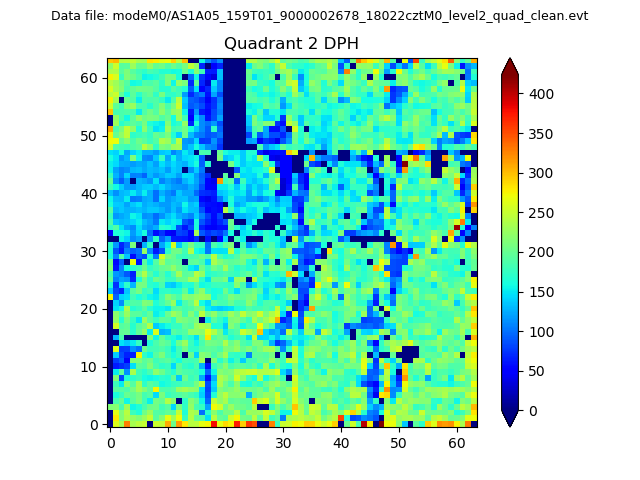
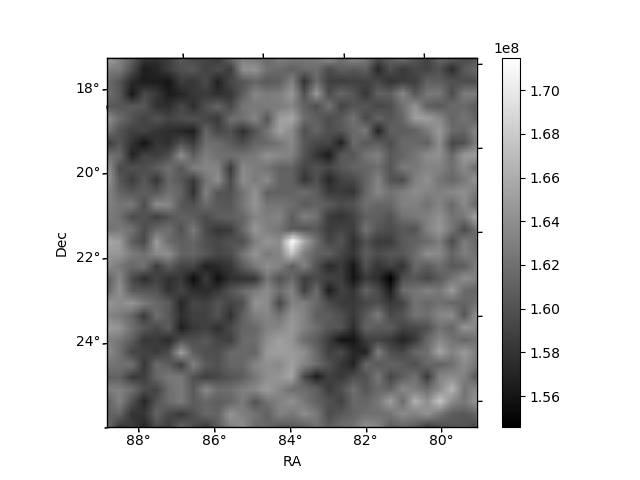
Histogram calculated using DETX and DETY for each event in the final _common_clean file
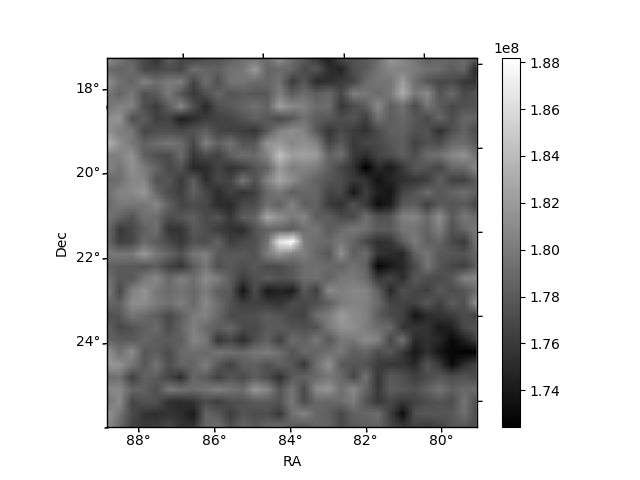
| Quadrant A | 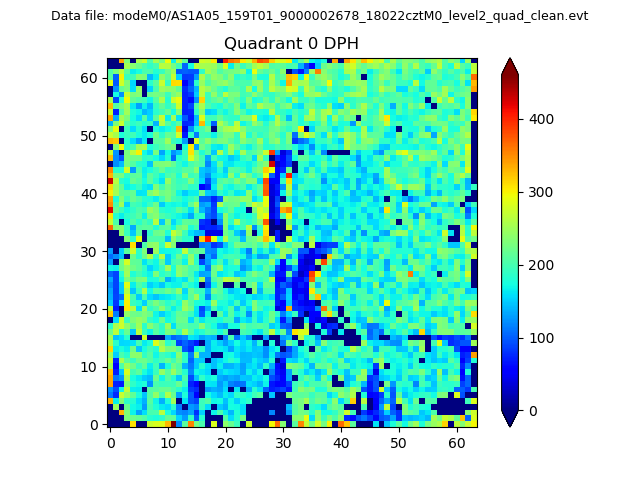 |
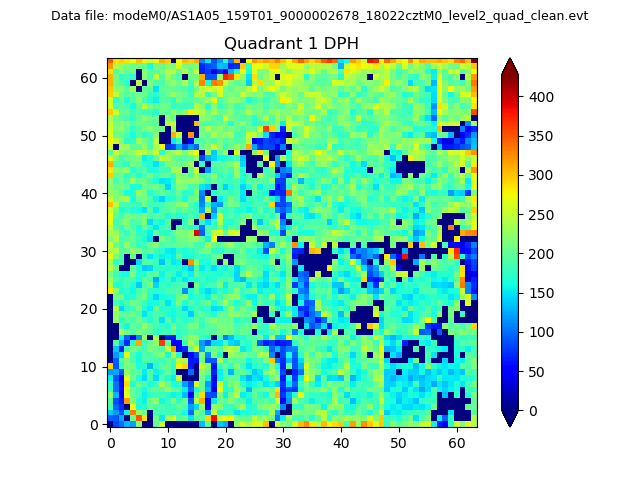 |
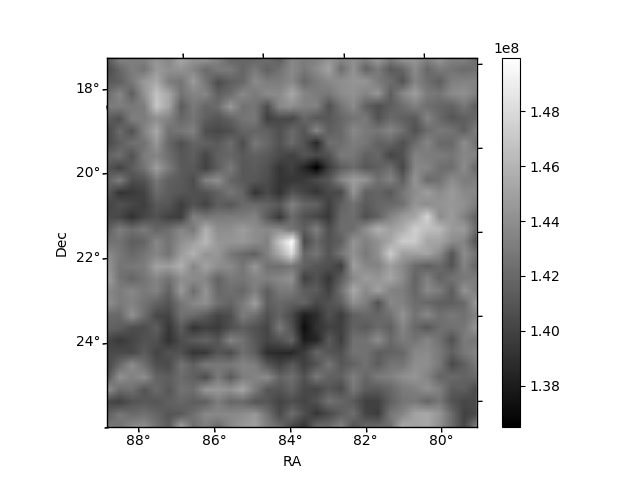
Quadrant B |
|---|---|---|---|
| Quadrant D | 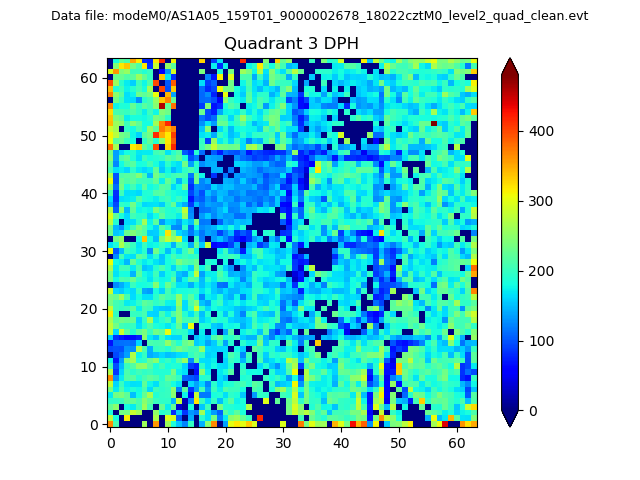 |
 |
Quadrant C |
| Plot type | Count rate plots | Images |
|---|---|---|
| Comparison with Poisson distribution Blue bars denote a histogram of data divided into 1 sec bins. Red curve is a Poisson curve with rate = median count rate of data. |
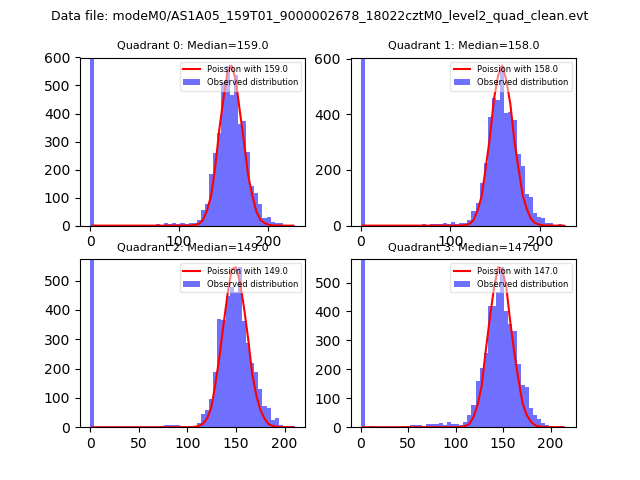 |
 |
| Quadrant-wise count rates Data is divided into 100 sec bins |
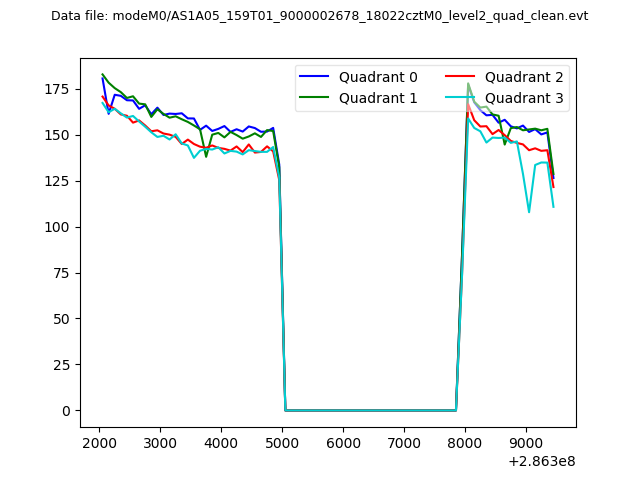 |
|
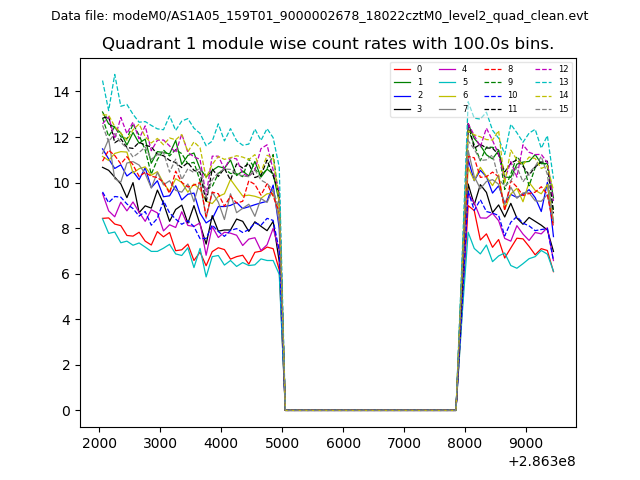
| Module-wise count rates for Quadrant A Data is divided into 100 sec bins |
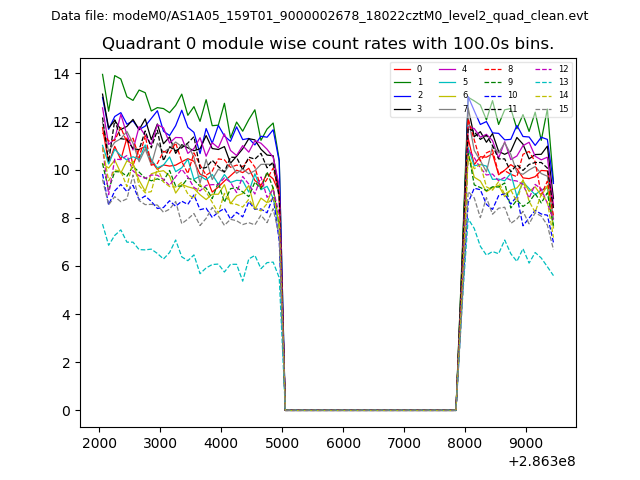 |
 |
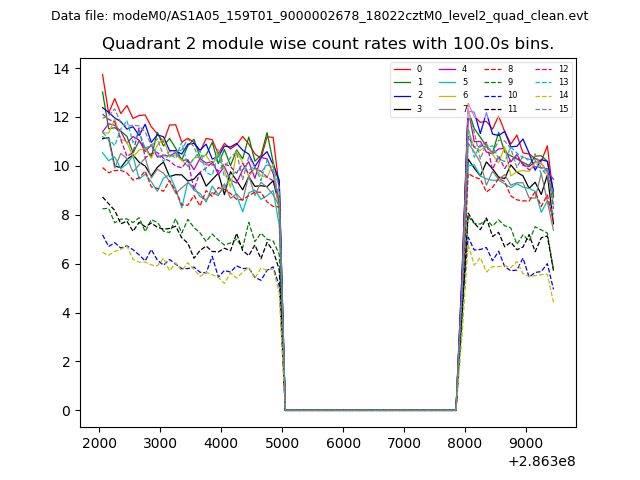
| Module-wise count rates for Quadrant B Data is divided into 100 sec bins |
 |
 |
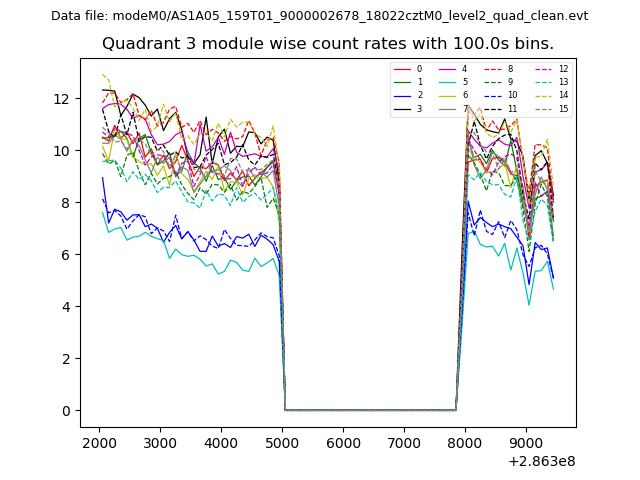
| Module-wise count rates for Quadrant C Data is divided into 100 sec bins |
 |
 |
| Module-wise count rates for Quadrant D Data is divided into 100 sec bins |
 |
 |
| Parameter | Plot |
|---|---|
| CZT HV Monitor | 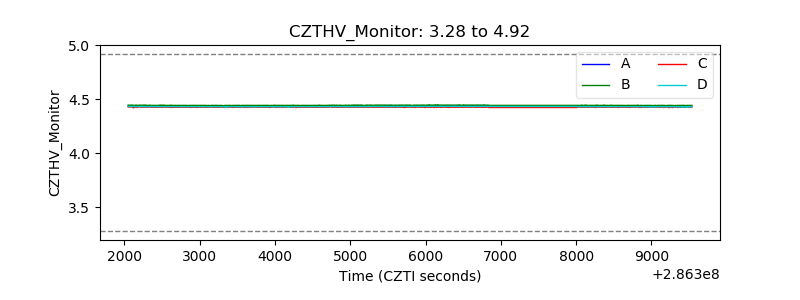 |
| D_VDD | 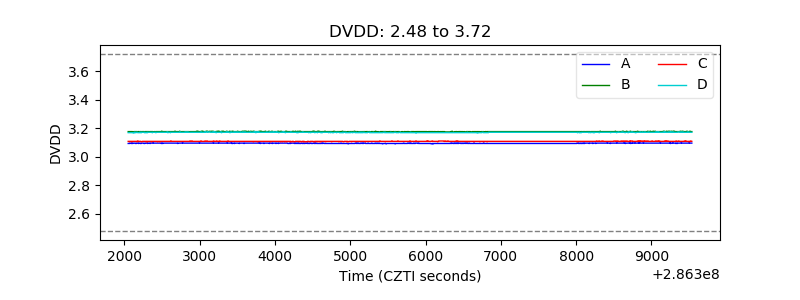 |
| Temperature 1 | 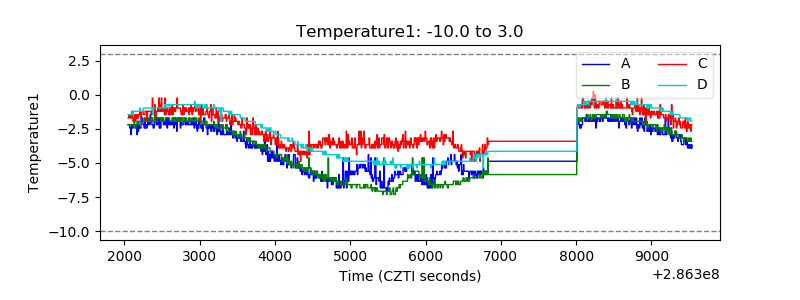 |
| Veto HV Monitor | 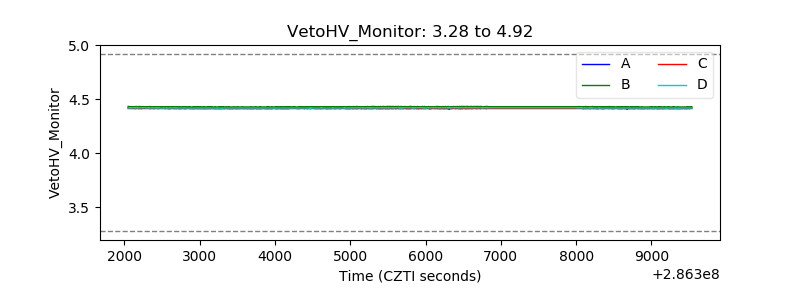 |
| Veto LLD | 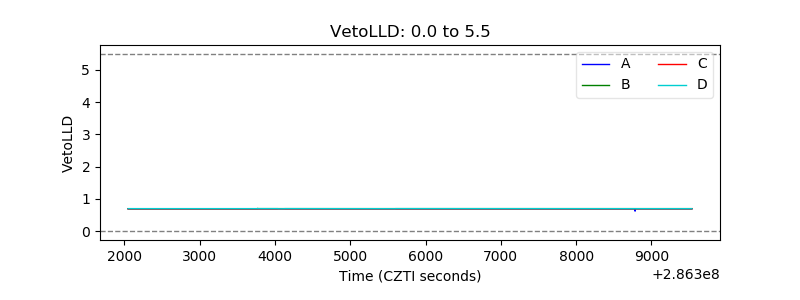 |
| Alpha Counter | 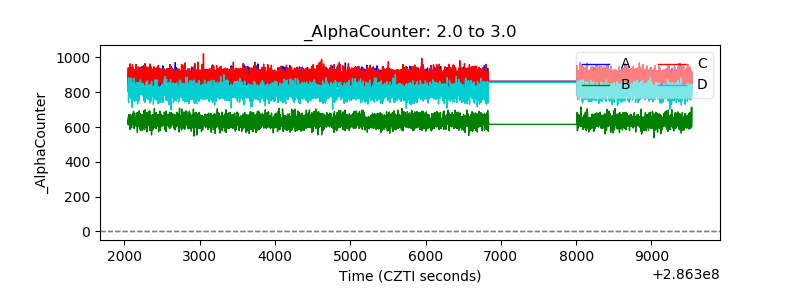 |
| _CPM_Rate | 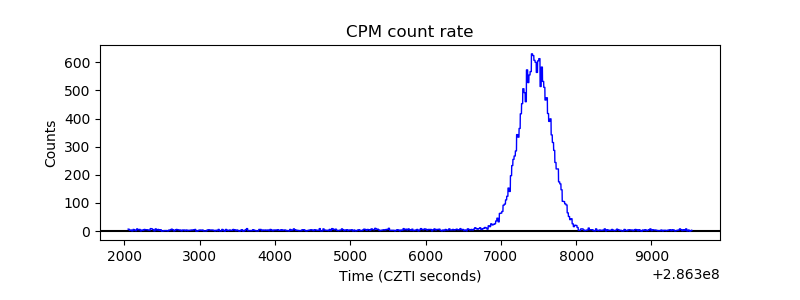 |
| CZT Counter | 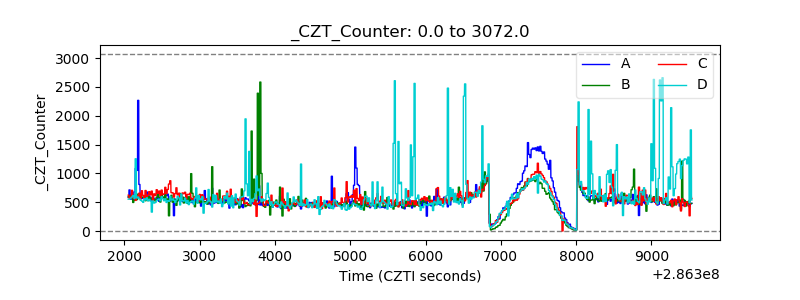 |
| +2.5 Volts monitor |  |
| +5 Volts monitor | 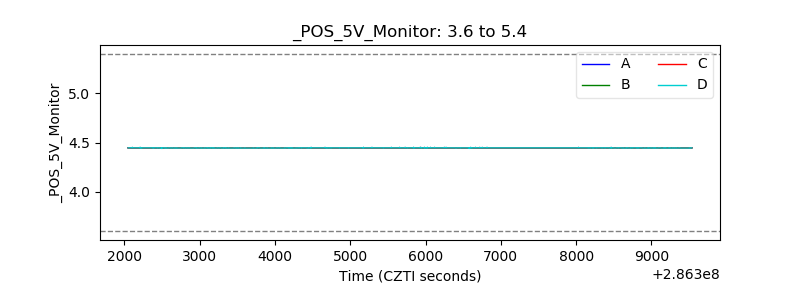 |
| _ROLL_ROT | 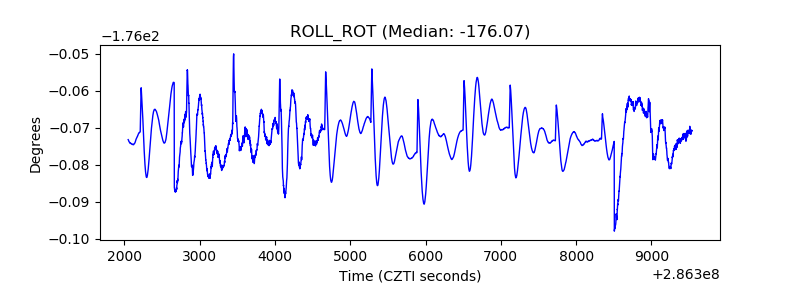 |
| _Roll_DEC | 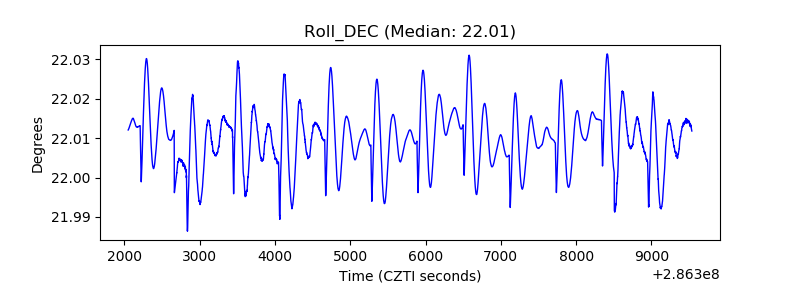 |
| _Roll_RA | 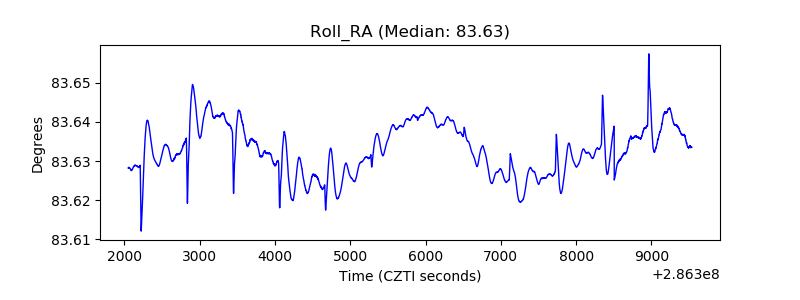 |
| Veto Counter | 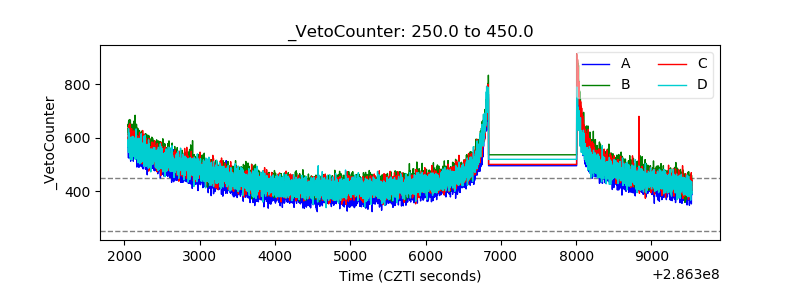 |