| Param | Original file | Final file |
|---|---|---|
| Filename | modeM0/AS1A05_159T01_9000002678_18023cztM0_level2.evt | modeM0/AS1A05_159T01_9000002678_18023cztM0_level2_quad_clean.evt |
| Size (bytes) | 524,874,240 | 103,936,320 |
| Size | 500.6 MB | 99.1 MB |
| Events in quadrant A | 3,493,169 | 690,799 |
| Events in quadrant B | 3,752,688 | 688,104 |
| Events in quadrant C | 3,714,435 | 656,457 |
| Events in quadrant D | 4,472,587 | 636,663 |
| Mode SS | |||
|---|---|---|---|
| Quadrant | BADHDUFLAG | Total packets | Discarded packets |
| A | 0 | 138 | 0 |
| B | 0 | 138 | 0 |
| C | 0 | 138 | 0 |
| D | 0 | 138 | 0 |
| Mode M9 | |||
|---|---|---|---|
| Quadrant | BADHDUFLAG | Total packets | Discarded packets |
| A | 0 | 9 | 0 |
| B | 0 | 9 | 0 |
| C | 0 | 9 | 0 |
| D | 0 | 9 | 0 |
| Mode M0 | |||
|---|---|---|---|
| Quadrant | BADHDUFLAG | Total packets | Discarded packets |
| A | 0 | 14667 | 2 |
| B | 0 | 15377 | 2 |
| C | 0 | 15305 | 2 |
| D | 0 | 17866 | 2 |
| Quadrant | Total seconds | Saturated seconds | Saturation percentage |
|---|---|---|---|
| A | 6827 | 80 | 1.171818% |
| B | 6828 | 131 | 1.918571% |
| C | 6828 | 102 | 1.493849% |
| D | 6828 | 191 | 2.797305% |
Noise dominated data is calculated using 1-second bins in cleaned event files. If a bin has >2000 counts, and if more than 50% of those come from <1% of pixels, then it is considered to be noise-dominated and hence unusable.
| Quadrant | # 1 sec bins | Bins with >0 counts | Bins with >2000 counts | High rate bins dominated by noise | Noise dominated (total time) | Noise dominated (detector-on time) | Marked lightcurve |
|---|---|---|---|---|---|---|---|
| A | 7752 | 6828 | 21 | 21 | 0.27% | 0.31% | 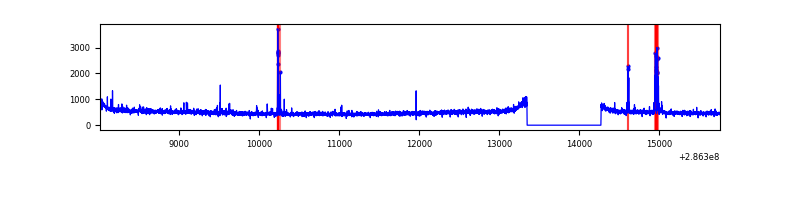 |
| B | 7753 | 6829 | 45 | 45 | 0.58% | 0.66% | 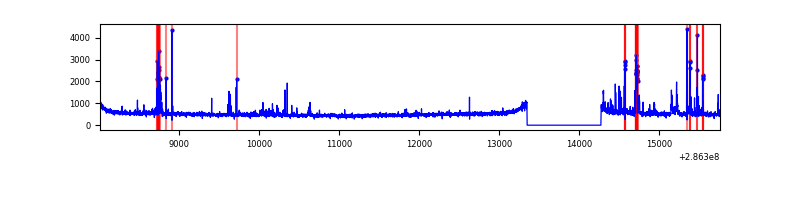 |
| C | 7753 | 6829 | 0 | 0 | 0.00% | 0.00% | 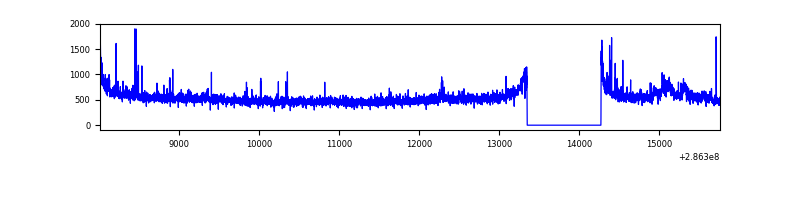 |
| D | 7753 | 6829 | 123 | 123 | 1.59% | 1.80% | 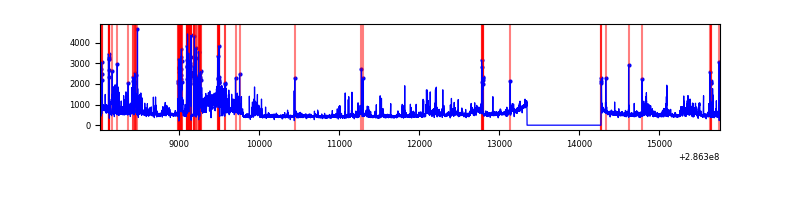 |
Top three noisy pixels from each quadrant. If the there are fewer than three noisy pixels in the level2.evt file, extra rows are filled as -1
| Pixel properties | Quadrant properties | ||||||
|---|---|---|---|---|---|---|---|
| Quadrant | DetID | PixID | Counts | Sigma | Mean | Median | Sigma |
| A | 4 | 2 | 130976 | 738.65 | 873 | 858 | 176.2 |
| A | 15 | 174 | 7892 | 39.93 | 873 | 858 | 176.2 |
| A | 0 | 226 | 7630 | 38.44 | 873 | 858 | 176.2 |
| B | 5 | 172 | 186907 | 1111.89 | 866 | 845 | 167.3 |
| B | 7 | 220 | 82242 | 486.42 | 866 | 845 | 167.3 |
| B | 0 | 229 | 31515 | 183.28 | 866 | 845 | 167.3 |
| C | 3 | 233 | 208745 | 1071.74 | 827 | 836 | 194.0 |
| C | 14 | 238 | 127647 | 653.69 | 827 | 836 | 194.0 |
| C | 0 | 207 | 121457 | 621.79 | 827 | 836 | 194.0 |
| D | 11 | 176 | 763403 | 3703.88 | 838 | 816 | 205.9 |
| D | 5 | 222 | 349532 | 1693.71 | 838 | 816 | 205.9 |
| D | 12 | 233 | 95833 | 461.5 | 838 | 816 | 205.9 |
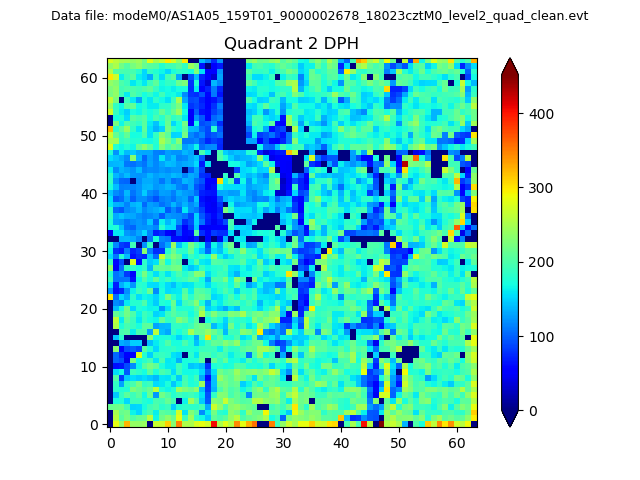
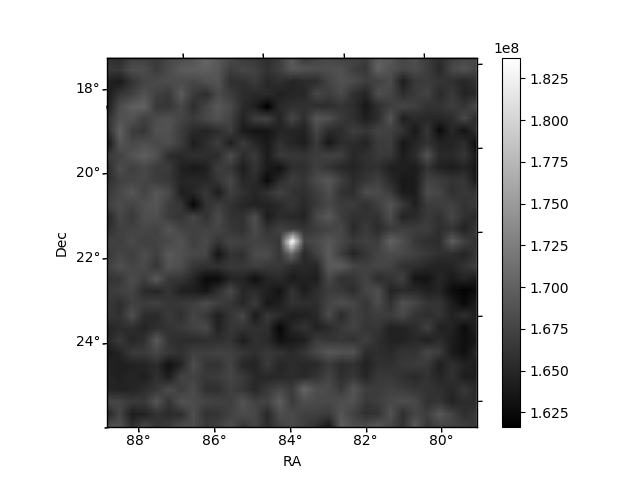
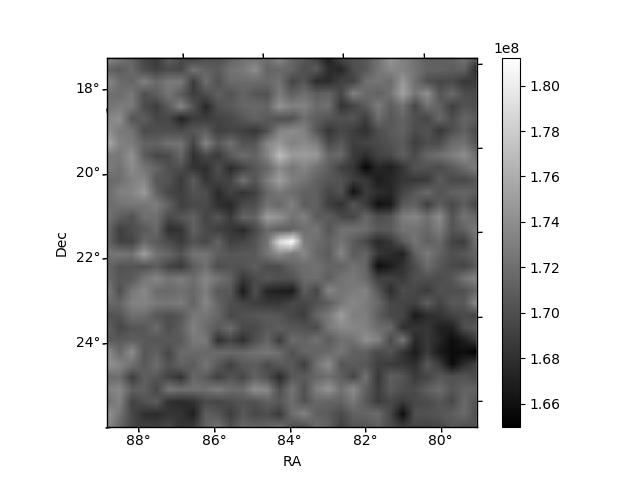
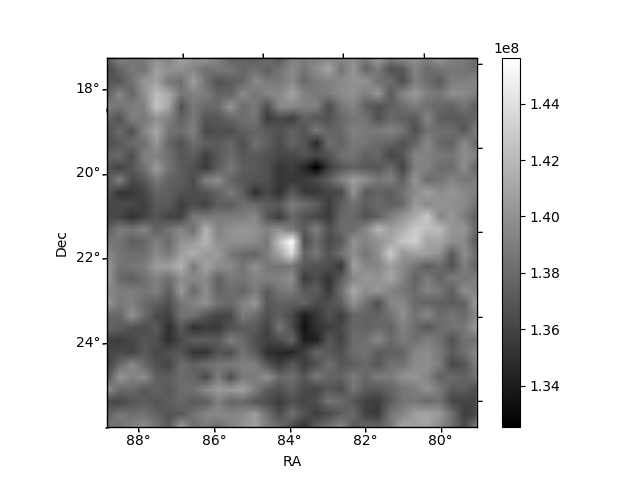
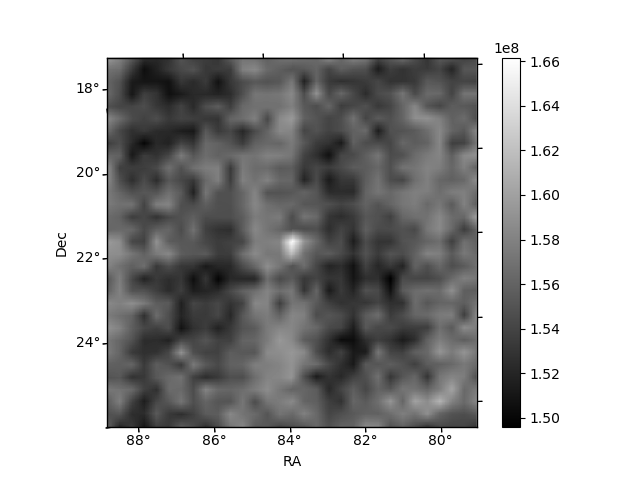
Histogram calculated using DETX and DETY for each event in the final _common_clean file
| Quadrant A |  |
 |
Quadrant B |
|---|---|---|---|
| Quadrant D | 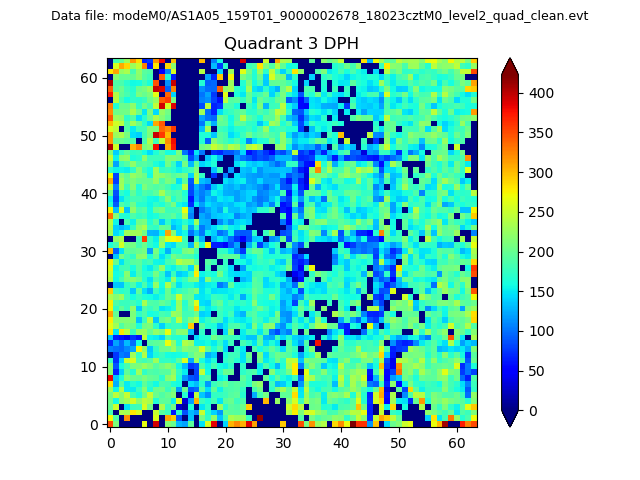 |
 |
Quadrant C |
| Plot type | Count rate plots | Images |
|---|---|---|
| Comparison with Poisson distribution Blue bars denote a histogram of data divided into 1 sec bins. Red curve is a Poisson curve with rate = median count rate of data. |
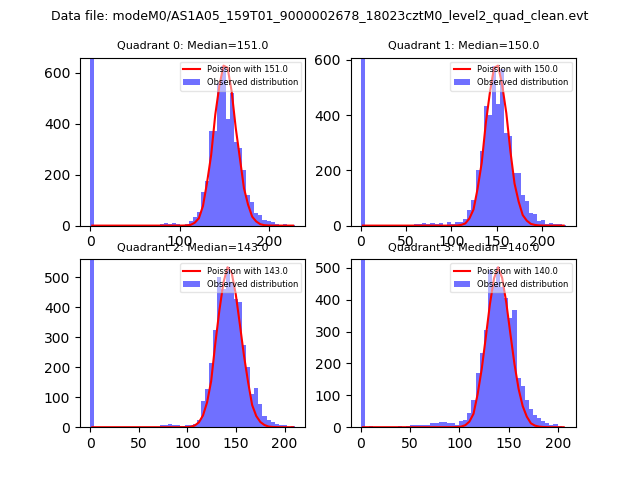 |
 |
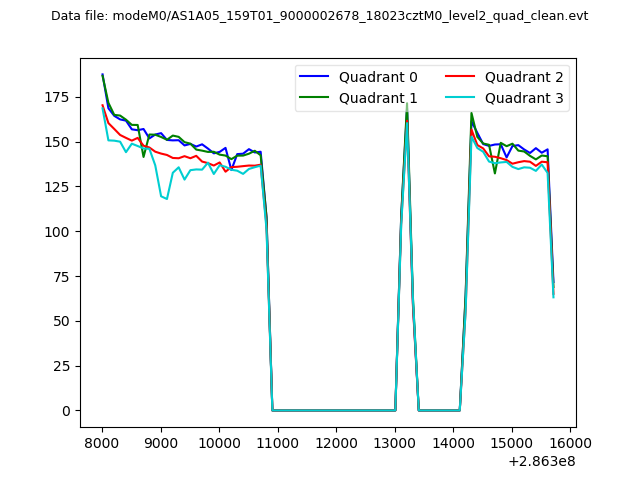
| Quadrant-wise count rates Data is divided into 100 sec bins |
 |
|
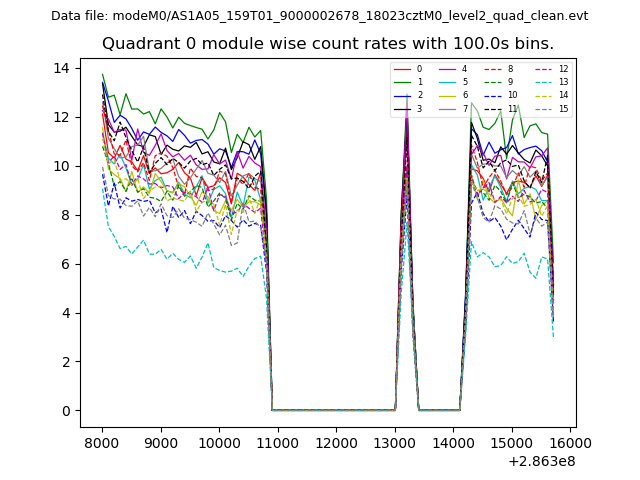
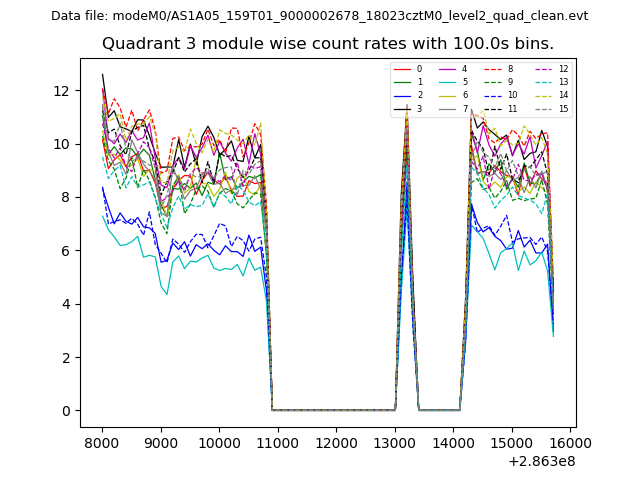
| Module-wise count rates for Quadrant A Data is divided into 100 sec bins |
 |
 |
| Module-wise count rates for Quadrant B Data is divided into 100 sec bins |
 |
 |
| Module-wise count rates for Quadrant C Data is divided into 100 sec bins |
 |
 |
| Module-wise count rates for Quadrant D Data is divided into 100 sec bins |
 |
 |
| Parameter | Plot |
|---|---|
| CZT HV Monitor |  |
| D_VDD | 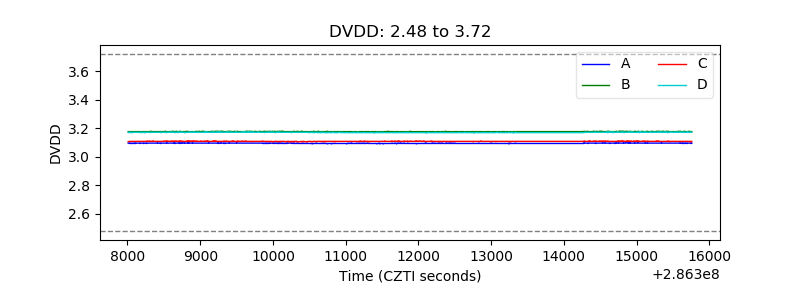 |
| Temperature 1 | 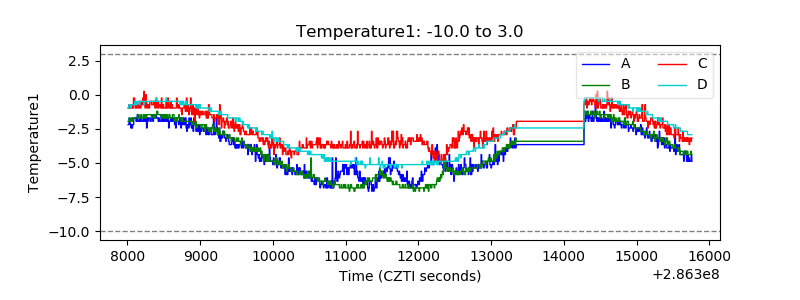 |
| Veto HV Monitor | 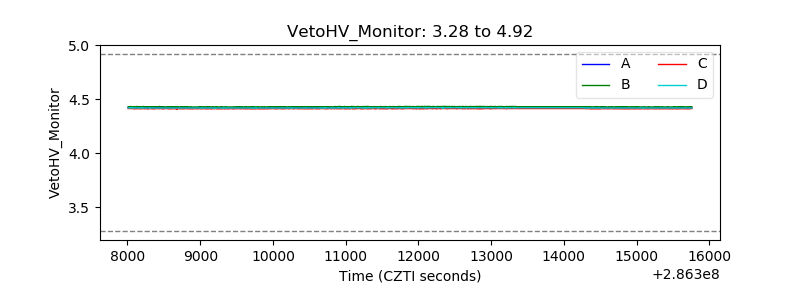 |
| Veto LLD | 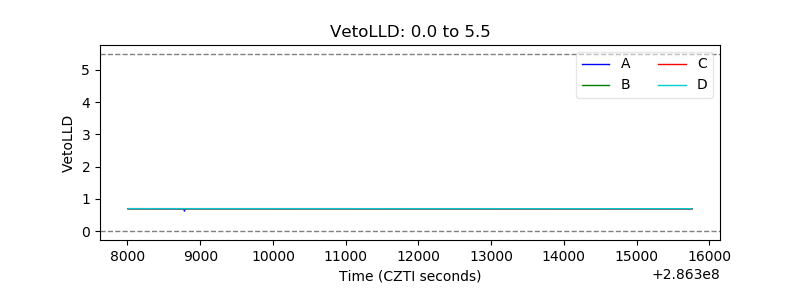 |
| Alpha Counter | 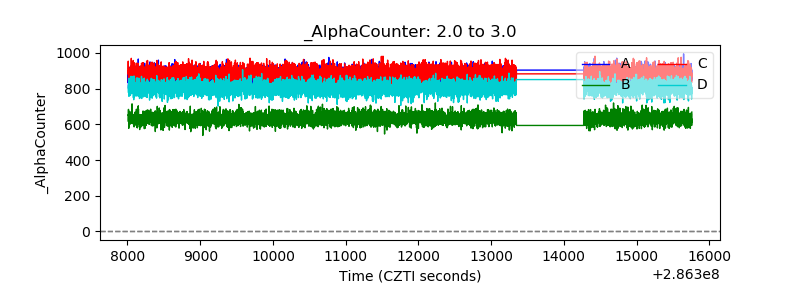 |
| _CPM_Rate | 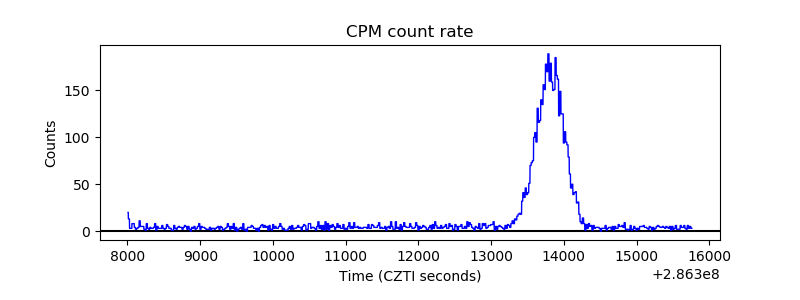 |
| CZT Counter | 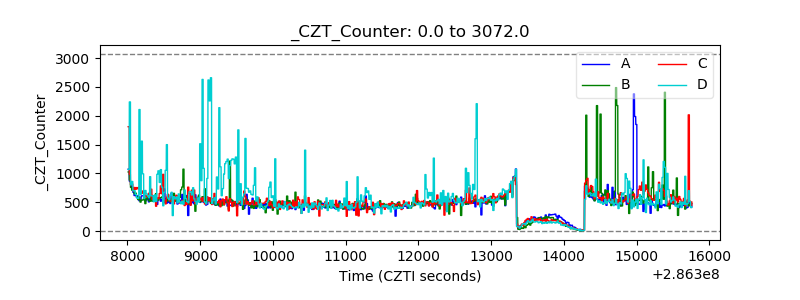 |
| +2.5 Volts monitor |  |
| +5 Volts monitor | 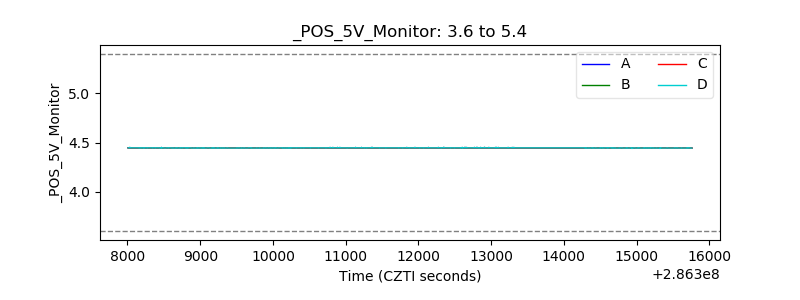 |
| _ROLL_ROT | 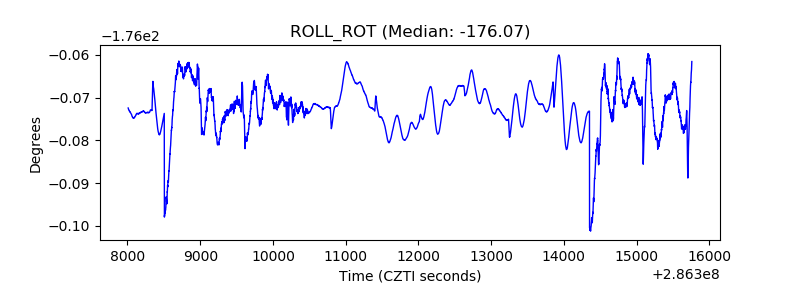 |
| _Roll_DEC | 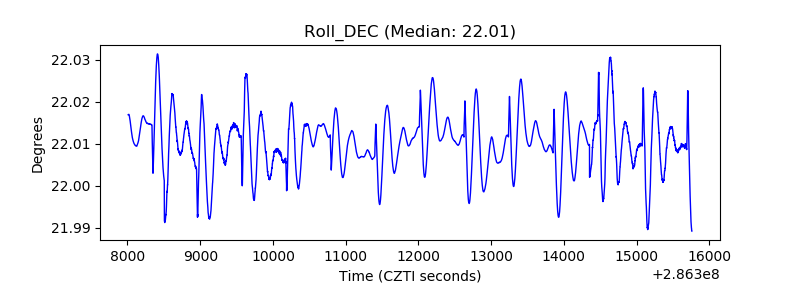 |
| _Roll_RA | 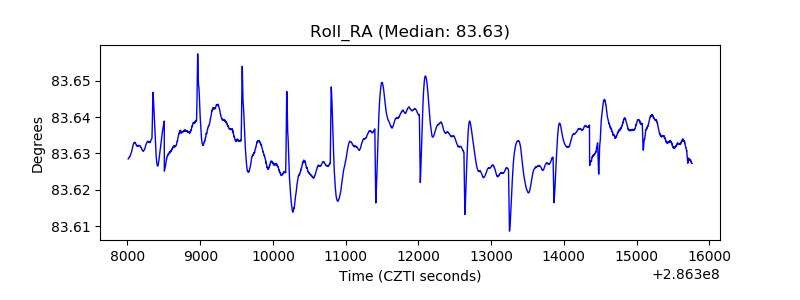 |
| Veto Counter | 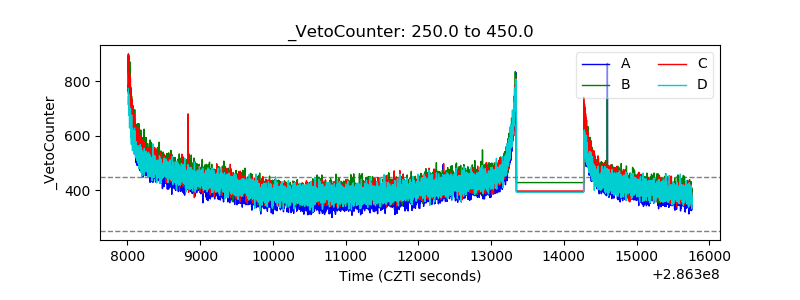 |