| Param | Original file | Final file |
|---|---|---|
| Filename | modeM0/AS1A05_159T01_9000002678_18024cztM0_level2.evt | modeM0/AS1A05_159T01_9000002678_18024cztM0_level2_quad_clean.evt |
| Size (bytes) | 532,563,840 | 107,726,400 |
| Size | 507.9 MB | 102.7 MB |
| Events in quadrant A | 3,668,795 | 711,088 |
| Events in quadrant B | 3,810,814 | 712,898 |
| Events in quadrant C | 4,257,814 | 677,922 |
| Events in quadrant D | 3,909,470 | 666,109 |
| Mode SS | |||
|---|---|---|---|
| Quadrant | BADHDUFLAG | Total packets | Discarded packets |
| A | 0 | 144 | 0 |
| B | 0 | 144 | 0 |
| C | 0 | 144 | 0 |
| D | 0 | 144 | 0 |
| Mode M9 | |||
|---|---|---|---|
| Quadrant | BADHDUFLAG | Total packets | Discarded packets |
| A | 0 | 9 | 0 |
| B | 0 | 10 | 0 |
| C | 0 | 10 | 0 |
| D | 0 | 10 | 0 |
| Mode M0 | |||
|---|---|---|---|
| Quadrant | BADHDUFLAG | Total packets | Discarded packets |
| A | 0 | 15472 | 2 |
| B | 0 | 15799 | 2 |
| C | 0 | 17357 | 2 |
| D | 0 | 16380 | 2 |
| Quadrant | Total seconds | Saturated seconds | Saturation percentage |
|---|---|---|---|
| A | 7108 | 123 | 1.730445% |
| B | 7108 | 134 | 1.885200% |
| C | 7108 | 147 | 2.068092% |
| D | 7108 | 92 | 1.294316% |
Noise dominated data is calculated using 1-second bins in cleaned event files. If a bin has >2000 counts, and if more than 50% of those come from <1% of pixels, then it is considered to be noise-dominated and hence unusable.
| Quadrant | # 1 sec bins | Bins with >0 counts | Bins with >2000 counts | High rate bins dominated by noise | Noise dominated (total time) | Noise dominated (detector-on time) | Marked lightcurve |
|---|---|---|---|---|---|---|---|
| A | 7603 | 7110 | 47 | 47 | 0.62% | 0.66% | 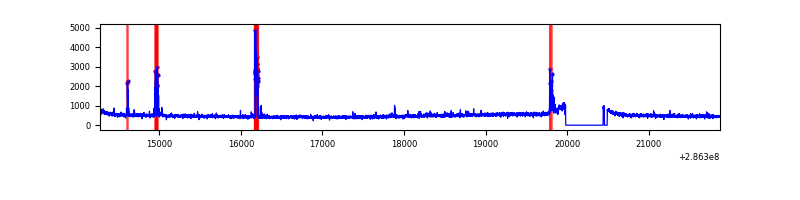 |
| B | 7603 | 7110 | 35 | 35 | 0.46% | 0.49% | 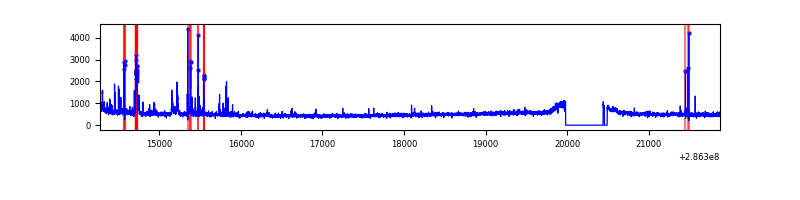 |
| C | 7603 | 7110 | 17 | 17 | 0.22% | 0.24% | 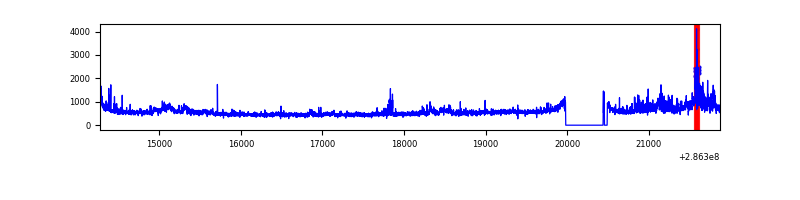 |
| D | 7603 | 7110 | 59 | 59 | 0.78% | 0.83% | 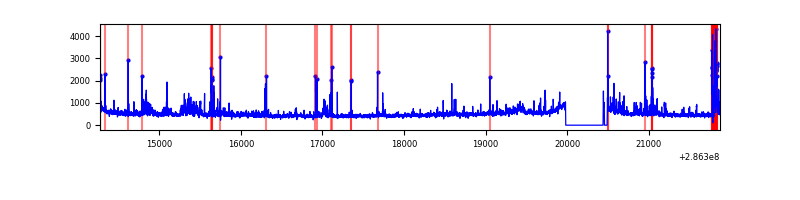 |
Top three noisy pixels from each quadrant. If the there are fewer than three noisy pixels in the level2.evt file, extra rows are filled as -1
| Pixel properties | Quadrant properties | ||||||
|---|---|---|---|---|---|---|---|
| Quadrant | DetID | PixID | Counts | Sigma | Mean | Median | Sigma |
| A | 4 | 2 | 196866 | 1063.91 | 895 | 879 | 184.2 |
| A | 15 | 174 | 31105 | 164.08 | 895 | 879 | 184.2 |
| A | 0 | 226 | 7760 | 37.35 | 895 | 879 | 184.2 |
| B | 5 | 172 | 179812 | 1028.09 | 893 | 874 | 174.0 |
| B | 7 | 220 | 36671 | 205.67 | 893 | 874 | 174.0 |
| B | 0 | 229 | 31766 | 177.49 | 893 | 874 | 174.0 |
| C | 3 | 233 | 584529 | 2905.47 | 849 | 857 | 200.9 |
| C | 0 | 207 | 153480 | 759.74 | 849 | 857 | 200.9 |
| C | 14 | 238 | 131987 | 652.75 | 849 | 857 | 200.9 |
| D | 5 | 222 | 235457 | 1114.05 | 864 | 840 | 210.6 |
| D | 11 | 176 | 156737 | 740.26 | 864 | 840 | 210.6 |
| D | 7 | 38 | 111819 | 526.97 | 864 | 840 | 210.6 |
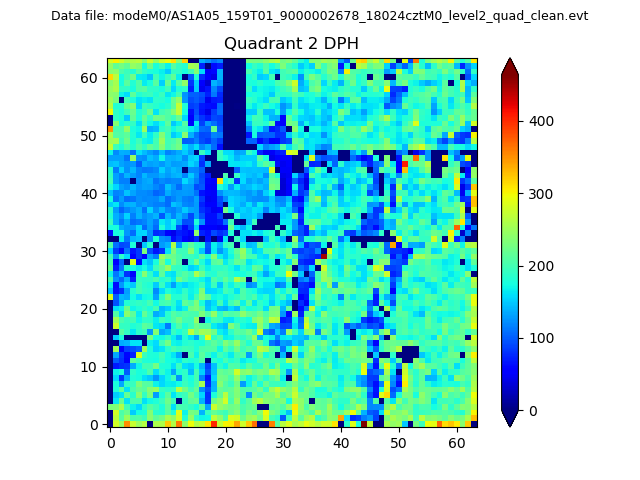
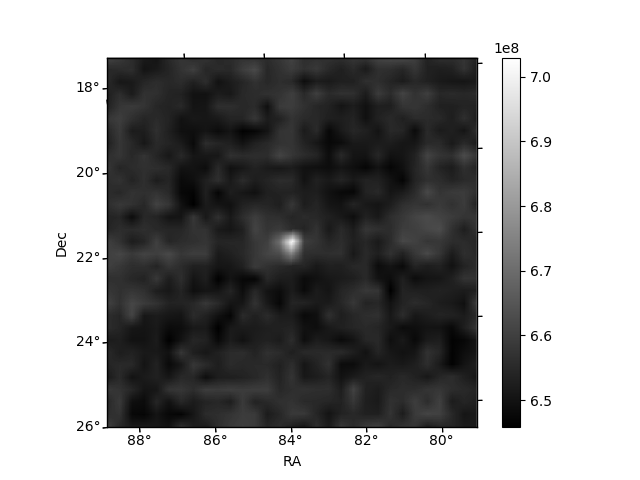
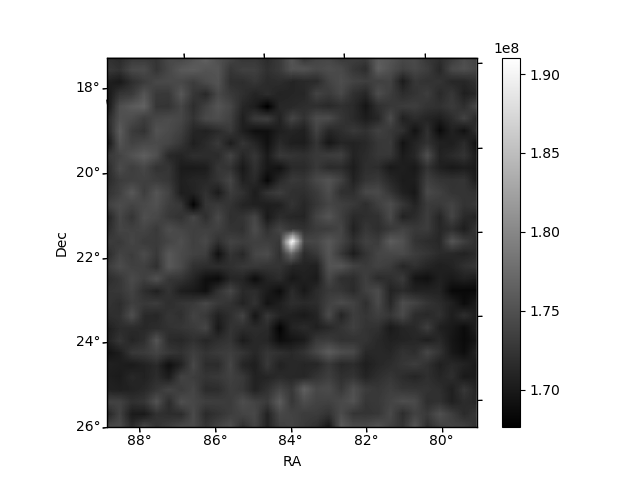
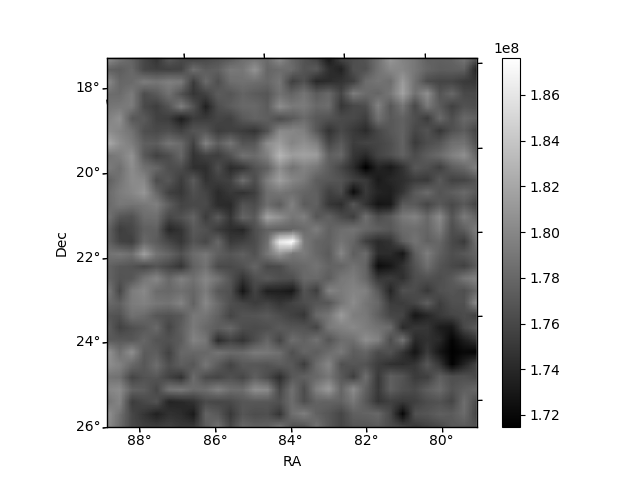
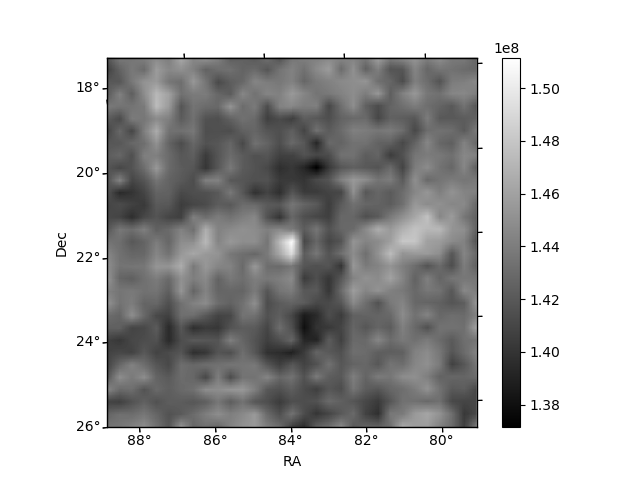
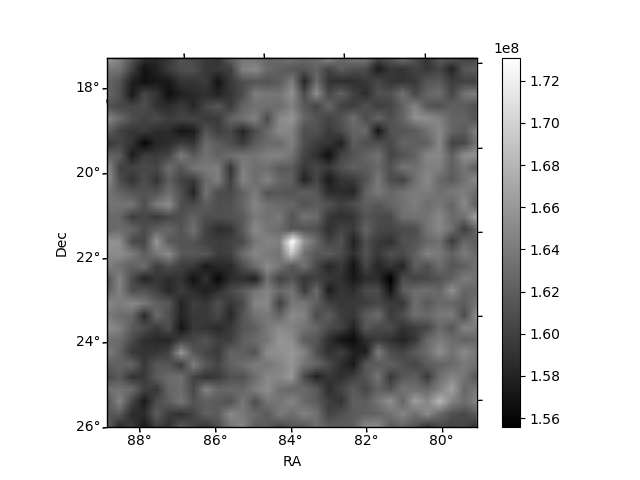
Histogram calculated using DETX and DETY for each event in the final _common_clean file
| Quadrant A | 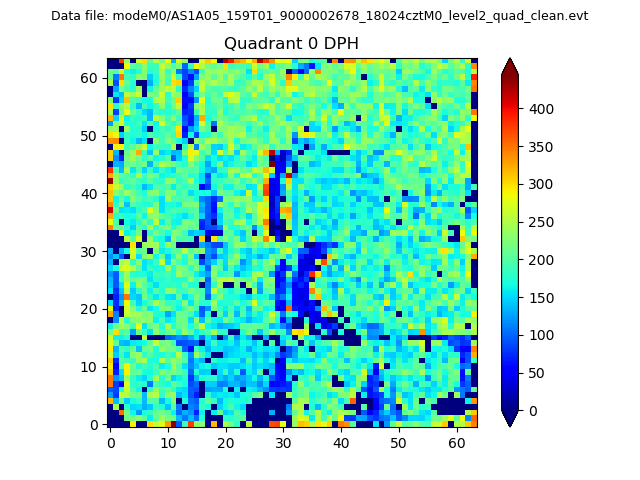 |
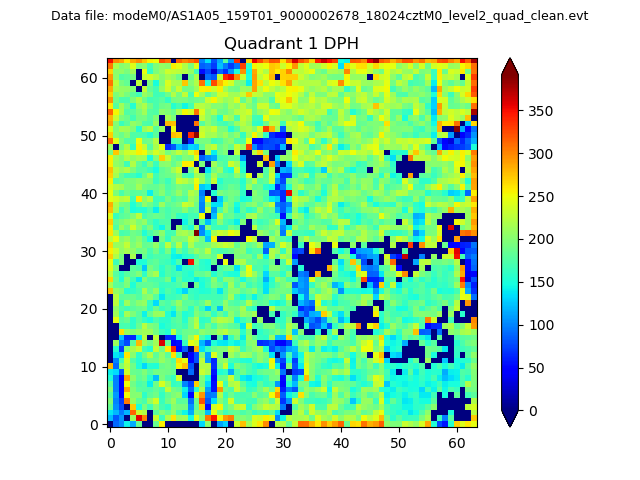 |
Quadrant B |
|---|---|---|---|
| Quadrant D | 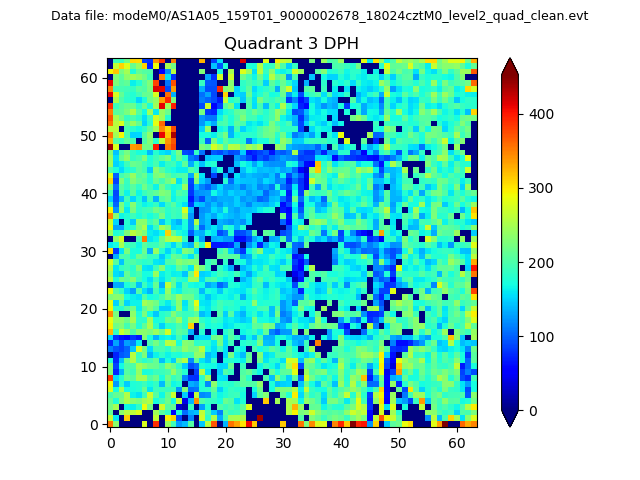 |
 |
Quadrant C |
| Plot type | Count rate plots | Images |
|---|---|---|
| Comparison with Poisson distribution Blue bars denote a histogram of data divided into 1 sec bins. Red curve is a Poisson curve with rate = median count rate of data. |
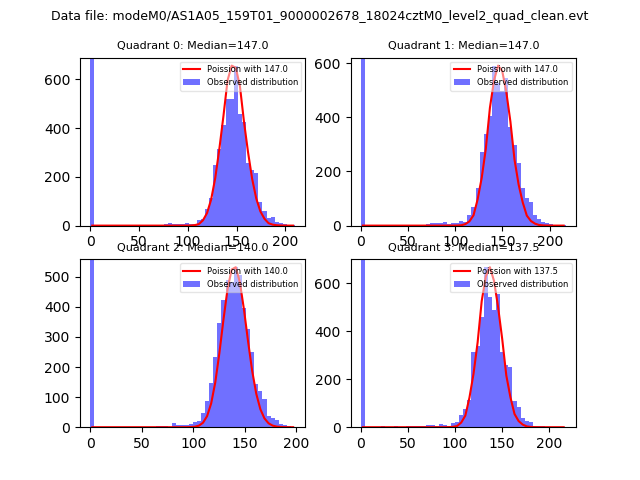 |
 |
| Quadrant-wise count rates Data is divided into 100 sec bins |
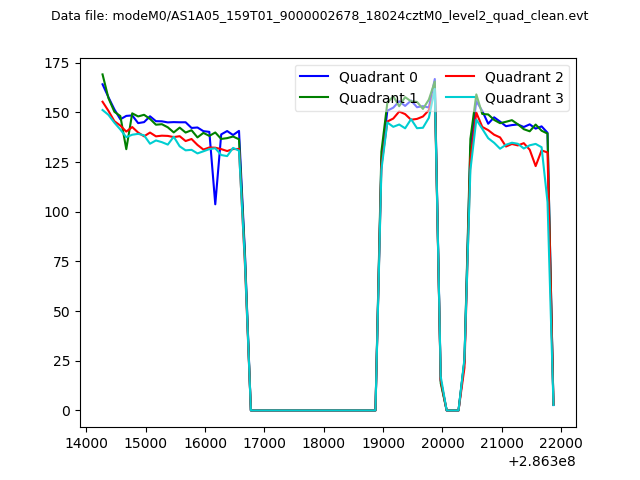 |
|
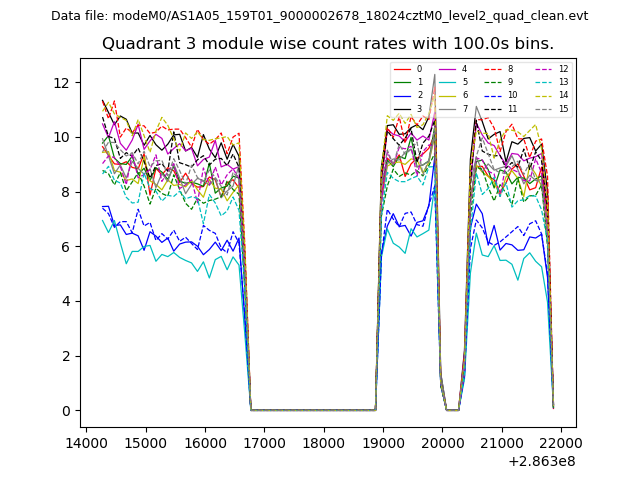
| Module-wise count rates for Quadrant A Data is divided into 100 sec bins |
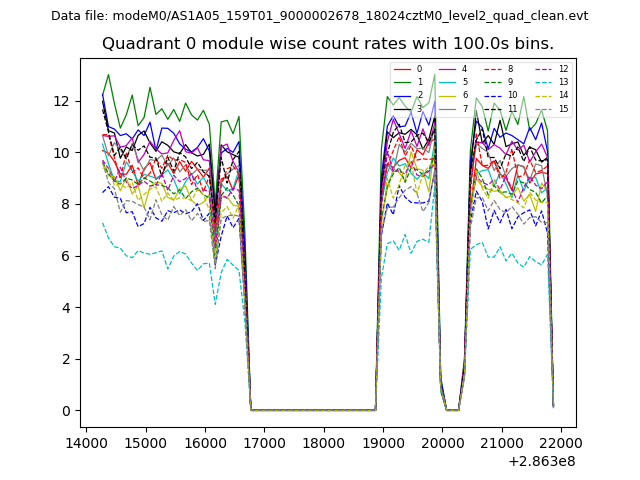 |
 |
| Module-wise count rates for Quadrant B Data is divided into 100 sec bins |
 |
 |
| Module-wise count rates for Quadrant C Data is divided into 100 sec bins |
 |
 |
| Module-wise count rates for Quadrant D Data is divided into 100 sec bins |
 |
 |
| Parameter | Plot |
|---|---|
| CZT HV Monitor |  |
| D_VDD | 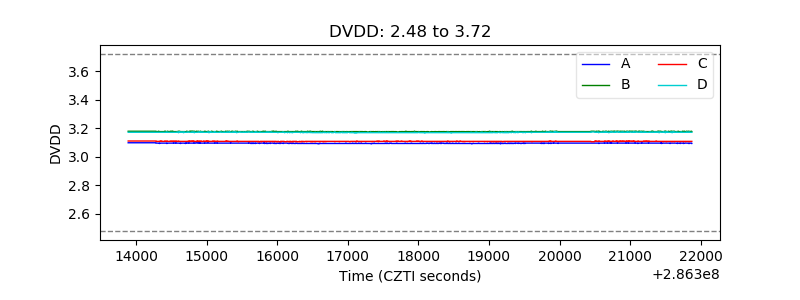 |
| Temperature 1 | 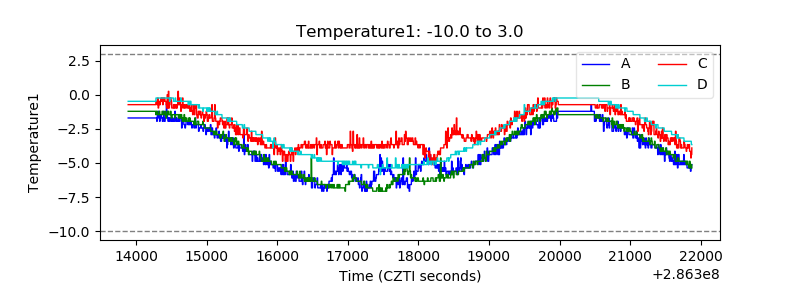 |
| Veto HV Monitor | 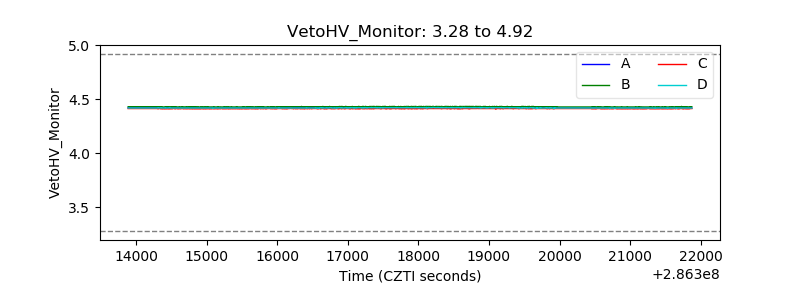 |
| Veto LLD |  |
| Alpha Counter | 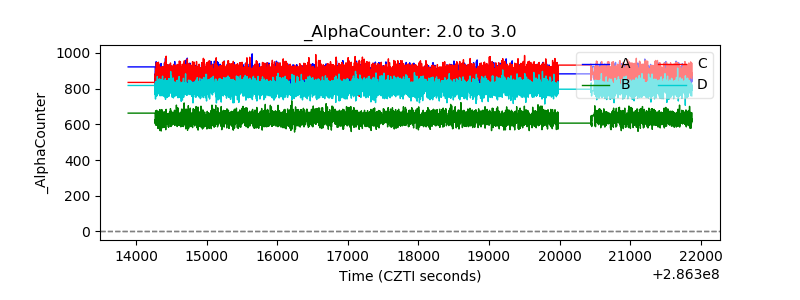 |
| _CPM_Rate | 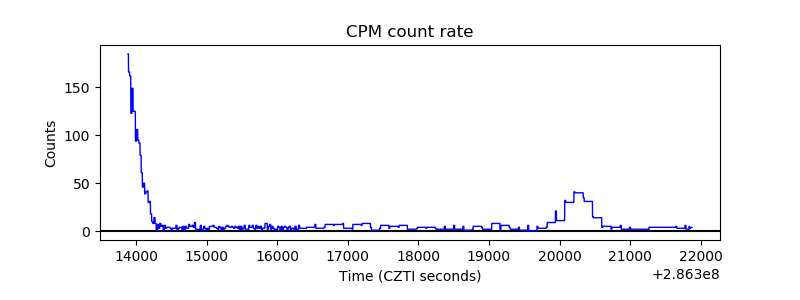 |
| CZT Counter | 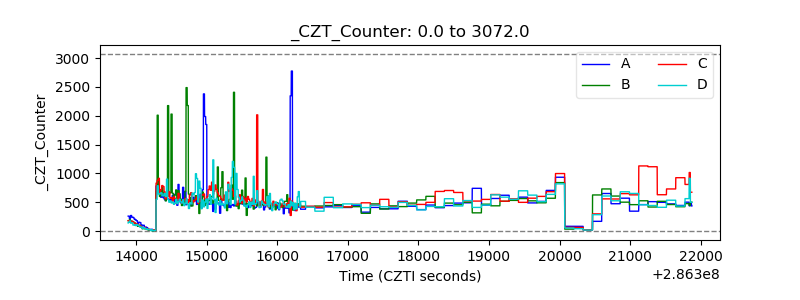 |
| +2.5 Volts monitor |  |
| +5 Volts monitor |  |
| _ROLL_ROT | 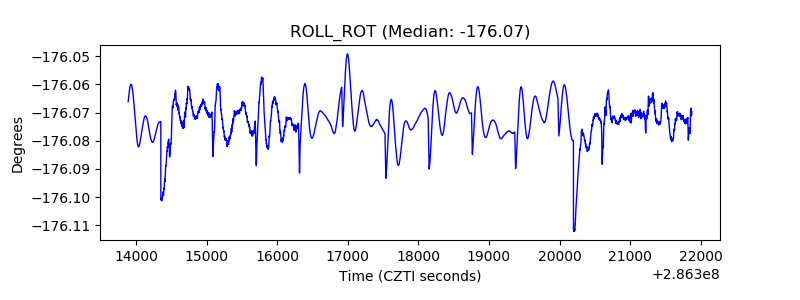 |
| _Roll_DEC | 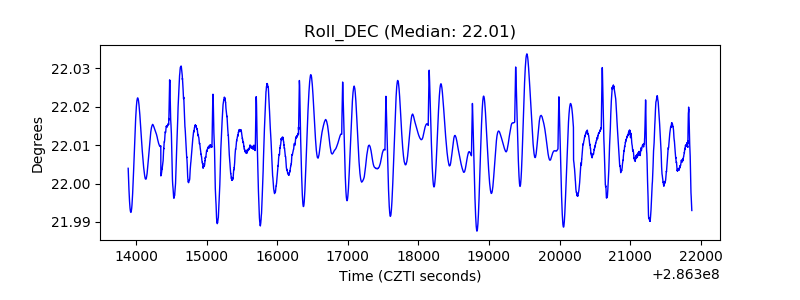 |
| _Roll_RA | 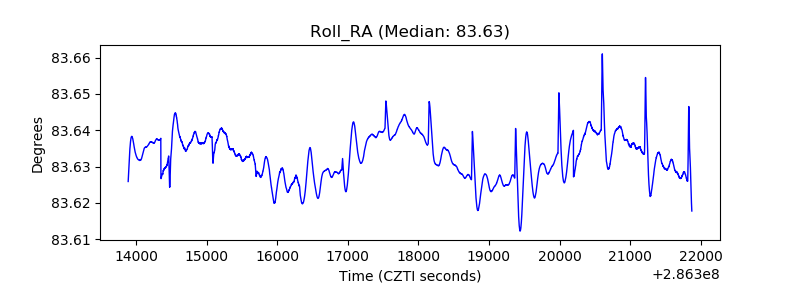 |
| Veto Counter |  |