| Param | Original file | Final file |
|---|---|---|
| Filename | modeM0/AS1A05_159T01_9000002678_18026cztM0_level2.evt | modeM0/AS1A05_159T01_9000002678_18026cztM0_level2_quad_clean.evt |
| Size (bytes) | 544,106,880 | 109,244,160 |
| Size | 518.9 MB | 104.2 MB |
| Events in quadrant A | 3,673,945 | 718,418 |
| Events in quadrant B | 3,804,736 | 722,025 |
| Events in quadrant C | 3,853,891 | 688,773 |
| Events in quadrant D | 4,632,415 | 653,084 |
| Mode SS | |||
|---|---|---|---|
| Quadrant | BADHDUFLAG | Total packets | Discarded packets |
| A | 0 | 154 | 0 |
| B | 0 | 154 | 0 |
| C | 0 | 154 | 0 |
| D | 0 | 154 | 0 |
| Mode M9 | |||
|---|---|---|---|
| Quadrant | BADHDUFLAG | Total packets | Discarded packets |
| A | 0 | 3 | 0 |
| B | 0 | 3 | 0 |
| C | 0 | 3 | 0 |
| D | 0 | 3 | 0 |
| Mode M0 | |||
|---|---|---|---|
| Quadrant | BADHDUFLAG | Total packets | Discarded packets |
| A | 0 | 15862 | 2 |
| B | 0 | 16094 | 2 |
| C | 0 | 16302 | 2 |
| D | 0 | 18856 | 2 |
| Quadrant | Total seconds | Saturated seconds | Saturation percentage |
|---|---|---|---|
| A | 7558 | 93 | 1.230484% |
| B | 7559 | 117 | 1.547824% |
| C | 7559 | 132 | 1.746263% |
| D | 7559 | 347 | 4.590554% |
Noise dominated data is calculated using 1-second bins in cleaned event files. If a bin has >2000 counts, and if more than 50% of those come from <1% of pixels, then it is considered to be noise-dominated and hence unusable.
| Quadrant | # 1 sec bins | Bins with >0 counts | Bins with >2000 counts | High rate bins dominated by noise | Noise dominated (total time) | Noise dominated (detector-on time) | Marked lightcurve |
|---|---|---|---|---|---|---|---|
| A | 7898 | 7559 | 6 | 6 | 0.08% | 0.08% | 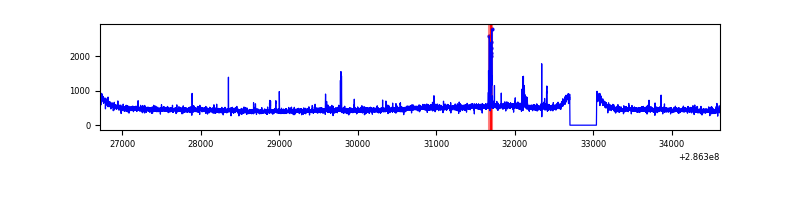 |
| B | 7899 | 7560 | 8 | 8 | 0.10% | 0.11% | 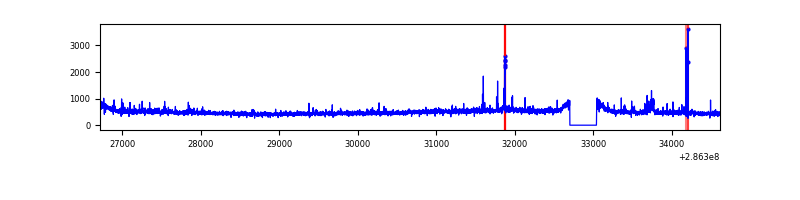 |
| C | 7899 | 7560 | 0 | 0 | 0.00% | 0.00% | 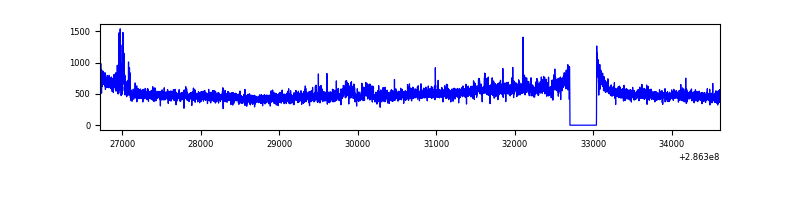 |
| D | 7899 | 7560 | 173 | 173 | 2.19% | 2.29% | 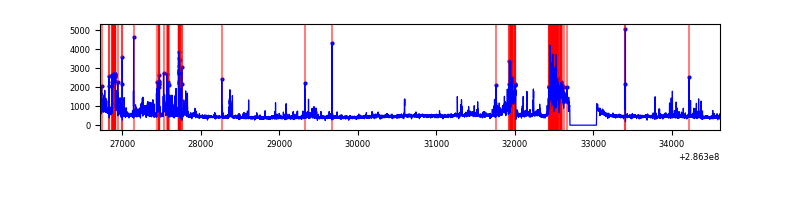 |
Top three noisy pixels from each quadrant. If the there are fewer than three noisy pixels in the level2.evt file, extra rows are filled as -1
| Pixel properties | Quadrant properties | ||||||
|---|---|---|---|---|---|---|---|
| Quadrant | DetID | PixID | Counts | Sigma | Mean | Median | Sigma |
| A | 15 | 174 | 66465 | 343.19 | 933 | 915 | 191.0 |
| A | 3 | 1 | 19073 | 95.07 | 933 | 915 | 191.0 |
| A | 0 | 226 | 8169 | 37.98 | 933 | 915 | 191.0 |
| B | 0 | 197 | 34989 | 189.45 | 937 | 913 | 179.9 |
| B | 7 | 220 | 24370 | 130.41 | 937 | 913 | 179.9 |
| B | 0 | 189 | 20554 | 109.2 | 937 | 913 | 179.9 |
| C | 14 | 238 | 139400 | 656.17 | 896 | 905 | 211.1 |
| C | 3 | 233 | 139010 | 654.33 | 896 | 905 | 211.1 |
| C | 0 | 207 | 46574 | 216.37 | 896 | 905 | 211.1 |
| D | 11 | 176 | 556189 | 2563.4 | 887 | 863 | 216.6 |
| D | 7 | 38 | 340804 | 1569.17 | 887 | 863 | 216.6 |
| D | 5 | 222 | 288667 | 1328.51 | 887 | 863 | 216.6 |
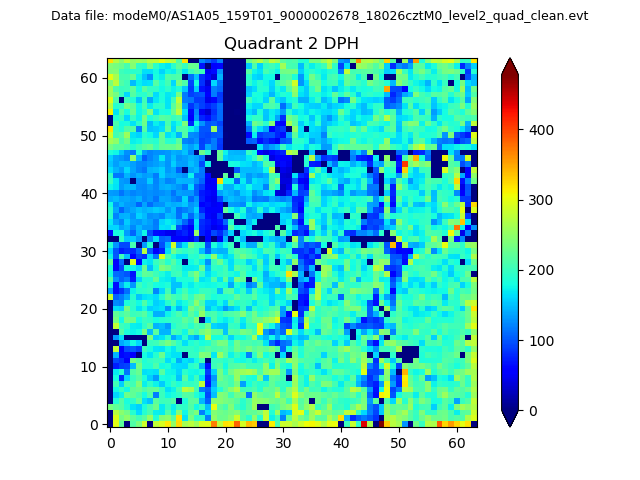
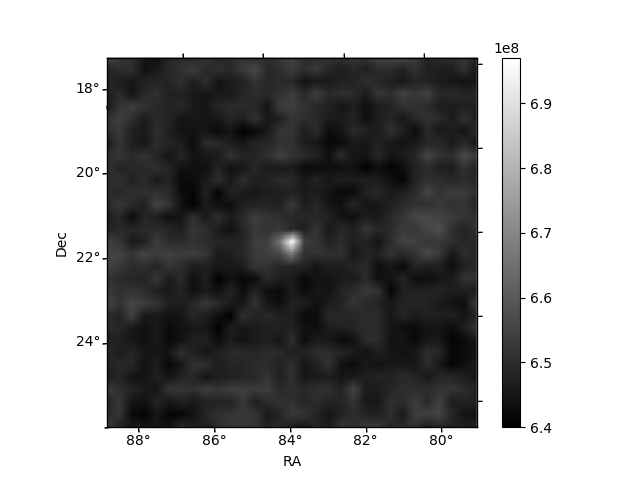
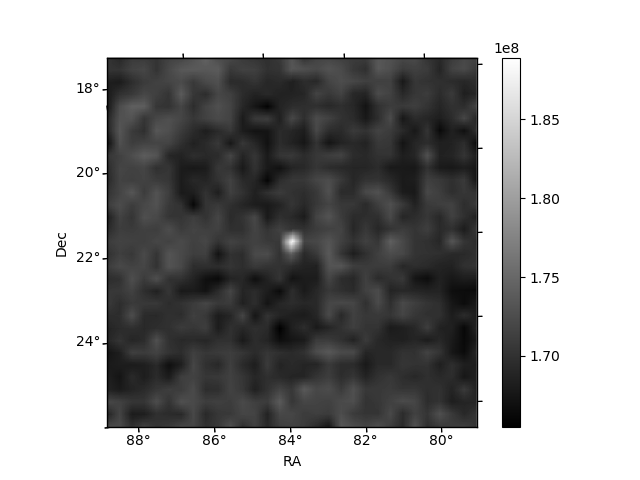
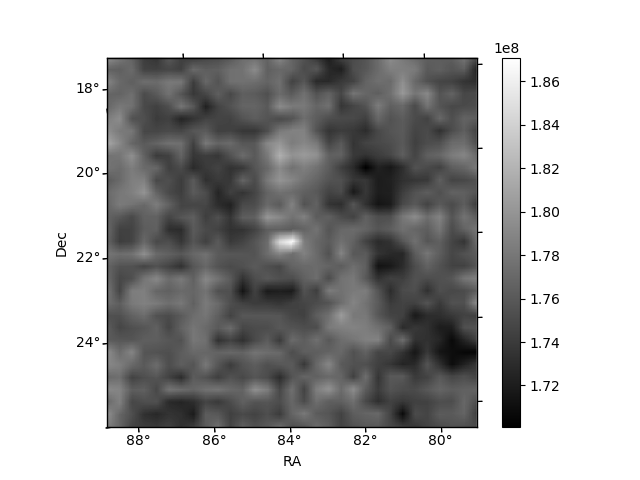
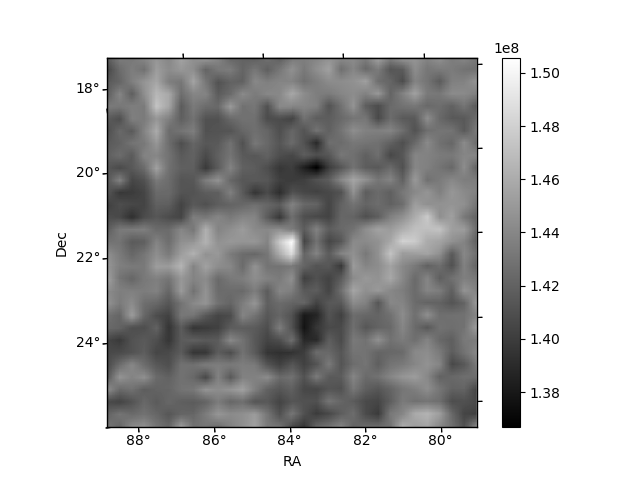
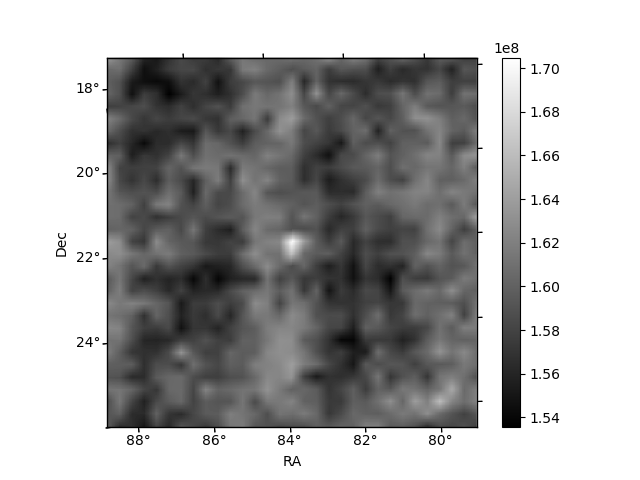
Histogram calculated using DETX and DETY for each event in the final _common_clean file
| Quadrant A | 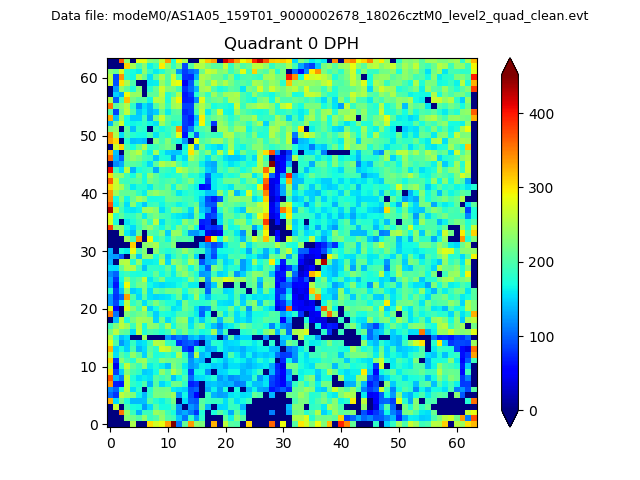 |
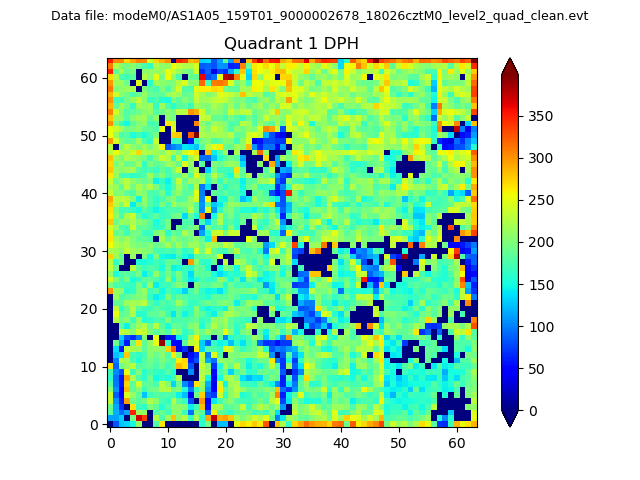 |
Quadrant B |
|---|---|---|---|
| Quadrant D | 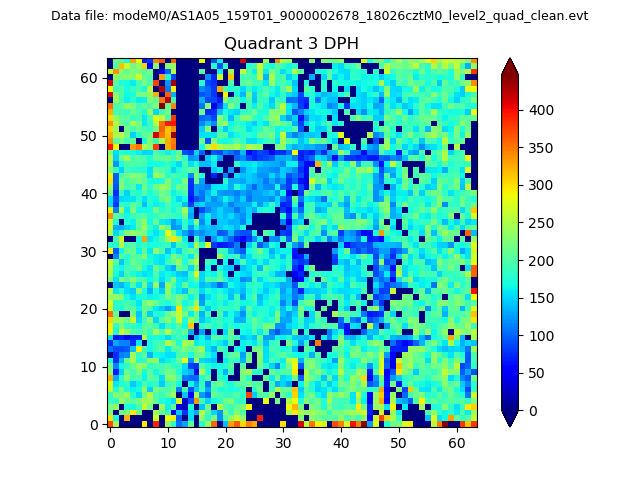 |
 |
Quadrant C |
| Plot type | Count rate plots | Images |
|---|---|---|
| Comparison with Poisson distribution Blue bars denote a histogram of data divided into 1 sec bins. Red curve is a Poisson curve with rate = median count rate of data. |
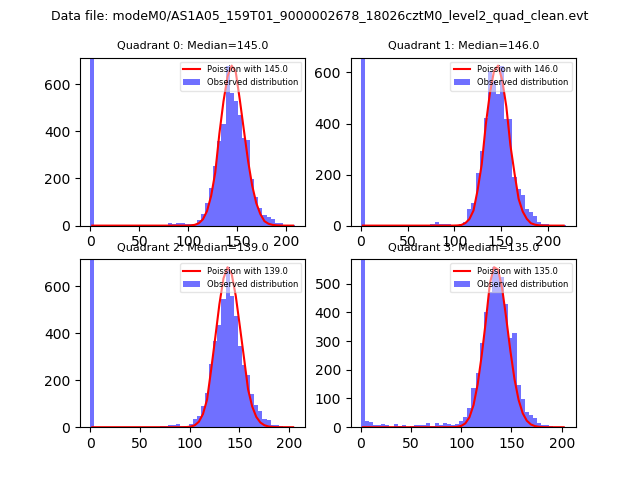 |
 |
| Quadrant-wise count rates Data is divided into 100 sec bins |
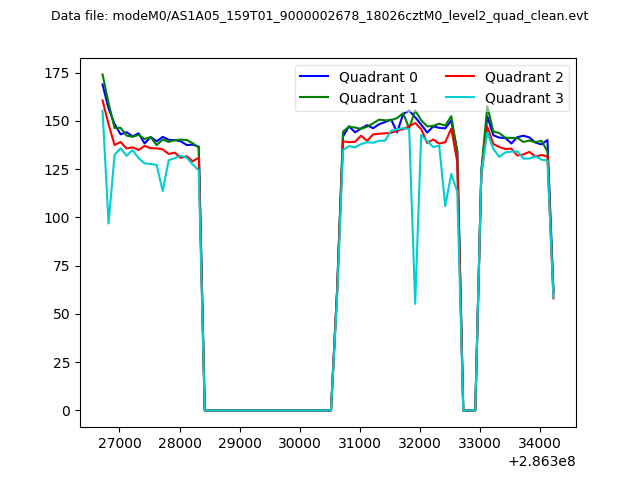 |
|
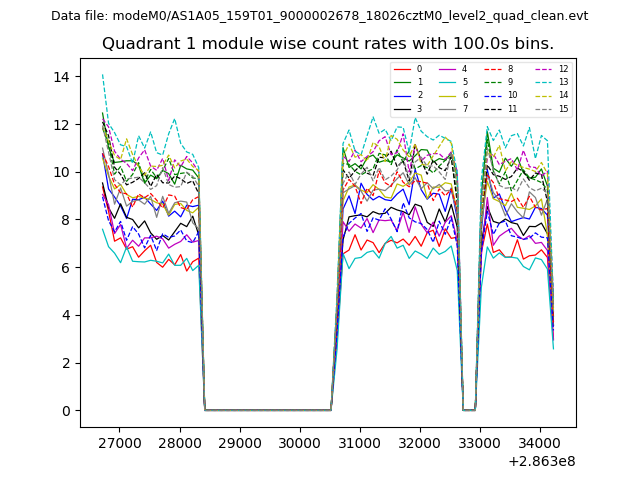
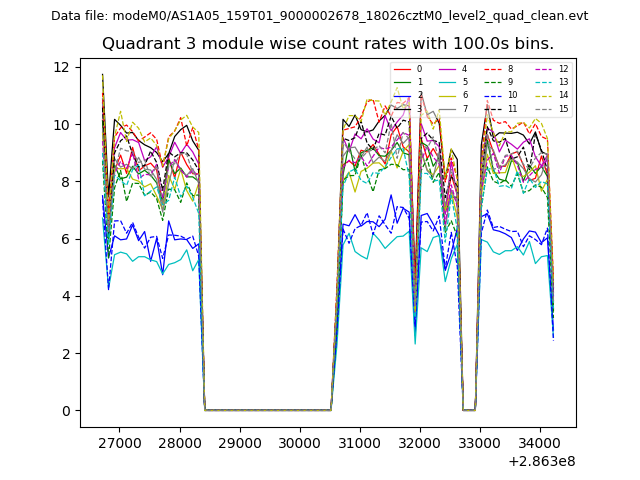
| Module-wise count rates for Quadrant A Data is divided into 100 sec bins |
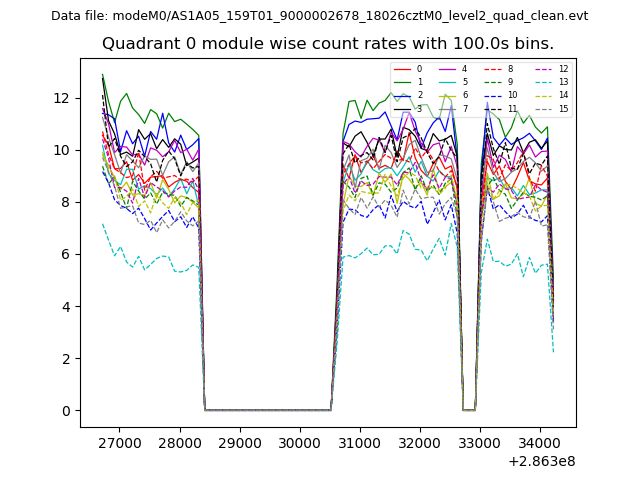 |
 |
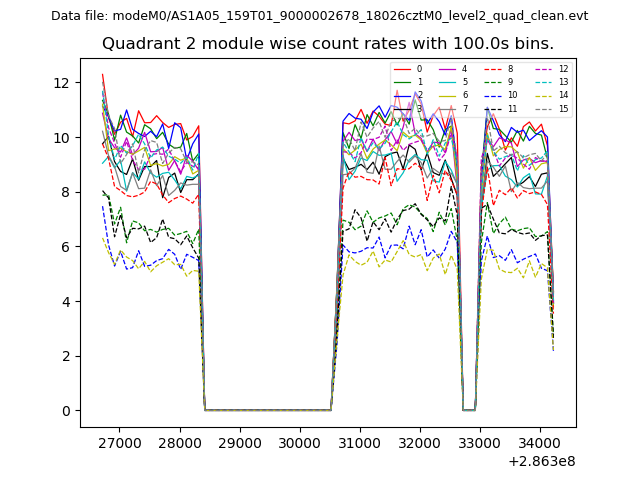
| Module-wise count rates for Quadrant B Data is divided into 100 sec bins |
 |
 |
| Module-wise count rates for Quadrant C Data is divided into 100 sec bins |
 |
 |
| Module-wise count rates for Quadrant D Data is divided into 100 sec bins |
 |
 |
| Parameter | Plot |
|---|---|
| CZT HV Monitor | 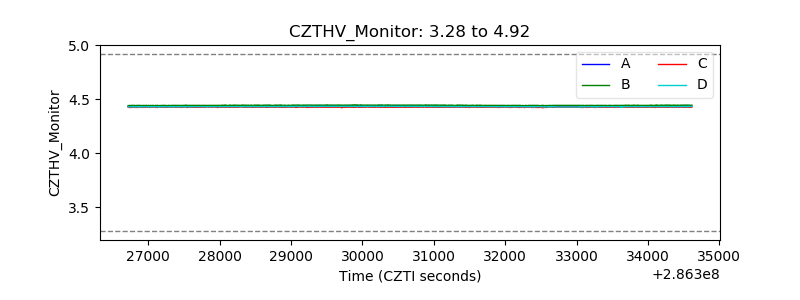 |
| D_VDD | 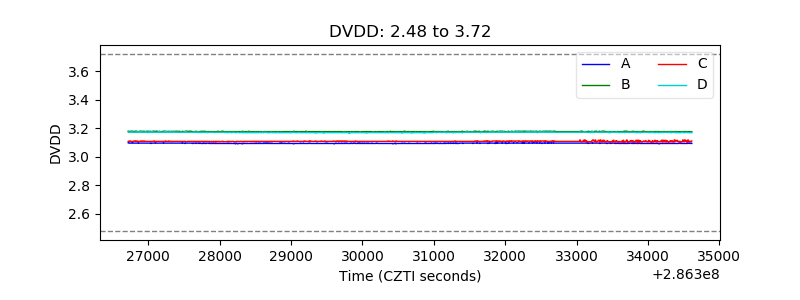 |
| Temperature 1 |  |
| Veto HV Monitor | 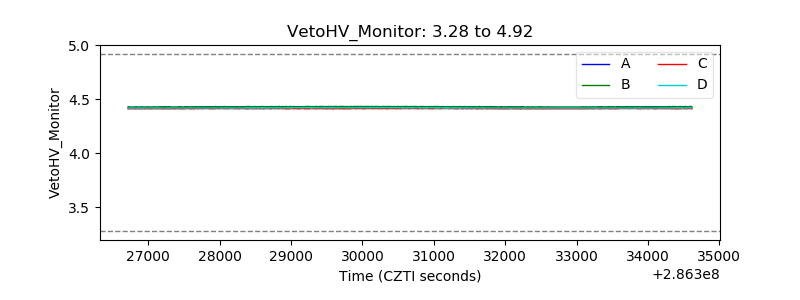 |
| Veto LLD | 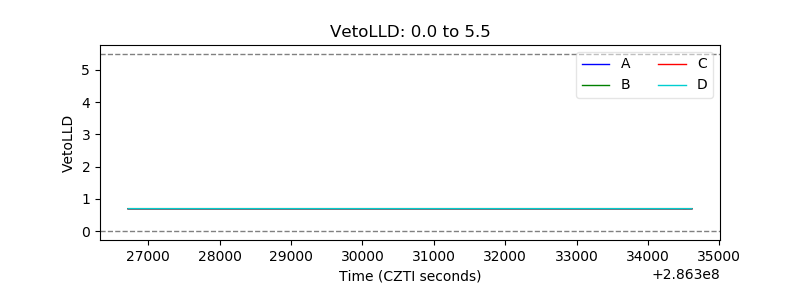 |
| Alpha Counter | 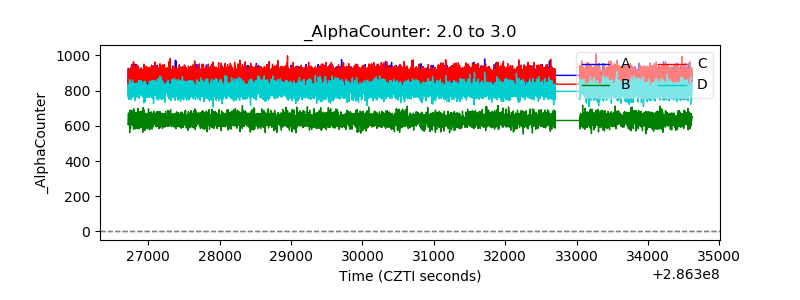 |
| _CPM_Rate | 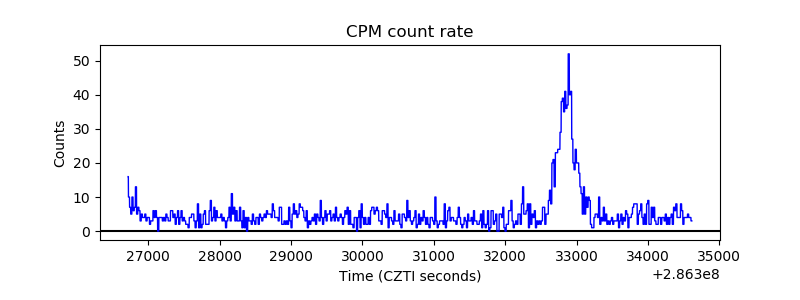 |
| CZT Counter | 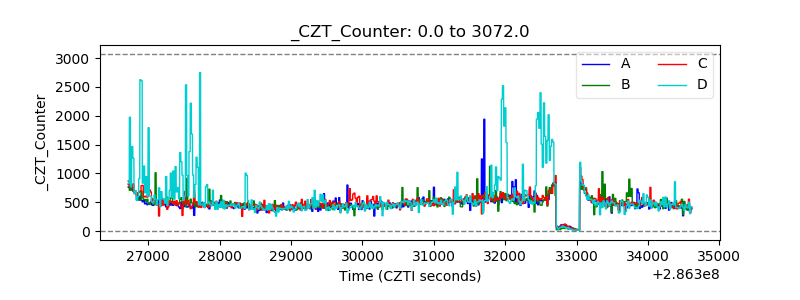 |
| +2.5 Volts monitor |  |
| +5 Volts monitor |  |
| _ROLL_ROT | 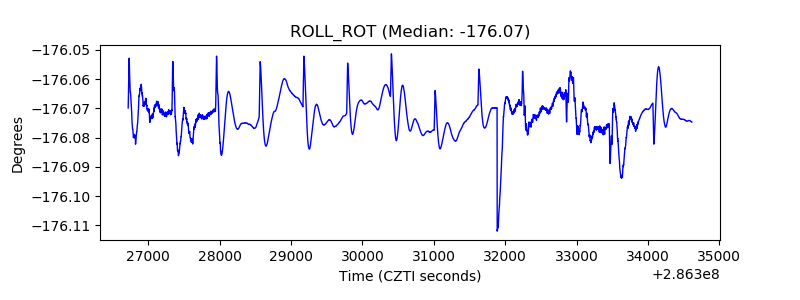 |
| _Roll_DEC | 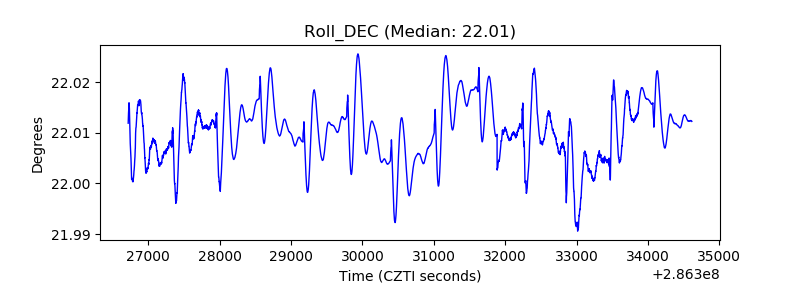 |
| _Roll_RA | 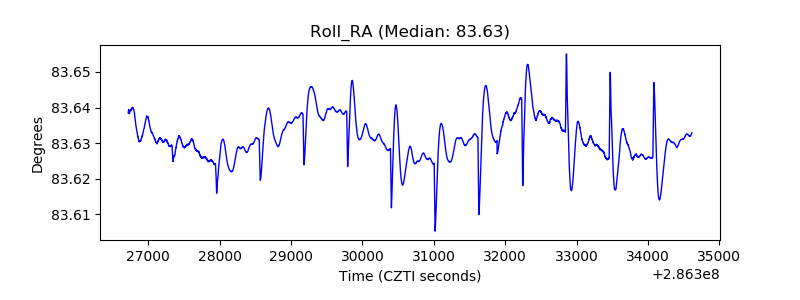 |
| Veto Counter | 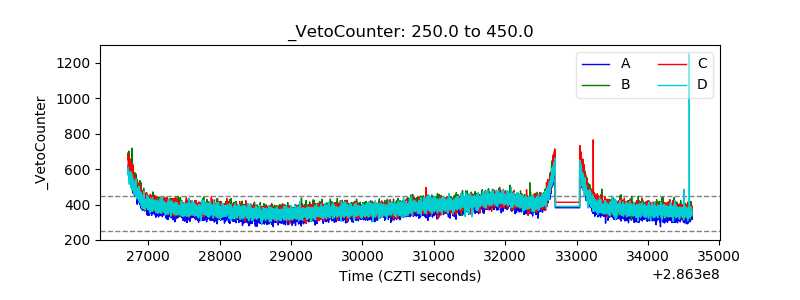 |