| Param | Original file | Final file |
|---|---|---|
| Filename | modeM0/AS1A05_159T01_9000002678_18029cztM0_level2.evt | modeM0/AS1A05_159T01_9000002678_18029cztM0_level2_quad_clean.evt |
| Size (bytes) | 1,329,557,760 | 236,859,840 |
| Size | 1.2 GB | 225.9 MB |
| Events in quadrant A | 9,322,573 | 1,503,764 |
| Events in quadrant B | 9,408,692 | 1,513,729 |
| Events in quadrant C | 9,296,899 | 1,458,345 |
| Events in quadrant D | 10,974,384 | 1,409,925 |
| Mode SS | |||
|---|---|---|---|
| Quadrant | BADHDUFLAG | Total packets | Discarded packets |
| A | 0 | 384 | 0 |
| B | 0 | 384 | 0 |
| C | 0 | 384 | 0 |
| D | 0 | 384 | 0 |
| Mode M9 | |||
|---|---|---|---|
| Quadrant | BADHDUFLAG | Total packets | Discarded packets |
| A | 0 | 23 | 0 |
| B | 0 | 23 | 0 |
| C | 0 | 23 | 0 |
| D | 0 | 23 | 0 |
| Mode M0 | |||
|---|---|---|---|
| Quadrant | BADHDUFLAG | Total packets | Discarded packets |
| A | 0 | 39588 | 4 |
| B | 0 | 39638 | 4 |
| C | 0 | 38923 | 4 |
| D | 0 | 45164 | 4 |
| Quadrant | Total seconds | Saturated seconds | Saturation percentage |
|---|---|---|---|
| A | 18681 | 295 | 1.579145% |
| B | 18682 | 283 | 1.514827% |
| C | 18681 | 265 | 1.418554% |
| D | 18681 | 537 | 2.874578% |
Noise dominated data is calculated using 1-second bins in cleaned event files. If a bin has >2000 counts, and if more than 50% of those come from <1% of pixels, then it is considered to be noise-dominated and hence unusable.
| Quadrant | # 1 sec bins | Bins with >0 counts | Bins with >2000 counts | High rate bins dominated by noise | Noise dominated (total time) | Noise dominated (detector-on time) | Marked lightcurve |
|---|---|---|---|---|---|---|---|
| A | 21106 | 18685 | 81 | 81 | 0.38% | 0.43% | 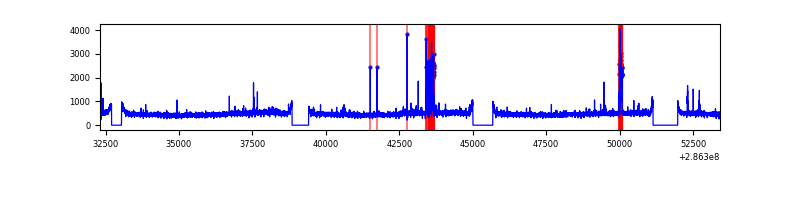 |
| B | 21107 | 18686 | 28 | 28 | 0.13% | 0.15% | 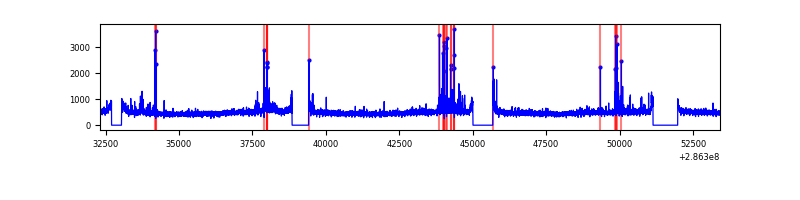 |
| C | 21106 | 18685 | 2 | 2 | 0.01% | 0.01% | 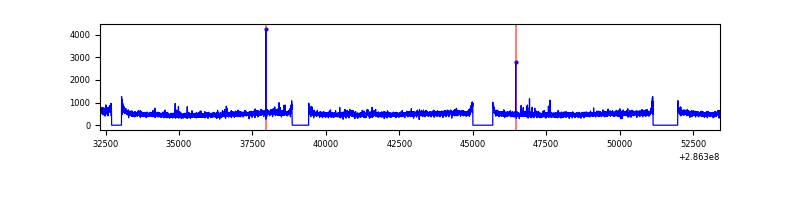 |
| D | 21106 | 18685 | 286 | 286 | 1.36% | 1.53% | 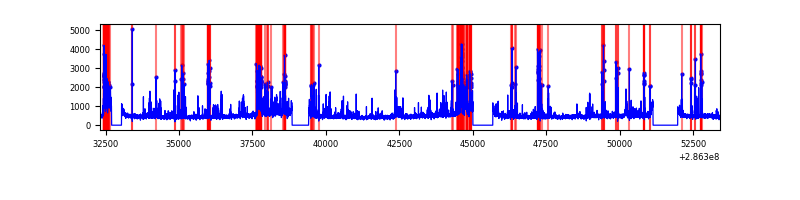 |
Top three noisy pixels from each quadrant. If the there are fewer than three noisy pixels in the level2.evt file, extra rows are filled as -1
| Pixel properties | Quadrant properties | ||||||
|---|---|---|---|---|---|---|---|
| Quadrant | DetID | PixID | Counts | Sigma | Mean | Median | Sigma |
| A | 15 | 174 | 410032 | 873.22 | 2305 | 2261 | 467.0 |
| A | 4 | 2 | 24328 | 47.26 | 2305 | 2261 | 467.0 |
| A | 6 | 16 | 22921 | 44.24 | 2305 | 2261 | 467.0 |
| B | 7 | 220 | 211523 | 474.37 | 2307 | 2256 | 441.1 |
| B | 12 | 111 | 52214 | 113.25 | 2307 | 2256 | 441.1 |
| B | 0 | 219 | 48392 | 104.58 | 2307 | 2256 | 441.1 |
| C | 14 | 238 | 343302 | 655.9 | 2214 | 2236 | 520.0 |
| C | 3 | 233 | 219888 | 418.57 | 2214 | 2236 | 520.0 |
| C | 8 | 208 | 46687 | 85.48 | 2214 | 2236 | 520.0 |
| D | 5 | 222 | 1388290 | 2566.27 | 2222 | 2165 | 540.1 |
| D | 11 | 176 | 527295 | 972.22 | 2222 | 2165 | 540.1 |
| D | 7 | 38 | 354641 | 652.57 | 2222 | 2165 | 540.1 |
Histogram calculated using DETX and DETY for each event in the final _common_clean file
| Quadrant A | 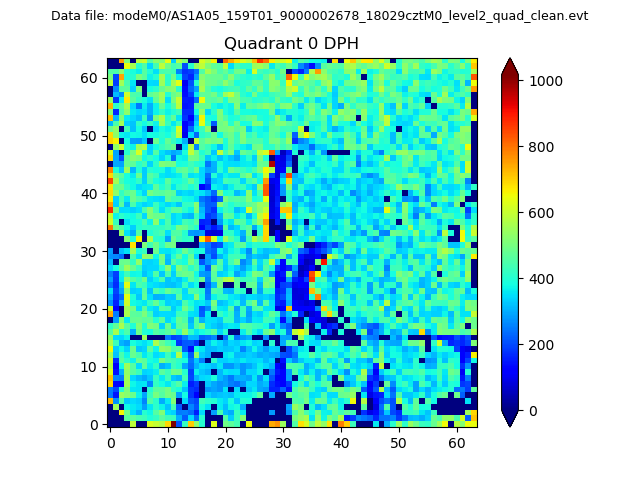 |
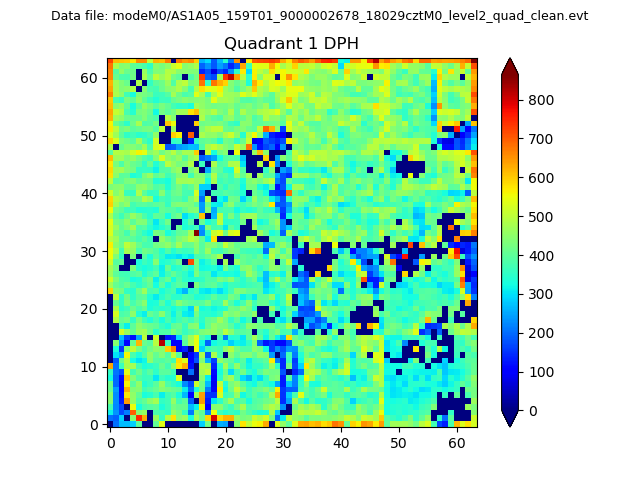 |
Quadrant B |
|---|---|---|---|
| Quadrant D | 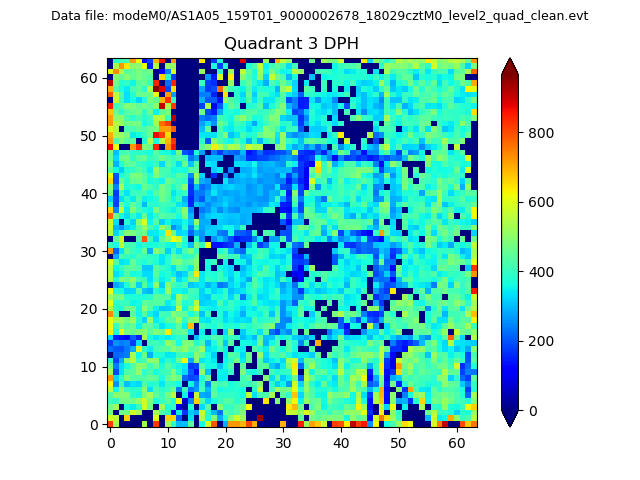 |
 |
Quadrant C |
| Plot type | Count rate plots | Images |
|---|---|---|
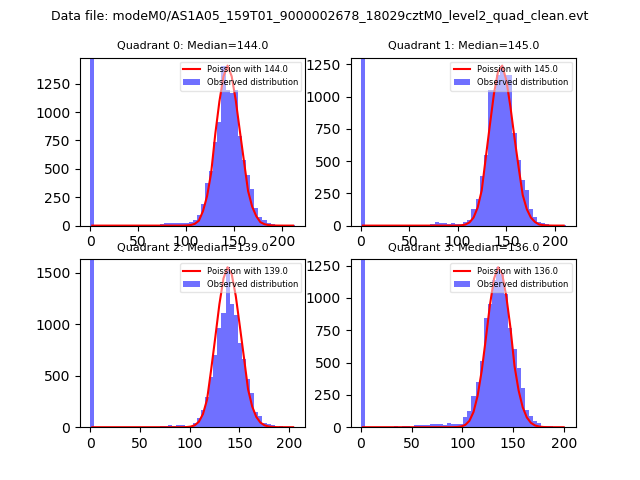
| Comparison with Poisson distribution Blue bars denote a histogram of data divided into 1 sec bins. Red curve is a Poisson curve with rate = median count rate of data. |
 |
 |
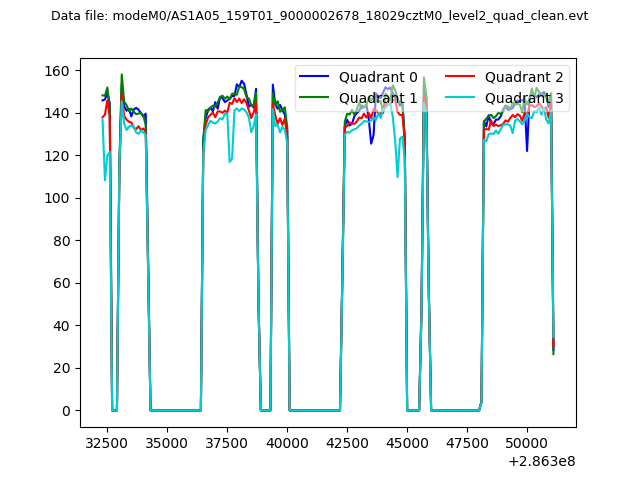
| Quadrant-wise count rates Data is divided into 100 sec bins |
 |
|
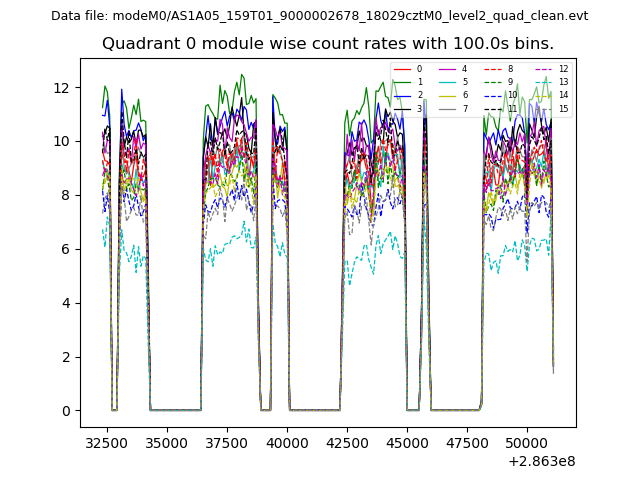
| Module-wise count rates for Quadrant A Data is divided into 100 sec bins |
 |
 |
| Module-wise count rates for Quadrant B Data is divided into 100 sec bins |
 |
 |
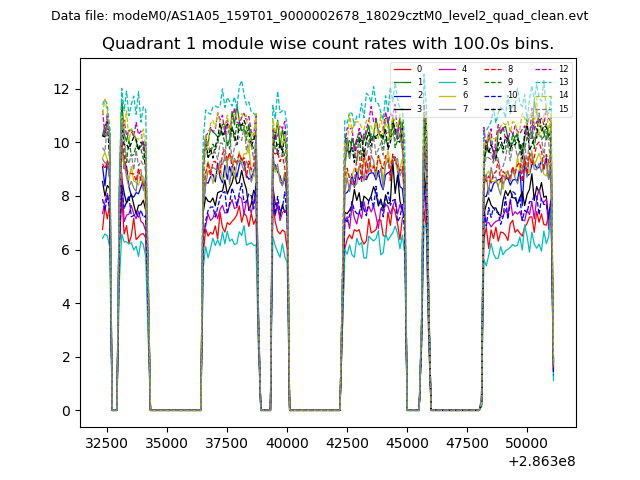
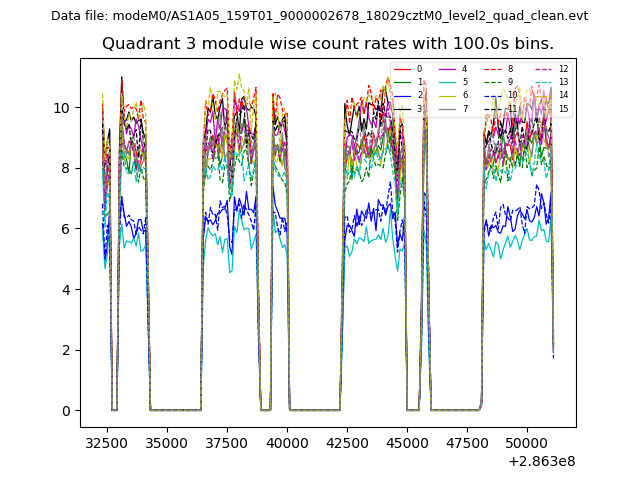
| Module-wise count rates for Quadrant C Data is divided into 100 sec bins |
 |
 |
| Module-wise count rates for Quadrant D Data is divided into 100 sec bins |
 |
 |
| Parameter | Plot |
|---|---|
| CZT HV Monitor | 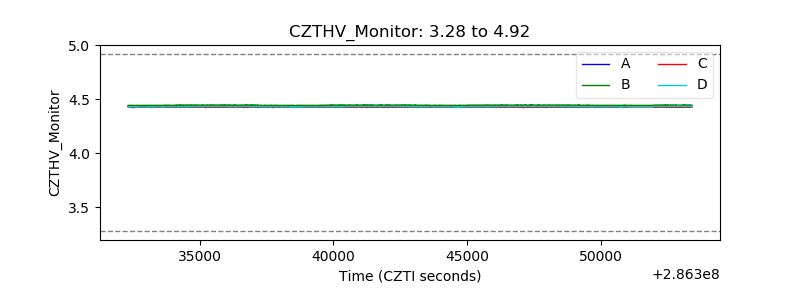 |
| D_VDD | 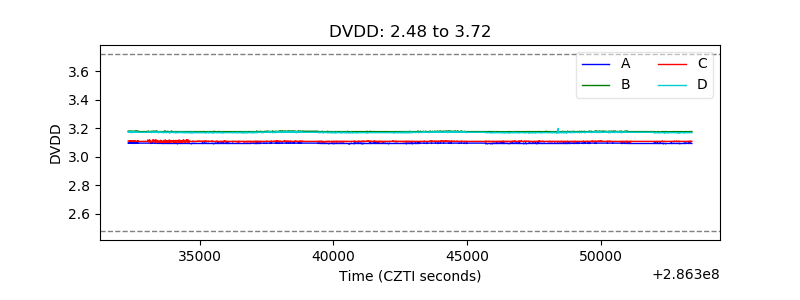 |
| Temperature 1 | 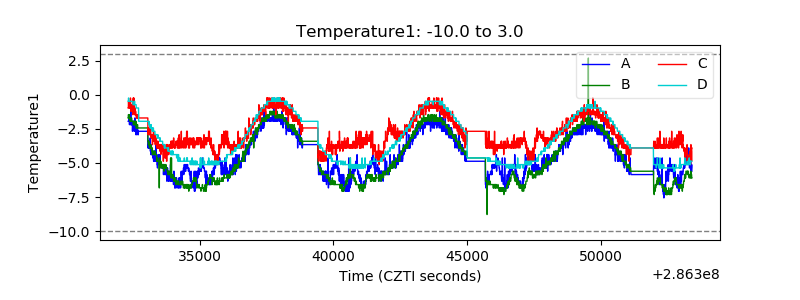 |
| Veto HV Monitor | 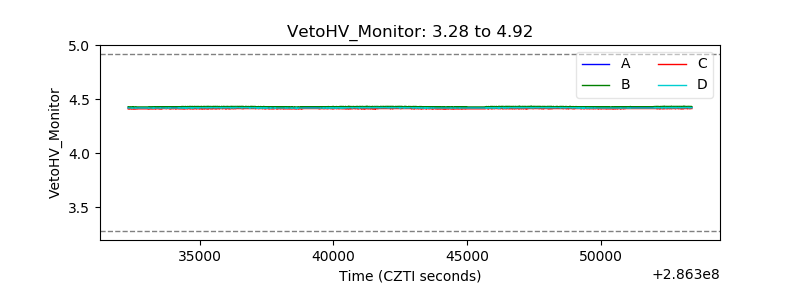 |
| Veto LLD | 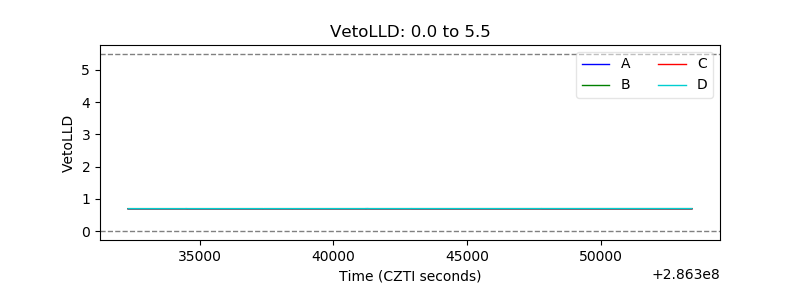 |
| Alpha Counter | 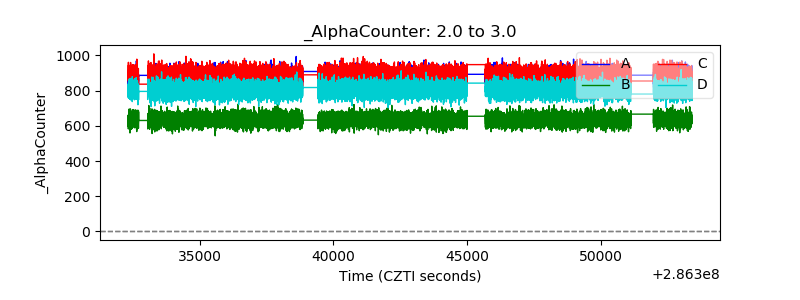 |
| _CPM_Rate | 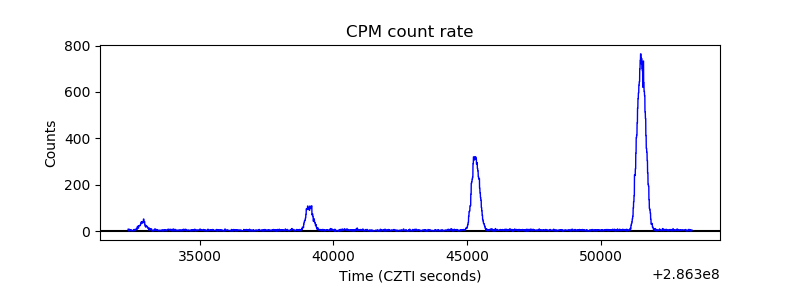 |
| CZT Counter |  |
| +2.5 Volts monitor |  |
| +5 Volts monitor | 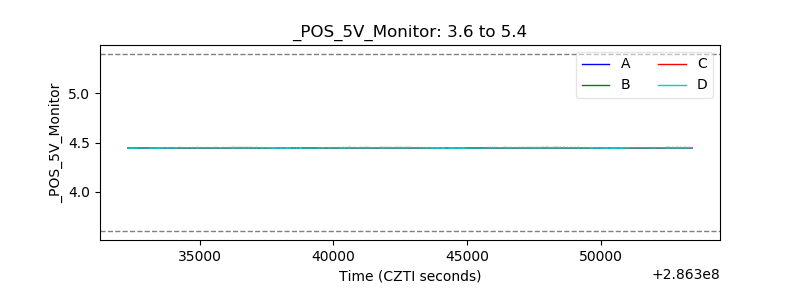 |
| _ROLL_ROT | 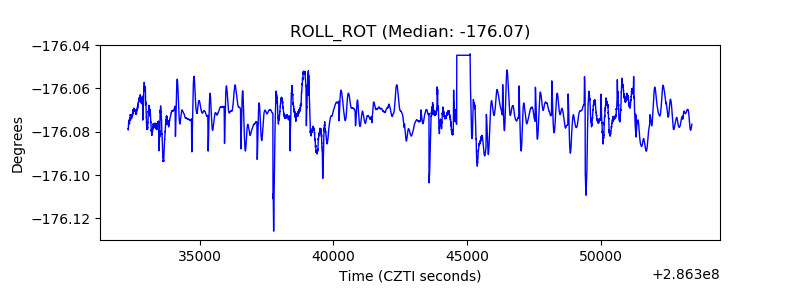 |
| _Roll_DEC | 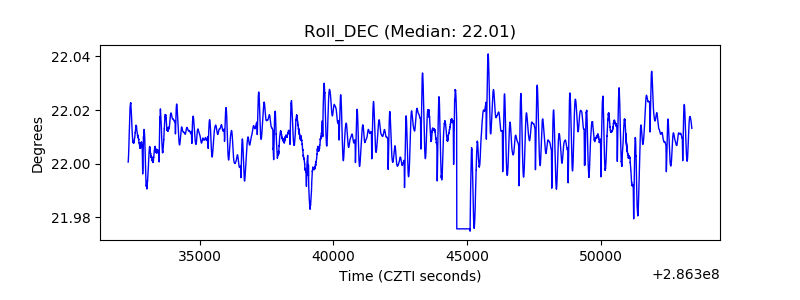 |
| _Roll_RA |  |
| Veto Counter | 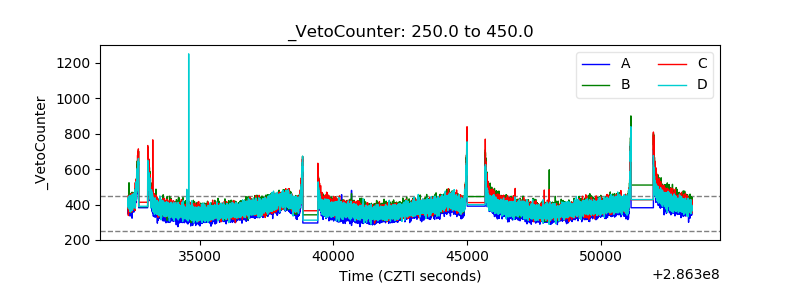 |