| Param | Original file | Final file |
|---|---|---|
| Filename | modeM0/AS1A05_159T01_9000002678_18032cztM0_level2.evt | modeM0/AS1A05_159T01_9000002678_18032cztM0_level2_quad_clean.evt |
| Size (bytes) | 506,885,760 | 87,609,600 |
| Size | 483.4 MB | 83.6 MB |
| Events in quadrant A | 3,618,280 | 560,878 |
| Events in quadrant B | 3,581,011 | 566,289 |
| Events in quadrant C | 3,637,059 | 536,811 |
| Events in quadrant D | 4,063,665 | 525,887 |
| Mode SS | |||
|---|---|---|---|
| Quadrant | BADHDUFLAG | Total packets | Discarded packets |
| A | 0 | 136 | 0 |
| B | 0 | 136 | 0 |
| C | 0 | 136 | 0 |
| D | 0 | 136 | 0 |
| Mode M9 | |||
|---|---|---|---|
| Quadrant | BADHDUFLAG | Total packets | Discarded packets |
| A | 0 | 21 | 0 |
| B | 0 | 21 | 0 |
| C | 0 | 21 | 0 |
| D | 0 | 21 | 0 |
| Mode M0 | |||
|---|---|---|---|
| Quadrant | BADHDUFLAG | Total packets | Discarded packets |
| A | 0 | 14713 | 2 |
| B | 0 | 14588 | 2 |
| C | 0 | 14752 | 2 |
| D | 0 | 16282 | 2 |
| Quadrant | Total seconds | Saturated seconds | Saturation percentage |
|---|---|---|---|
| A | 6648 | 134 | 2.015644% |
| B | 6649 | 142 | 2.135659% |
| C | 6649 | 128 | 1.925102% |
| D | 6649 | 160 | 2.406377% |
Noise dominated data is calculated using 1-second bins in cleaned event files. If a bin has >2000 counts, and if more than 50% of those come from <1% of pixels, then it is considered to be noise-dominated and hence unusable.
| Quadrant | # 1 sec bins | Bins with >0 counts | Bins with >2000 counts | High rate bins dominated by noise | Noise dominated (total time) | Noise dominated (detector-on time) | Marked lightcurve |
|---|---|---|---|---|---|---|---|
| A | 8753 | 6649 | 24 | 24 | 0.27% | 0.36% | 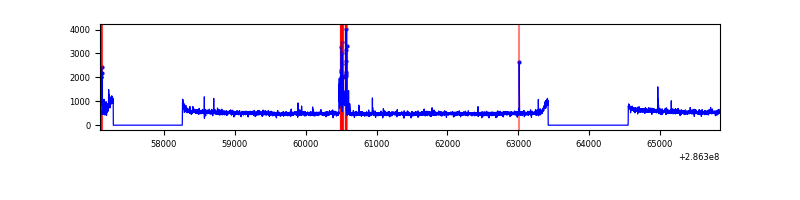 |
| B | 8754 | 6650 | 9 | 9 | 0.10% | 0.14% | 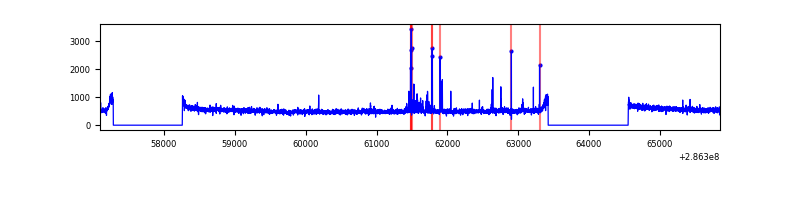 |
| C | 8754 | 6651 | 1 | 1 | 0.01% | 0.02% | 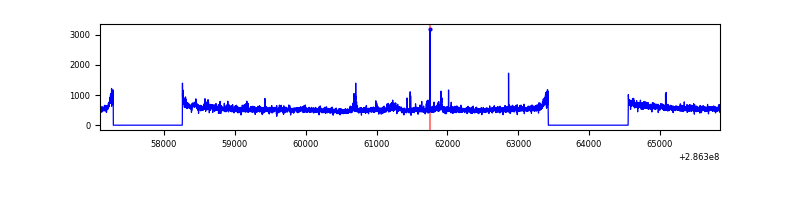 |
| D | 8754 | 6651 | 50 | 50 | 0.57% | 0.75% | 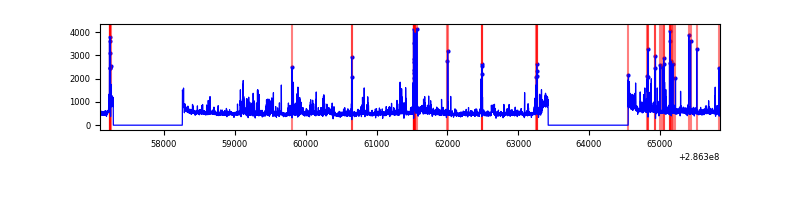 |
Top three noisy pixels from each quadrant. If the there are fewer than three noisy pixels in the level2.evt file, extra rows are filled as -1
| Pixel properties | Quadrant properties | ||||||
|---|---|---|---|---|---|---|---|
| Quadrant | DetID | PixID | Counts | Sigma | Mean | Median | Sigma |
| A | 15 | 174 | 189502 | 1049.48 | 891 | 877 | 179.7 |
| A | 0 | 226 | 7770 | 38.35 | 891 | 877 | 179.7 |
| A | 3 | 137 | 6463 | 31.08 | 891 | 877 | 179.7 |
| B | 7 | 220 | 63890 | 367.68 | 891 | 873 | 171.4 |
| B | 12 | 111 | 19504 | 108.7 | 891 | 873 | 171.4 |
| B | 11 | 111 | 17219 | 95.37 | 891 | 873 | 171.4 |
| C | 3 | 233 | 169708 | 857.72 | 841 | 848 | 196.9 |
| C | 14 | 238 | 132738 | 669.93 | 841 | 848 | 196.9 |
| C | 8 | 208 | 34636 | 171.63 | 841 | 848 | 196.9 |
| D | 7 | 238 | 499340 | 2385.38 | 853 | 830 | 209.0 |
| D | 11 | 176 | 147197 | 700.37 | 853 | 830 | 209.0 |
| D | 5 | 222 | 95170 | 451.42 | 853 | 830 | 209.0 |
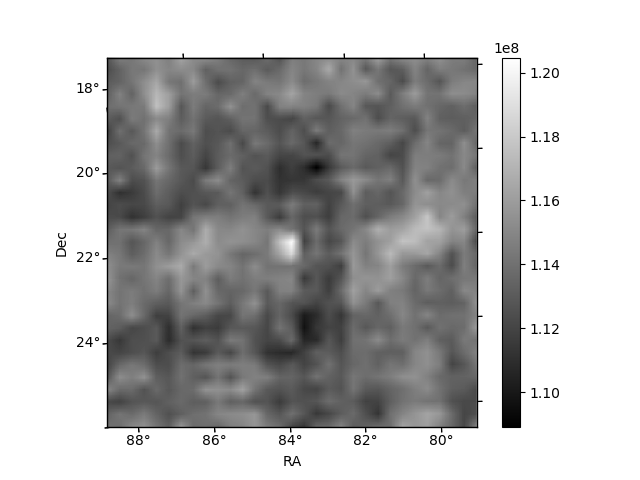
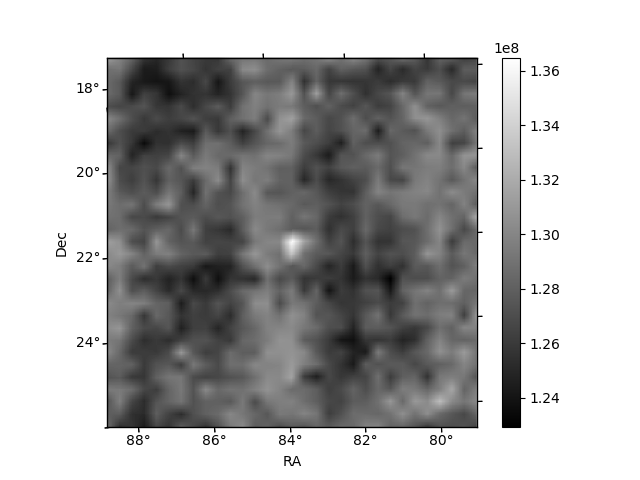
Histogram calculated using DETX and DETY for each event in the final _common_clean file
| Quadrant A |  |
 |
Quadrant B |
|---|---|---|---|
| Quadrant D |  |
 |
Quadrant C |
| Plot type | Count rate plots | Images |
|---|---|---|
| Comparison with Poisson distribution Blue bars denote a histogram of data divided into 1 sec bins. Red curve is a Poisson curve with rate = median count rate of data. |
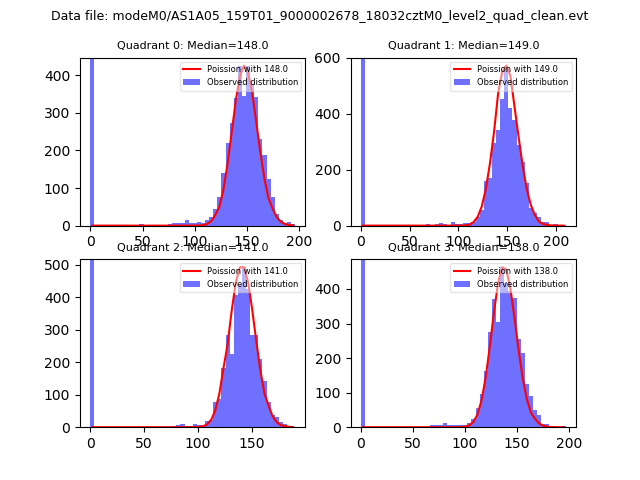 |
 |
| Quadrant-wise count rates Data is divided into 100 sec bins |
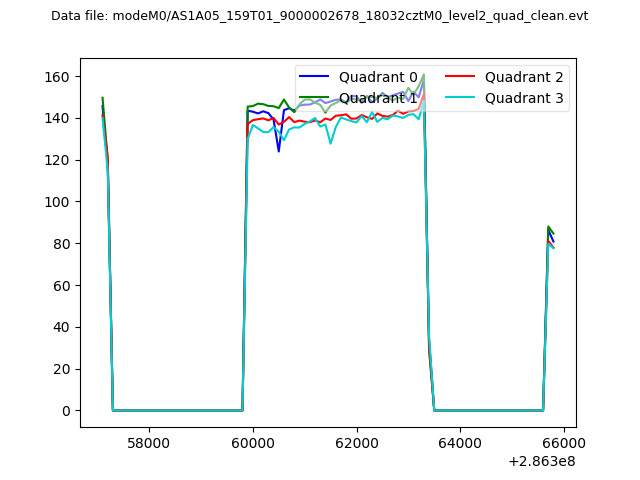 |
|
| Module-wise count rates for Quadrant A Data is divided into 100 sec bins |
 |
 |
| Module-wise count rates for Quadrant B Data is divided into 100 sec bins |
 |
 |
| Module-wise count rates for Quadrant C Data is divided into 100 sec bins |
 |
 |
| Module-wise count rates for Quadrant D Data is divided into 100 sec bins |
 |
 |
| Parameter | Plot |
|---|---|
| CZT HV Monitor |  |
| D_VDD |  |
| Temperature 1 |  |
| Veto HV Monitor |  |
| Veto LLD |  |
| Alpha Counter | 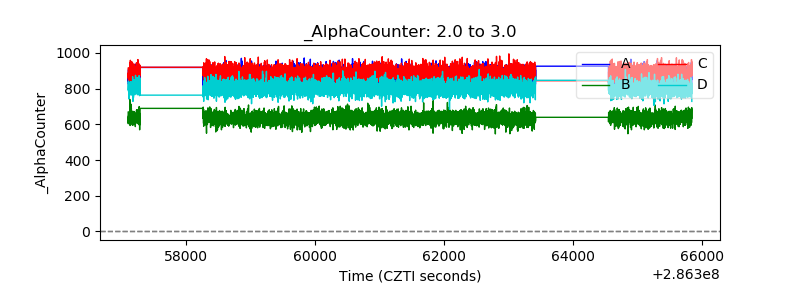 |
| _CPM_Rate | 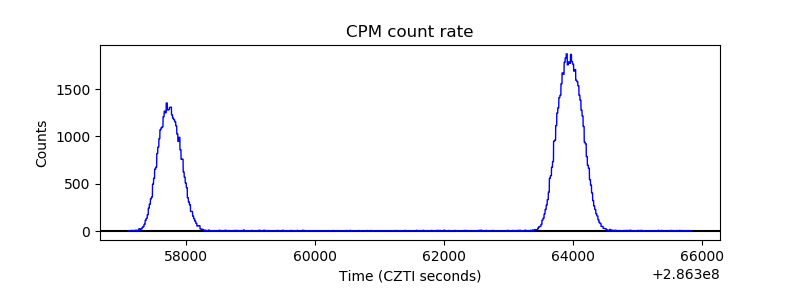 |
| CZT Counter |  |
| +2.5 Volts monitor |  |
| +5 Volts monitor |  |
| _ROLL_ROT |  |
| _Roll_DEC |  |
| _Roll_RA |  |
| Veto Counter |  |