| Param | Original file | Final file |
|---|---|---|
| Filename | modeM0/AS1A05_159T01_9000002678_18037cztM0_level2.evt | modeM0/AS1A05_159T01_9000002678_18037cztM0_level2_quad_clean.evt |
| Size (bytes) | 543,291,840 | 109,520,640 |
| Size | 518.1 MB | 104.4 MB |
| Events in quadrant A | 3,566,800 | 737,446 |
| Events in quadrant B | 3,546,153 | 739,033 |
| Events in quadrant C | 3,791,820 | 693,069 |
| Events in quadrant D | 5,086,362 | 672,253 |
| Mode SS | |||
|---|---|---|---|
| Quadrant | BADHDUFLAG | Total packets | Discarded packets |
| A | 0 | 138 | 0 |
| B | 0 | 138 | 0 |
| C | 0 | 138 | 0 |
| D | 0 | 138 | 0 |
| Mode M9 | |||
|---|---|---|---|
| Quadrant | BADHDUFLAG | Total packets | Discarded packets |
| A | 0 | 11 | 0 |
| B | 0 | 11 | 0 |
| C | 0 | 11 | 0 |
| D | 0 | 11 | 0 |
| Mode M0 | |||
|---|---|---|---|
| Quadrant | BADHDUFLAG | Total packets | Discarded packets |
| A | 0 | 14764 | 1 |
| B | 0 | 14666 | 1 |
| C | 0 | 15594 | 1 |
| D | 0 | 19652 | 1 |
| Quadrant | Total seconds | Saturated seconds | Saturation percentage |
|---|---|---|---|
| A | 6819 | 122 | 1.789119% |
| B | 6819 | 121 | 1.774454% |
| C | 6819 | 139 | 2.038422% |
| D | 6819 | 369 | 5.411351% |
Noise dominated data is calculated using 1-second bins in cleaned event files. If a bin has >2000 counts, and if more than 50% of those come from <1% of pixels, then it is considered to be noise-dominated and hence unusable.
| Quadrant | # 1 sec bins | Bins with >0 counts | Bins with >2000 counts | High rate bins dominated by noise | Noise dominated (total time) | Noise dominated (detector-on time) | Marked lightcurve |
|---|---|---|---|---|---|---|---|
| A | 7829 | 6820 | 25 | 25 | 0.32% | 0.37% | 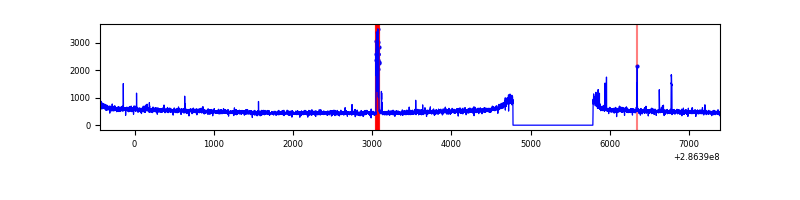 |
| B | 7829 | 6820 | 8 | 8 | 0.10% | 0.12% | 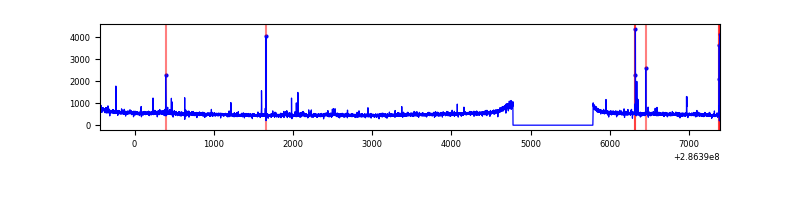 |
| C | 7829 | 6820 | 1 | 1 | 0.01% | 0.01% | 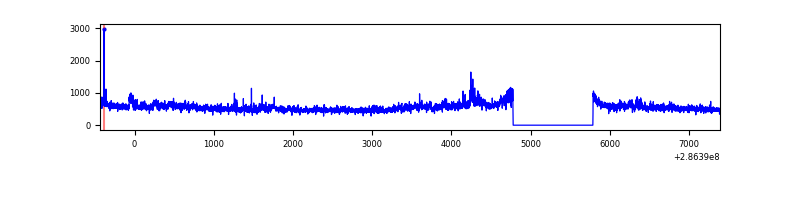 |
| D | 7829 | 6820 | 208 | 208 | 2.66% | 3.05% | 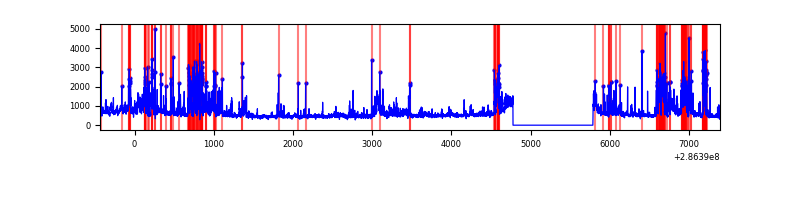 |
Top three noisy pixels from each quadrant. If the there are fewer than three noisy pixels in the level2.evt file, extra rows are filled as -1
| Pixel properties | Quadrant properties | ||||||
|---|---|---|---|---|---|---|---|
| Quadrant | DetID | PixID | Counts | Sigma | Mean | Median | Sigma |
| A | 15 | 174 | 125469 | 686.36 | 892 | 874 | 181.5 |
| A | 8 | 34 | 10239 | 51.59 | 892 | 874 | 181.5 |
| A | 0 | 226 | 7858 | 38.47 | 892 | 874 | 181.5 |
| B | 7 | 220 | 42240 | 242.75 | 886 | 868 | 170.4 |
| B | 12 | 111 | 18553 | 103.77 | 886 | 868 | 170.4 |
| B | 11 | 111 | 16276 | 90.41 | 886 | 868 | 170.4 |
| C | 3 | 233 | 248689 | 1248.62 | 843 | 851 | 198.5 |
| C | 14 | 238 | 131818 | 659.82 | 843 | 851 | 198.5 |
| C | 8 | 208 | 111544 | 557.68 | 843 | 851 | 198.5 |
| D | 5 | 222 | 923760 | 4380.73 | 855 | 832 | 210.7 |
| D | 11 | 176 | 393544 | 1864.03 | 855 | 832 | 210.7 |
| D | 7 | 238 | 252939 | 1196.64 | 855 | 832 | 210.7 |
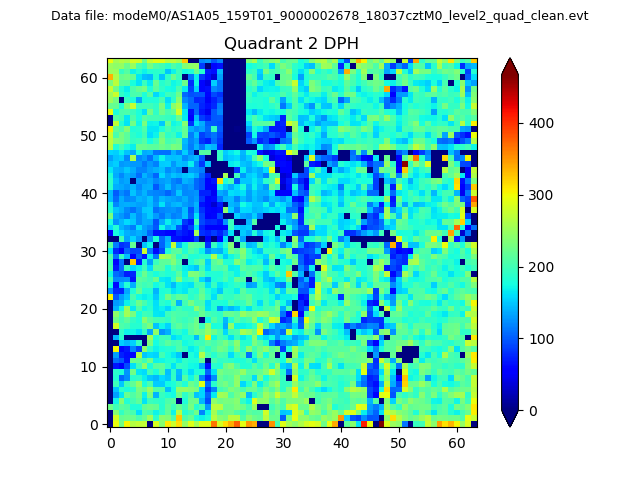
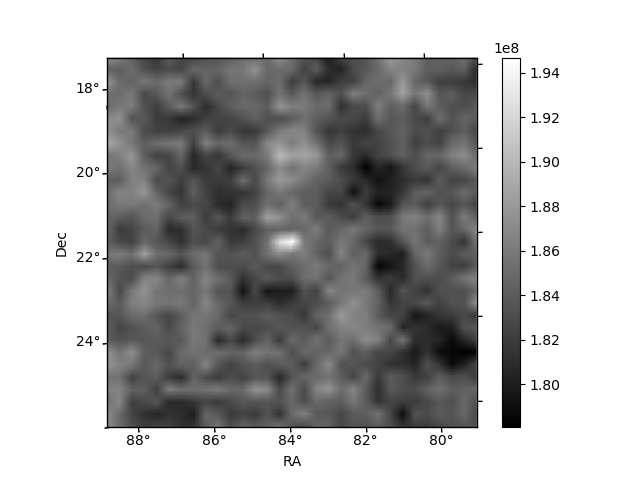
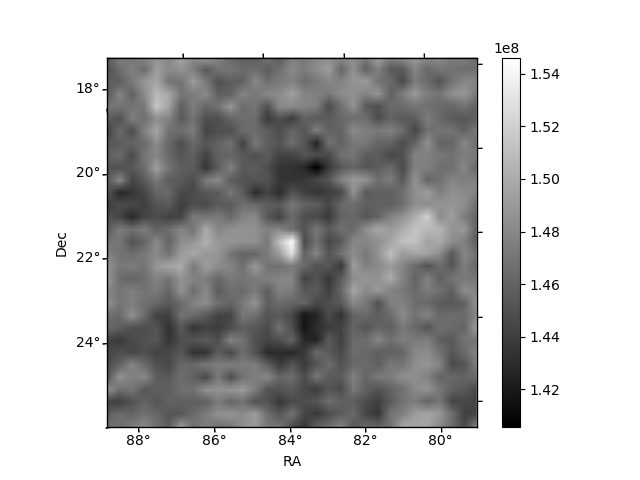
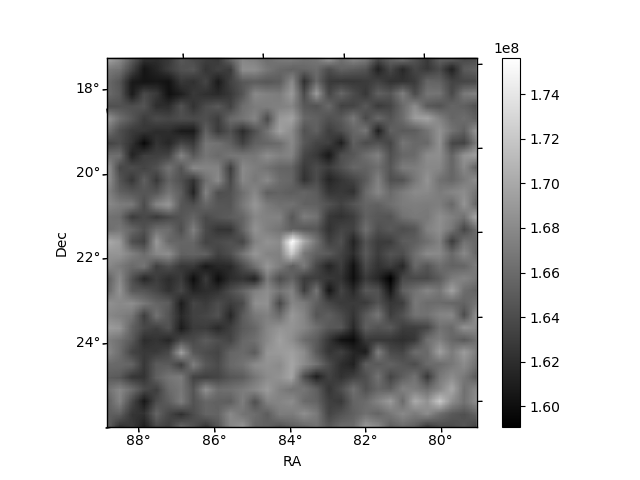
Histogram calculated using DETX and DETY for each event in the final _common_clean file
| Quadrant A | 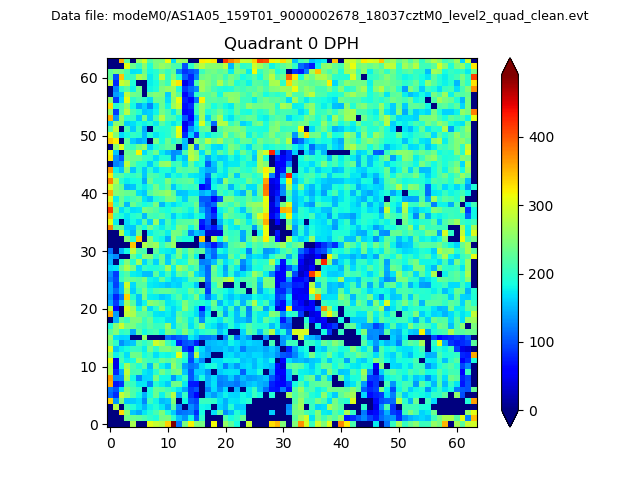 |
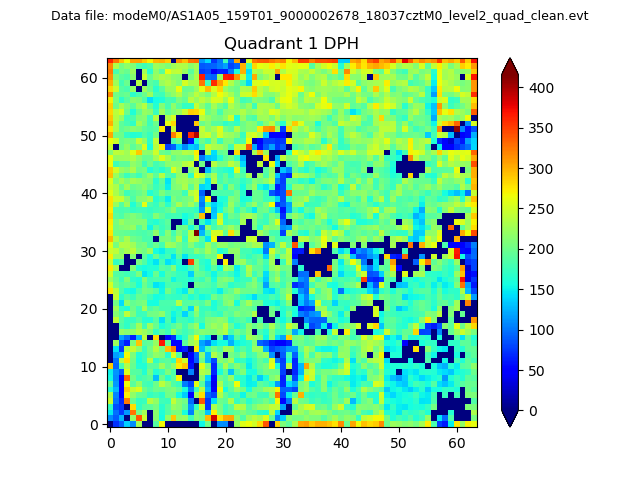 |
Quadrant B |
|---|---|---|---|
| Quadrant D | 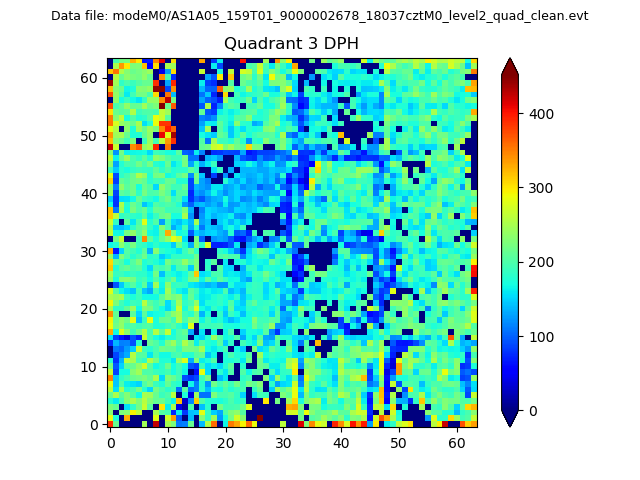 |
 |
Quadrant C |
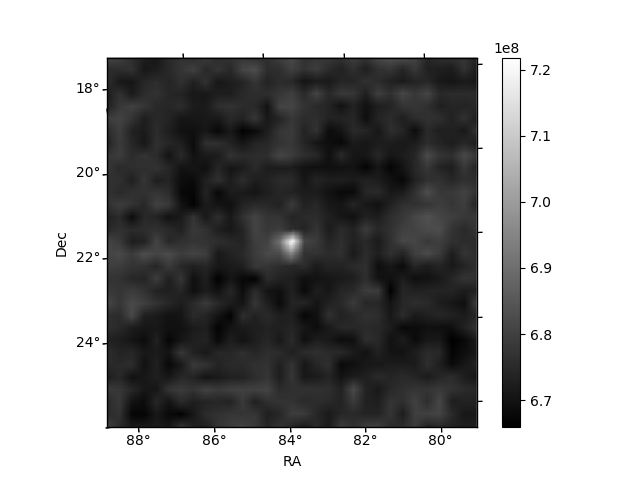
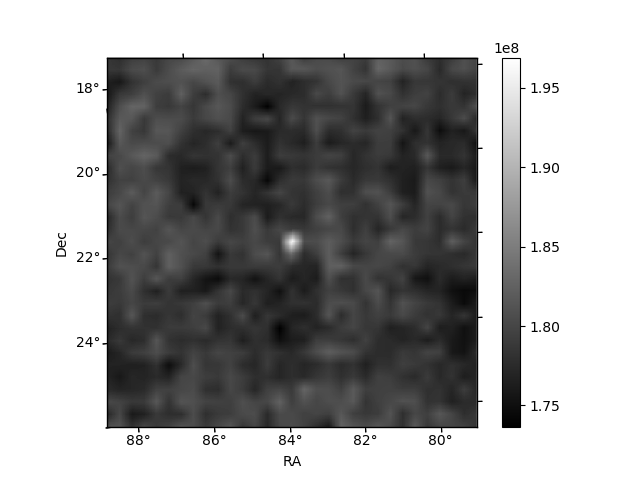
| Plot type | Count rate plots | Images |
|---|---|---|
| Comparison with Poisson distribution Blue bars denote a histogram of data divided into 1 sec bins. Red curve is a Poisson curve with rate = median count rate of data. |
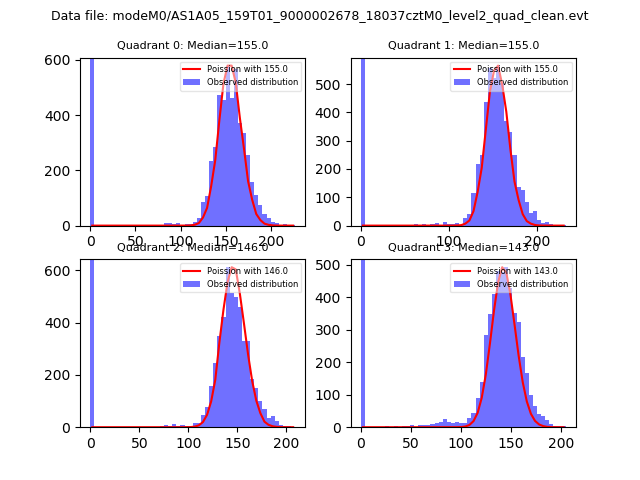 |
 |
| Quadrant-wise count rates Data is divided into 100 sec bins |
 |
|
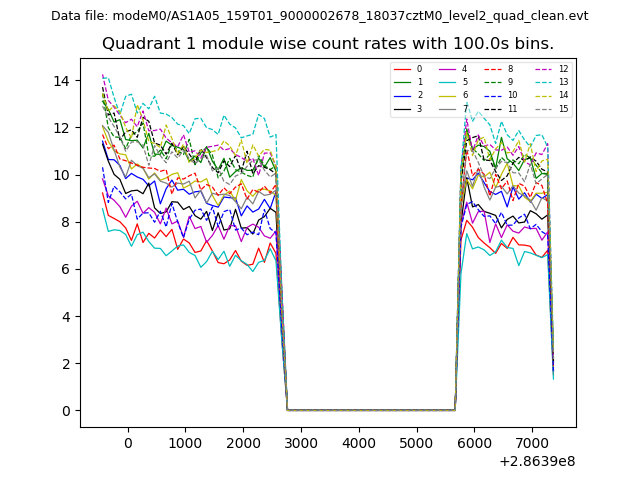
| Module-wise count rates for Quadrant A Data is divided into 100 sec bins |
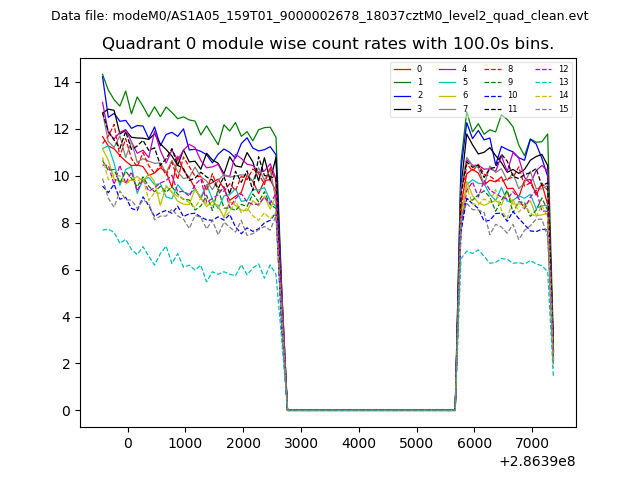 |
 |
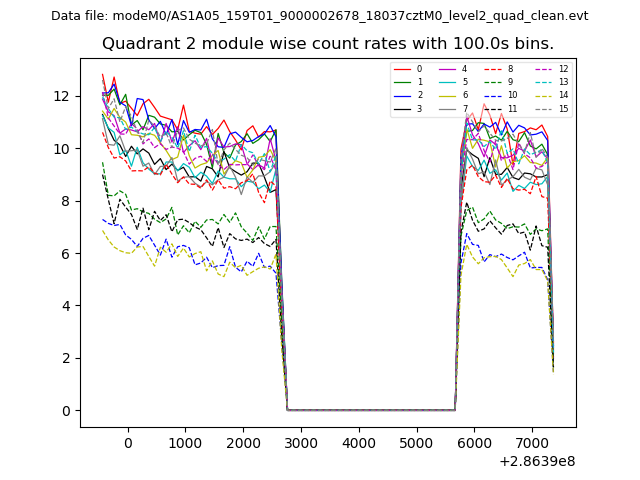
| Module-wise count rates for Quadrant B Data is divided into 100 sec bins |
 |
 |
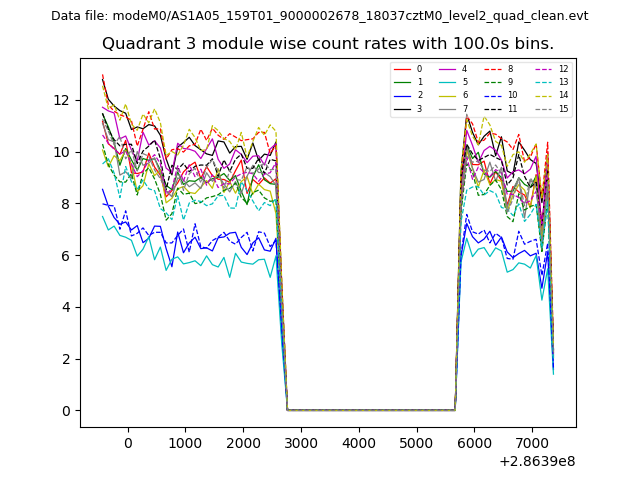
| Module-wise count rates for Quadrant C Data is divided into 100 sec bins |
 |
 |
| Module-wise count rates for Quadrant D Data is divided into 100 sec bins |
 |
 |
| Parameter | Plot |
|---|---|
| CZT HV Monitor | 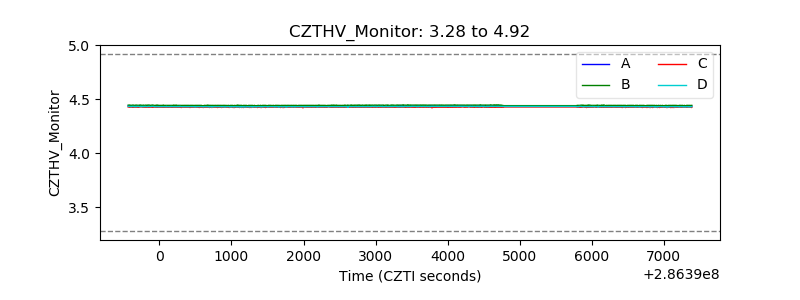 |
| D_VDD | 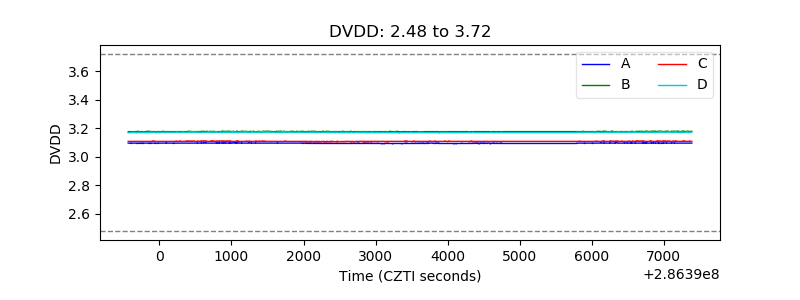 |
| Temperature 1 | 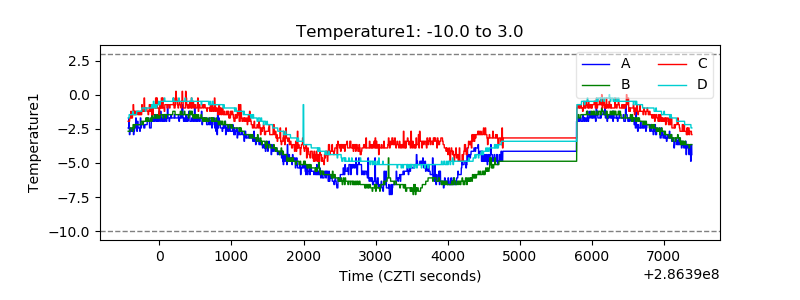 |
| Veto HV Monitor |  |
| Veto LLD | 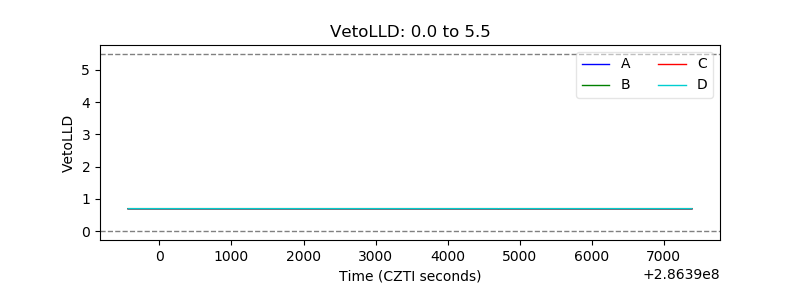 |
| Alpha Counter | 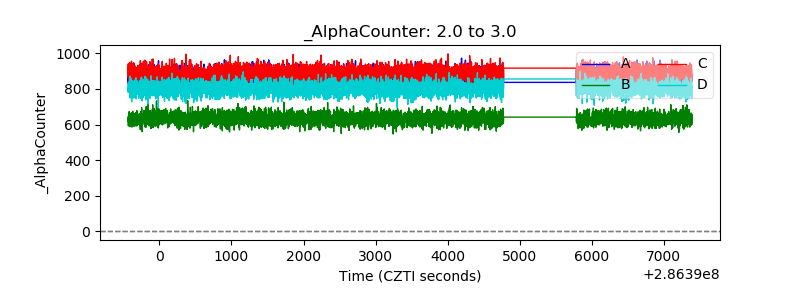 |
| _CPM_Rate |  |
| CZT Counter | 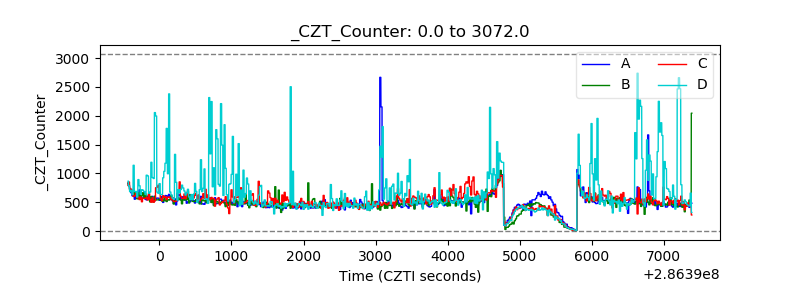 |
| +2.5 Volts monitor | 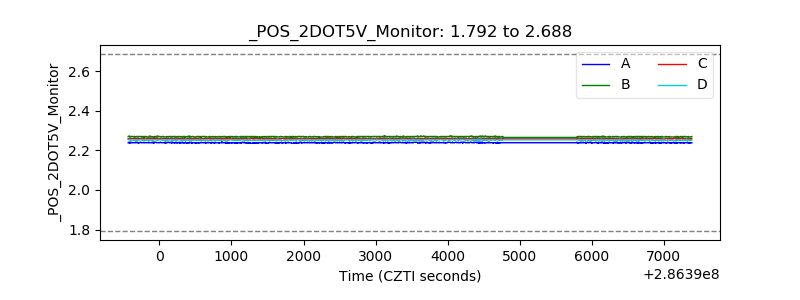 |
| +5 Volts monitor |  |
| _ROLL_ROT | 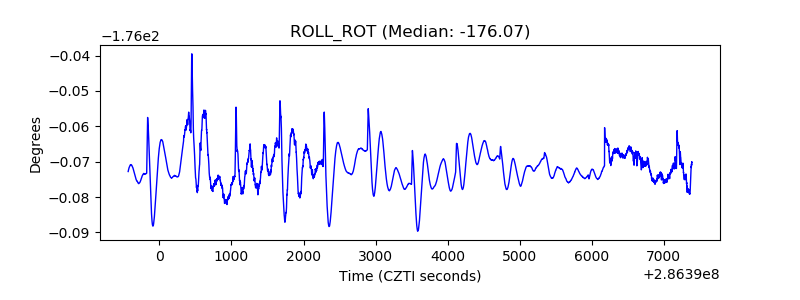 |
| _Roll_DEC | 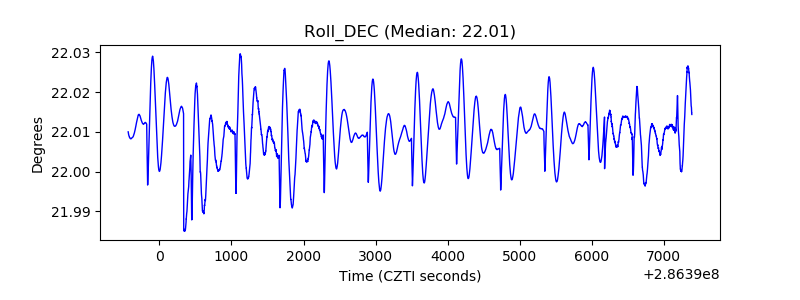 |
| _Roll_RA | 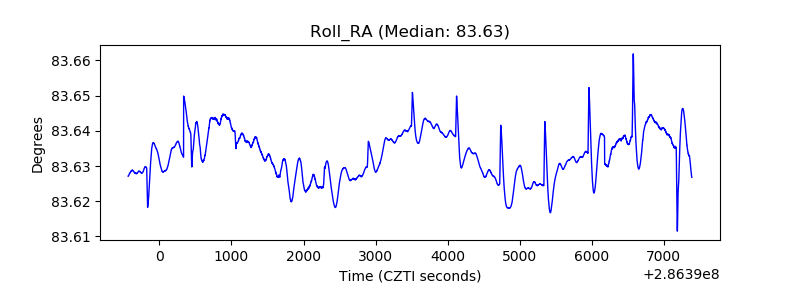 |
| Veto Counter | 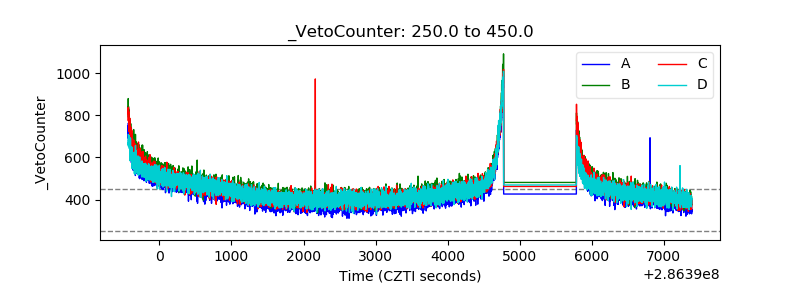 |