| Param | Original file | Final file |
|---|---|---|
| Filename | modeM0/AS1A05_101T02_9000002680_18043cztM0_level2.evt | modeM0/AS1A05_101T02_9000002680_18043cztM0_level2_quad_clean.evt |
| Size (bytes) | 903,432,960 | 138,588,480 |
| Size | 861.6 MB | 132.2 MB |
| Events in quadrant A | 5,393,609 | 864,806 |
| Events in quadrant B | 5,532,456 | 885,624 |
| Events in quadrant C | 5,562,030 | 856,127 |
| Events in quadrant D | 10,082,639 | 782,743 |
| Mode M0 | |||
|---|---|---|---|
| Quadrant | BADHDUFLAG | Total packets | Discarded packets |
| A | 0 | 23882 | 2 |
| B | 0 | 24016 | 2 |
| C | 0 | 23880 | 2 |
| D | 0 | 37813 | 2 |
| Mode M9 | |||
|---|---|---|---|
| Quadrant | BADHDUFLAG | Total packets | Discarded packets |
| A | 0 | 14 | 0 |
| B | 0 | 14 | 0 |
| C | 0 | 14 | 0 |
| D | 0 | 14 | 0 |
| Mode SS | |||
|---|---|---|---|
| Quadrant | BADHDUFLAG | Total packets | Discarded packets |
| A | 0 | 236 | 0 |
| B | 0 | 236 | 0 |
| C | 0 | 236 | 0 |
| D | 0 | 236 | 0 |
| Quadrant | Total seconds | Saturated seconds | Saturation percentage |
|---|---|---|---|
| A | 11679 | 80 | 0.684990% |
| B | 11679 | 113 | 0.967549% |
| C | 11679 | 141 | 1.207295% |
| D | 11679 | 1181 | 10.112167% |
Noise dominated data is calculated using 1-second bins in cleaned event files. If a bin has >2000 counts, and if more than 50% of those come from <1% of pixels, then it is considered to be noise-dominated and hence unusable.
| Quadrant | # 1 sec bins | Bins with >0 counts | Bins with >2000 counts | High rate bins dominated by noise | Noise dominated (total time) | Noise dominated (detector-on time) | Marked lightcurve |
|---|---|---|---|---|---|---|---|
| A | 13064 | 11681 | 5 | 5 | 0.04% | 0.04% | 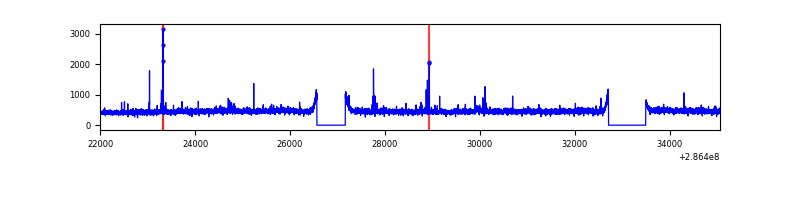 |
| B | 13064 | 11681 | 6 | 6 | 0.05% | 0.05% | 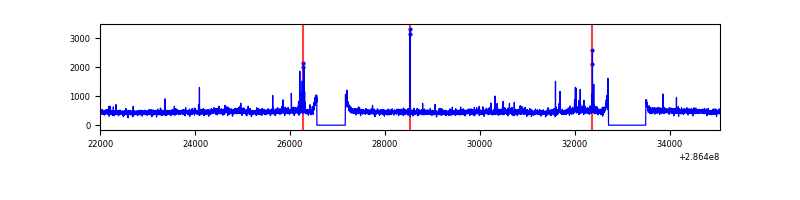 |
| C | 13064 | 11681 | 0 | 0 | 0.00% | 0.00% | 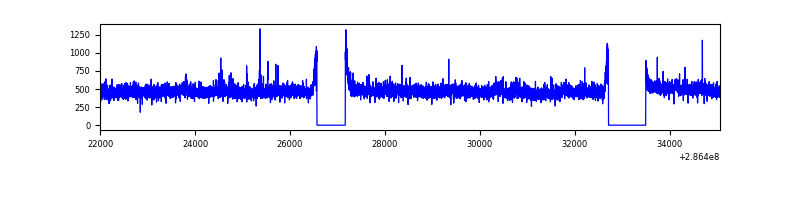 |
| D | 13064 | 11681 | 992 | 992 | 7.59% | 8.49% | 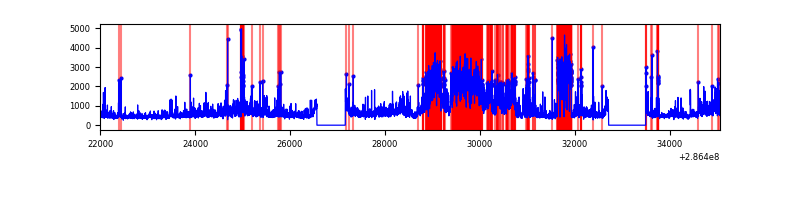 |
Top three noisy pixels from each quadrant. If the there are fewer than three noisy pixels in the level2.evt file, extra rows are filled as -1
| Pixel properties | Quadrant properties | ||||||
|---|---|---|---|---|---|---|---|
| Quadrant | DetID | PixID | Counts | Sigma | Mean | Median | Sigma |
| A | 15 | 174 | 51005 | 178.92 | 1380 | 1348 | 277.5 |
| A | 4 | 2 | 39099 | 136.02 | 1380 | 1348 | 277.5 |
| A | 0 | 226 | 11930 | 38.13 | 1380 | 1348 | 277.5 |
| B | 0 | 197 | 61144 | 225.52 | 1383 | 1347 | 265.2 |
| B | 12 | 111 | 31157 | 112.43 | 1383 | 1347 | 265.2 |
| B | 11 | 111 | 26746 | 95.79 | 1383 | 1347 | 265.2 |
| C | 14 | 238 | 208143 | 658.3 | 1331 | 1336 | 314.2 |
| C | 3 | 233 | 84333 | 264.19 | 1331 | 1336 | 314.2 |
| C | 8 | 208 | 71785 | 224.25 | 1331 | 1336 | 314.2 |
| D | 7 | 238 | 3342325 | 10577.46 | 1297 | 1259 | 315.9 |
| D | 1 | 52 | 778208 | 2459.74 | 1297 | 1259 | 315.9 |
| D | 11 | 176 | 725125 | 2291.68 | 1297 | 1259 | 315.9 |
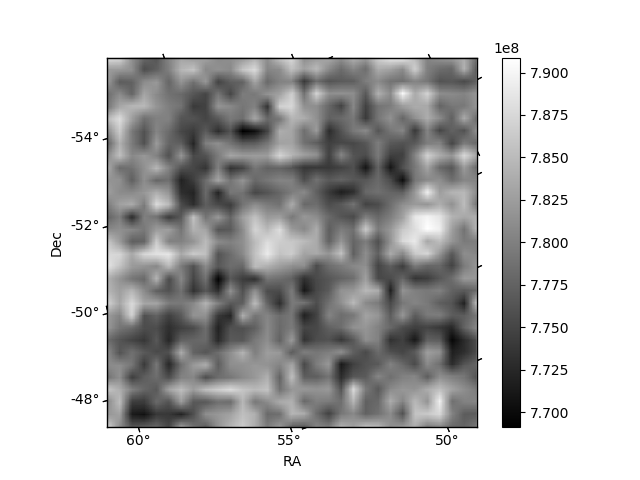
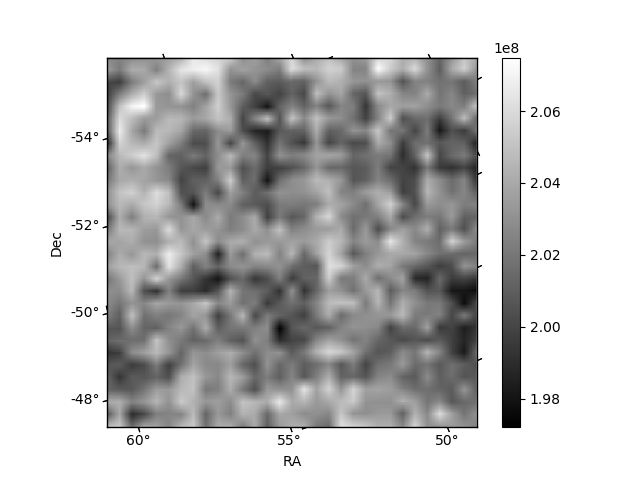
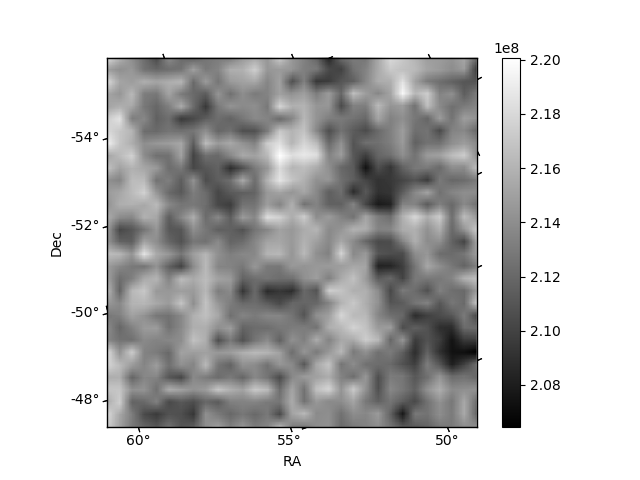
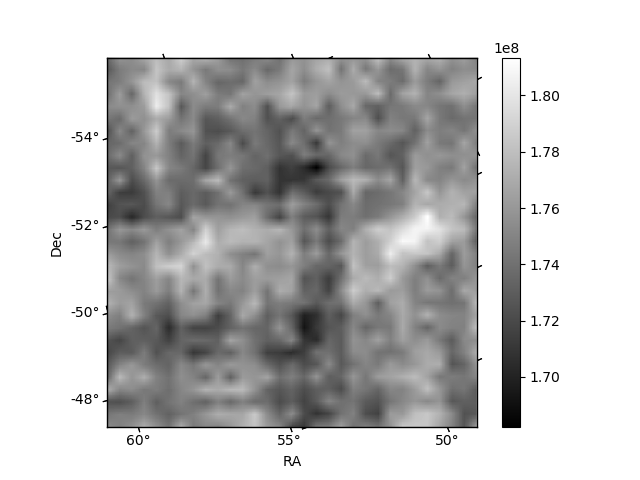
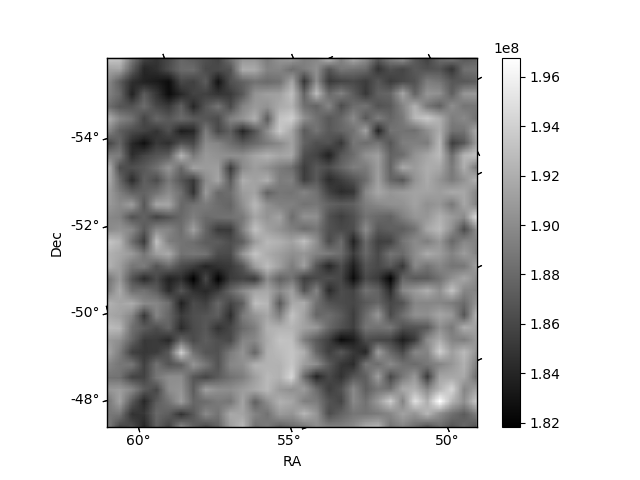
Histogram calculated using DETX and DETY for each event in the final _common_clean file
| Quadrant A | 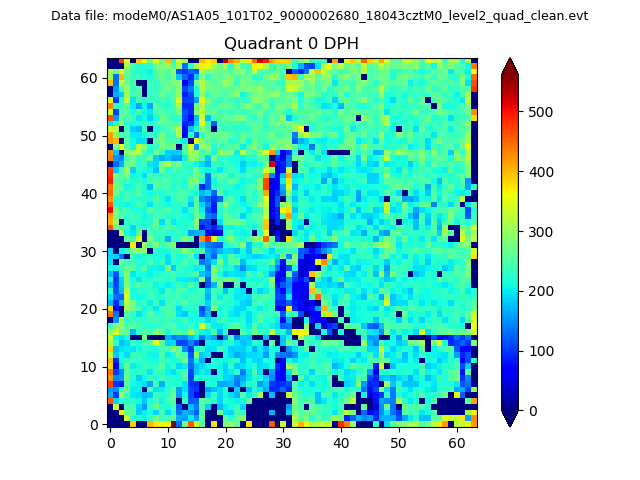 |
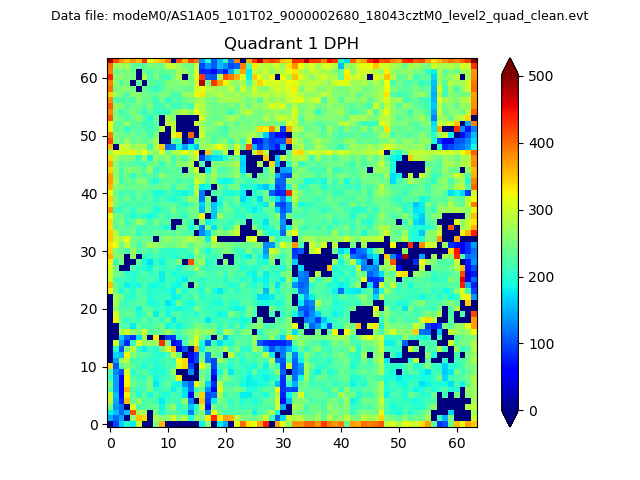 |
Quadrant B |
|---|---|---|---|
| Quadrant D | 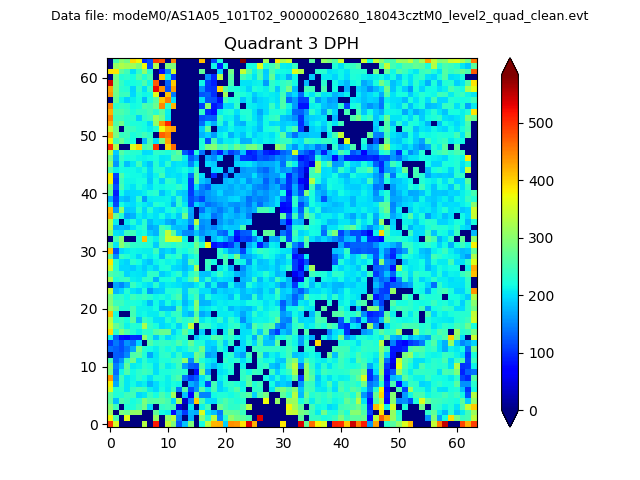 |
 |
Quadrant C |
| Plot type | Count rate plots | Images |
|---|---|---|
| Comparison with Poisson distribution Blue bars denote a histogram of data divided into 1 sec bins. Red curve is a Poisson curve with rate = median count rate of data. |
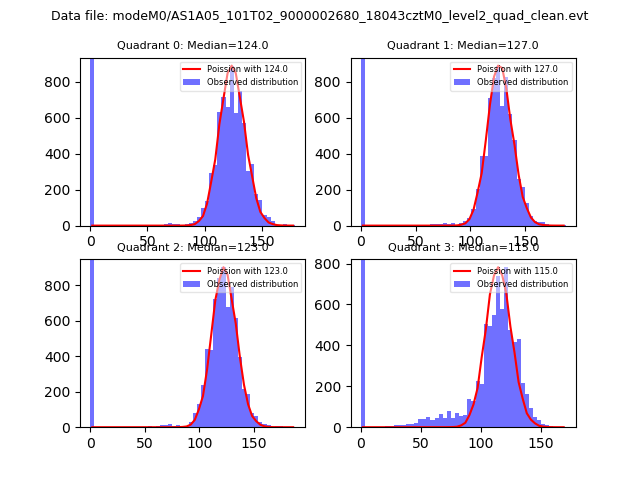 |
 |
| Quadrant-wise count rates Data is divided into 100 sec bins |
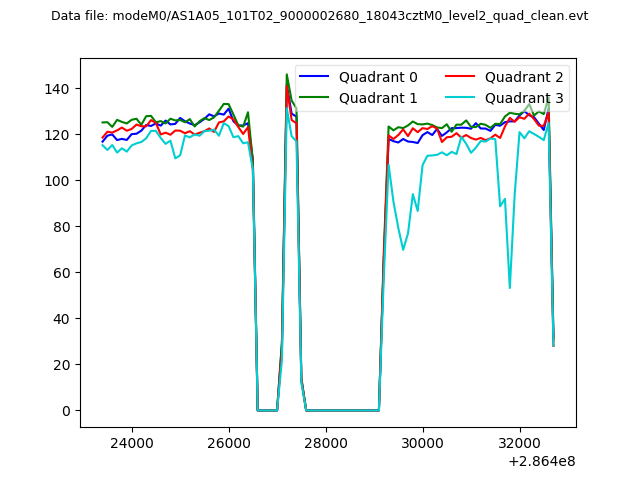 |
|
| Module-wise count rates for Quadrant A Data is divided into 100 sec bins |
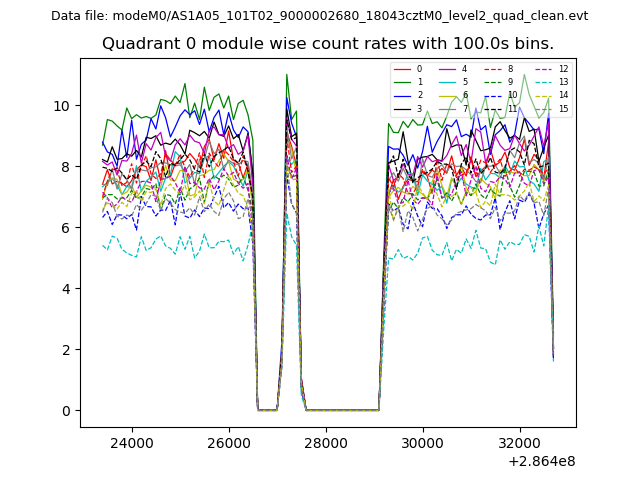 |
 |
| Module-wise count rates for Quadrant B Data is divided into 100 sec bins |
 |
 |
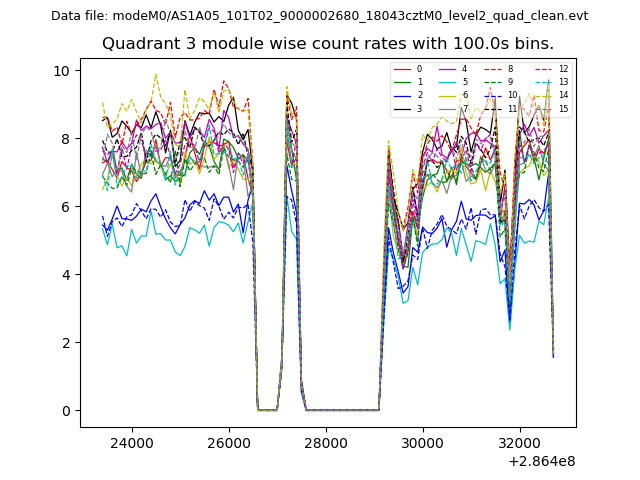
| Module-wise count rates for Quadrant C Data is divided into 100 sec bins |
 |
 |
| Module-wise count rates for Quadrant D Data is divided into 100 sec bins |
 |
 |
| Parameter | Plot |
|---|---|
| CZT HV Monitor | 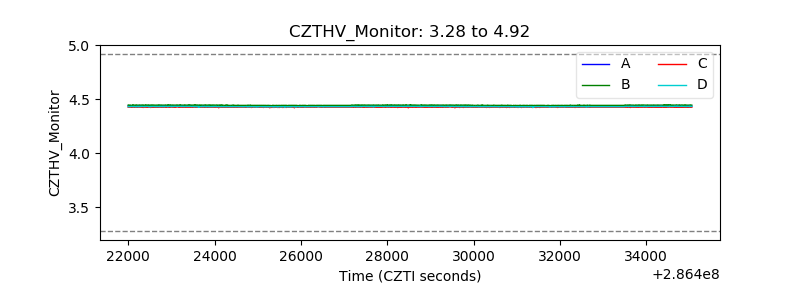 |
| D_VDD | 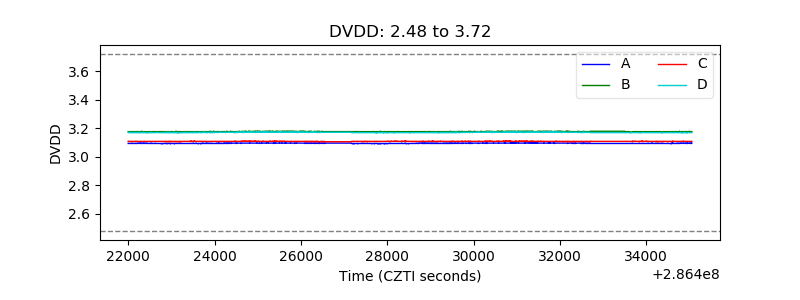 |
| Temperature 1 |  |
| Veto HV Monitor | 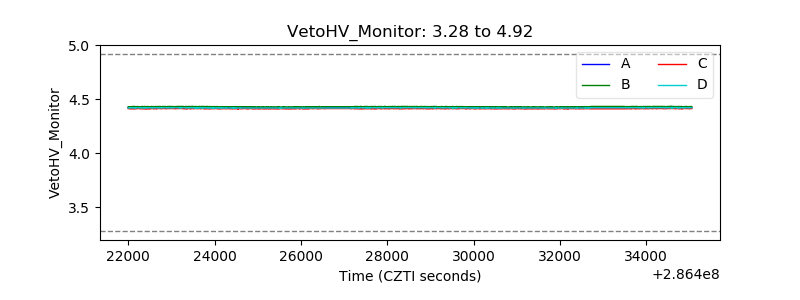 |
| Veto LLD | 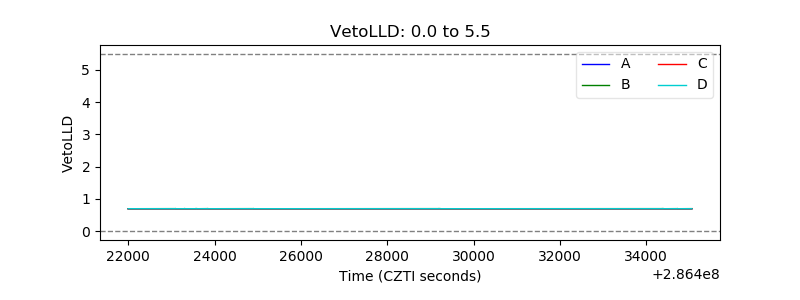 |
| Alpha Counter |  |
| _CPM_Rate | 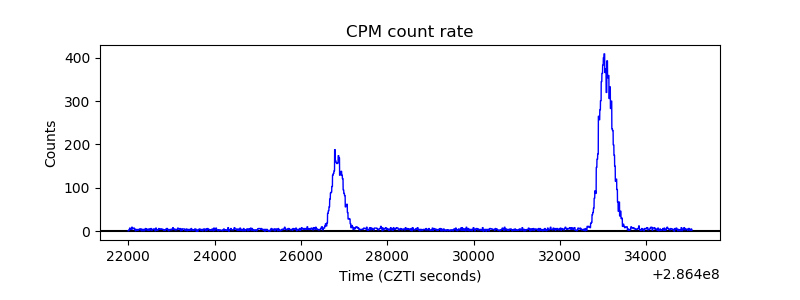 |
| CZT Counter | 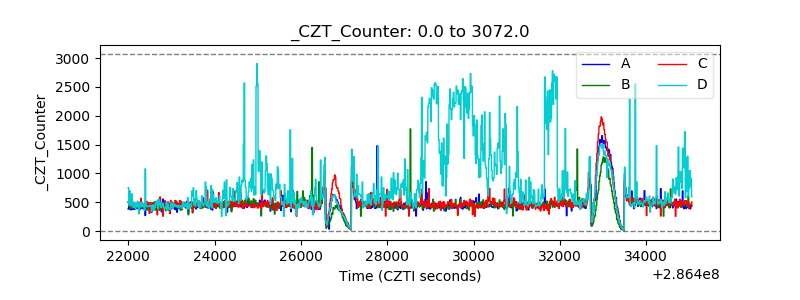 |
| +2.5 Volts monitor |  |
| +5 Volts monitor | 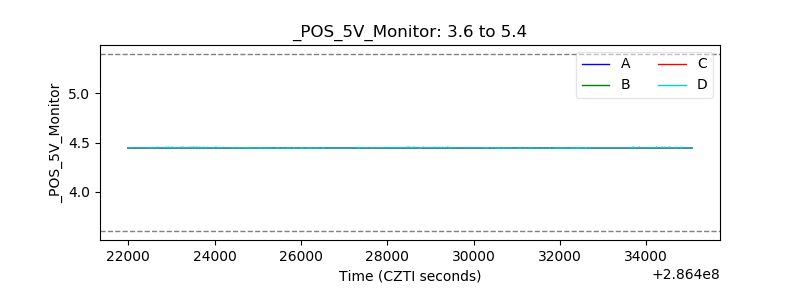 |
| _ROLL_ROT | 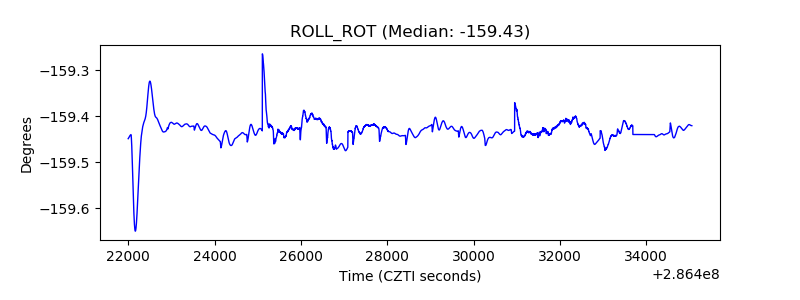 |
| _Roll_DEC | 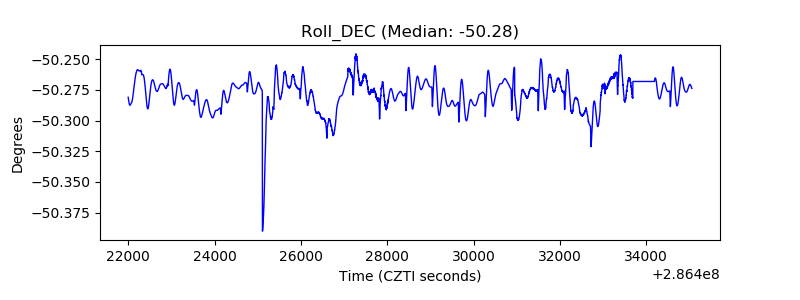 |
| _Roll_RA |  |
| Veto Counter | 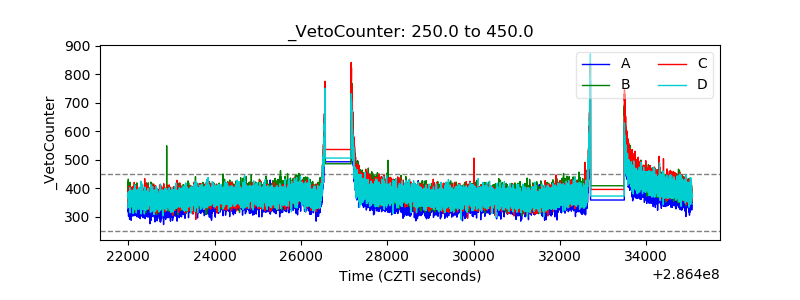 |