| Param | Original file | Final file |
|---|---|---|
| Filename | modeM0/AS1A05_101T02_9000002680_18044cztM0_level2.evt | modeM0/AS1A05_101T02_9000002680_18044cztM0_level2_quad_clean.evt |
| Size (bytes) | 524,496,960 | 80,907,840 |
| Size | 500.2 MB | 77.2 MB |
| Events in quadrant A | 3,265,738 | 499,578 |
| Events in quadrant B | 3,298,701 | 512,029 |
| Events in quadrant C | 3,310,598 | 497,718 |
| Events in quadrant D | 5,549,120 | 467,426 |
| Mode M0 | |||
|---|---|---|---|
| Quadrant | BADHDUFLAG | Total packets | Discarded packets |
| A | 0 | 14072 | 2 |
| B | 0 | 14029 | 2 |
| C | 0 | 14019 | 2 |
| D | 0 | 21197 | 2 |
| Mode M9 | |||
|---|---|---|---|
| Quadrant | BADHDUFLAG | Total packets | Discarded packets |
| A | 0 | 11 | 0 |
| B | 0 | 12 | 0 |
| C | 0 | 12 | 0 |
| D | 0 | 12 | 0 |
| Mode SS | |||
|---|---|---|---|
| Quadrant | BADHDUFLAG | Total packets | Discarded packets |
| A | 0 | 138 | 0 |
| B | 0 | 138 | 0 |
| C | 0 | 138 | 0 |
| D | 0 | 138 | 0 |
| Quadrant | Total seconds | Saturated seconds | Saturation percentage |
|---|---|---|---|
| A | 6790 | 55 | 0.810015% |
| B | 6790 | 52 | 0.765832% |
| C | 6790 | 86 | 1.266568% |
| D | 6790 | 171 | 2.518409% |
Noise dominated data is calculated using 1-second bins in cleaned event files. If a bin has >2000 counts, and if more than 50% of those come from <1% of pixels, then it is considered to be noise-dominated and hence unusable.
| Quadrant | # 1 sec bins | Bins with >0 counts | Bins with >2000 counts | High rate bins dominated by noise | Noise dominated (total time) | Noise dominated (detector-on time) | Marked lightcurve |
|---|---|---|---|---|---|---|---|
| A | 7730 | 6791 | 16 | 16 | 0.21% | 0.24% |  |
| B | 7730 | 6791 | 4 | 4 | 0.05% | 0.06% |  |
| C | 7730 | 6791 | 0 | 0 | 0.00% | 0.00% |  |
| D | 7730 | 6791 | 99 | 99 | 1.28% | 1.46% | 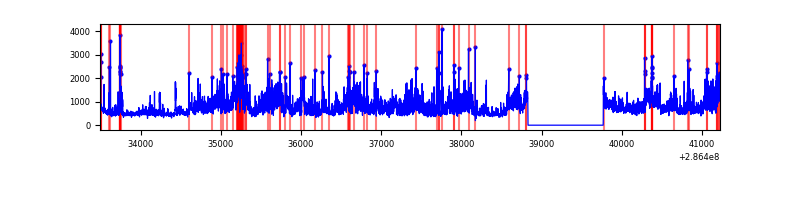 |
Top three noisy pixels from each quadrant. If the there are fewer than three noisy pixels in the level2.evt file, extra rows are filled as -1
| Pixel properties | Quadrant properties | ||||||
|---|---|---|---|---|---|---|---|
| Quadrant | DetID | PixID | Counts | Sigma | Mean | Median | Sigma |
| A | 4 | 2 | 59593 | 354.75 | 821 | 804 | 165.7 |
| A | 15 | 174 | 51667 | 306.92 | 821 | 804 | 165.7 |
| A | 0 | 226 | 6998 | 37.38 | 821 | 804 | 165.7 |
| B | 0 | 197 | 31534 | 195.67 | 826 | 805 | 157.0 |
| B | 12 | 111 | 18400 | 112.04 | 826 | 805 | 157.0 |
| B | 11 | 111 | 15569 | 94.01 | 826 | 805 | 157.0 |
| C | 14 | 238 | 126541 | 672.82 | 798 | 800 | 186.9 |
| C | 8 | 208 | 49808 | 262.23 | 798 | 800 | 186.9 |
| C | 3 | 233 | 15103 | 76.53 | 798 | 800 | 186.9 |
| D | 7 | 238 | 1590020 | 8178.21 | 791 | 767 | 194.3 |
| D | 1 | 52 | 539764 | 2773.65 | 791 | 767 | 194.3 |
| D | 5 | 222 | 218588 | 1120.89 | 791 | 767 | 194.3 |
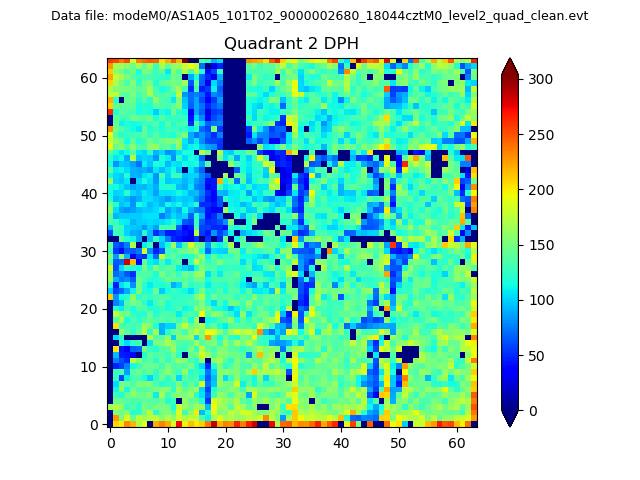
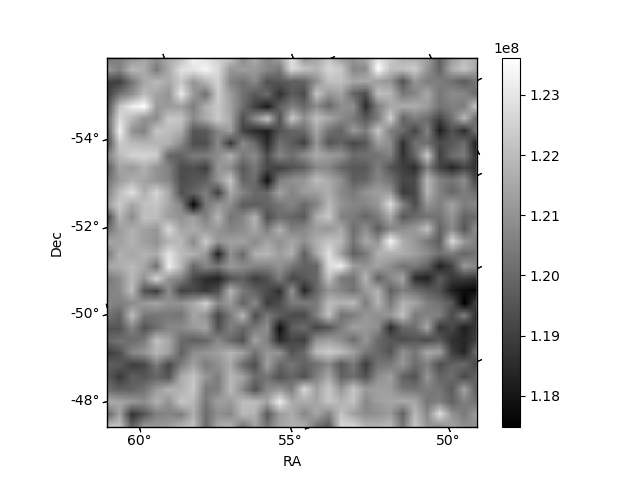
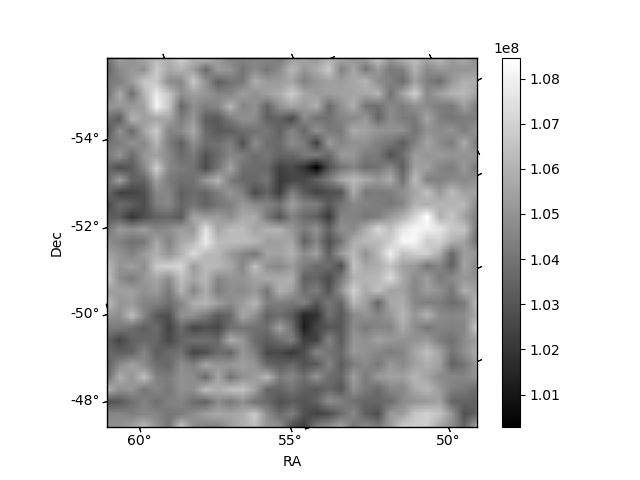
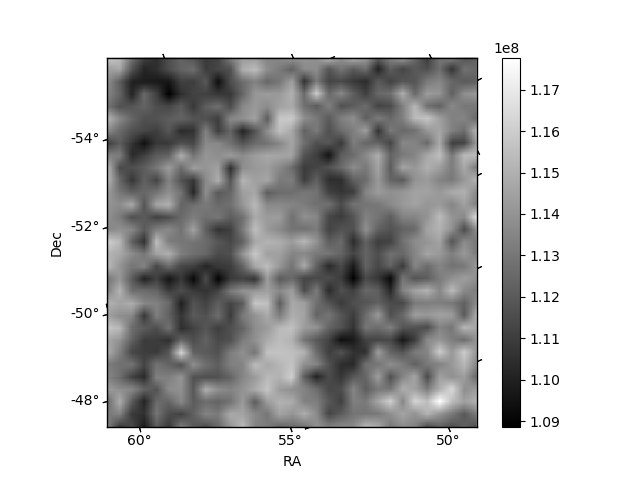
Histogram calculated using DETX and DETY for each event in the final _common_clean file
| Quadrant A |  |
 |
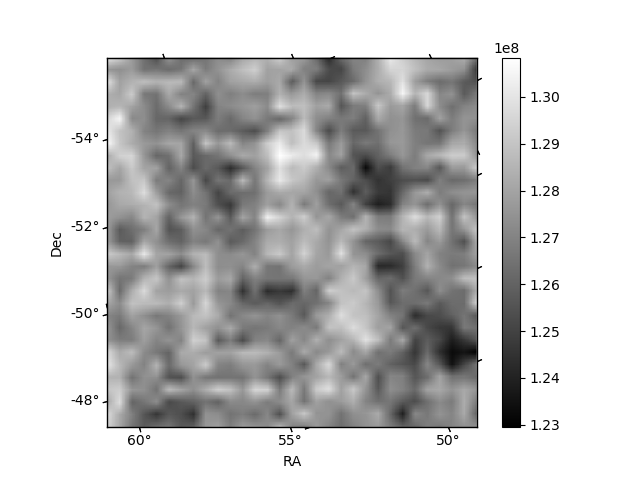
Quadrant B |
|---|---|---|---|
| Quadrant D | 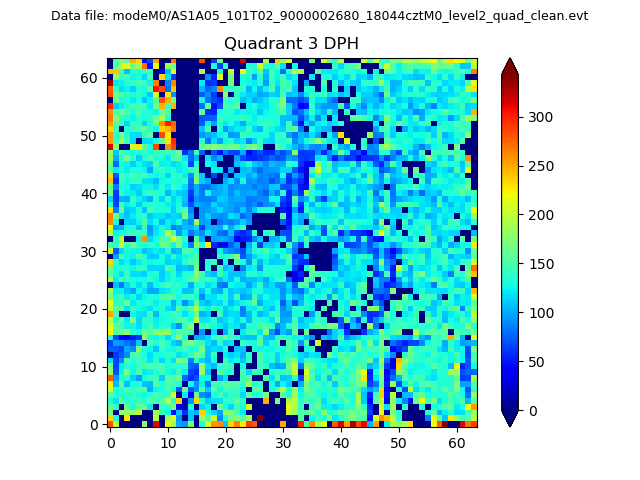 |
 |
Quadrant C |
| Plot type | Count rate plots | Images |
|---|---|---|
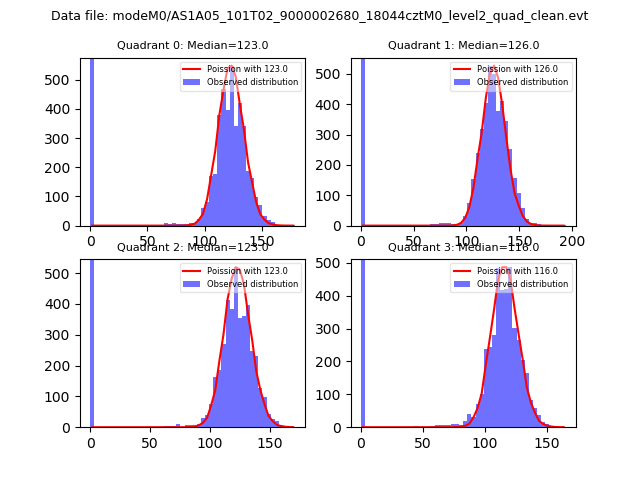
| Comparison with Poisson distribution Blue bars denote a histogram of data divided into 1 sec bins. Red curve is a Poisson curve with rate = median count rate of data. |
 |
 |
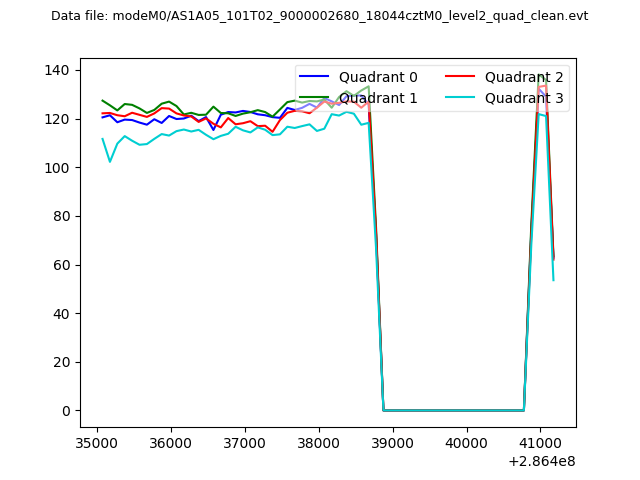
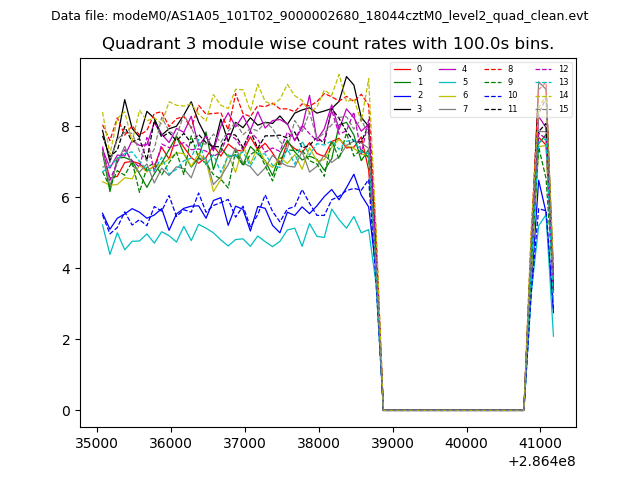
| Quadrant-wise count rates Data is divided into 100 sec bins |
 |
|
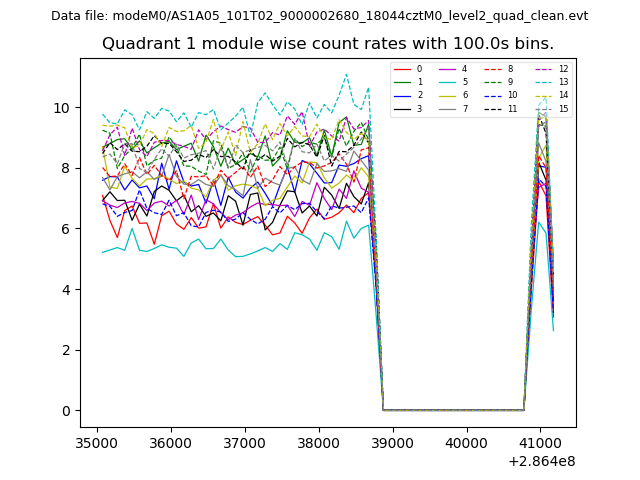
| Module-wise count rates for Quadrant A Data is divided into 100 sec bins |
 |
 |
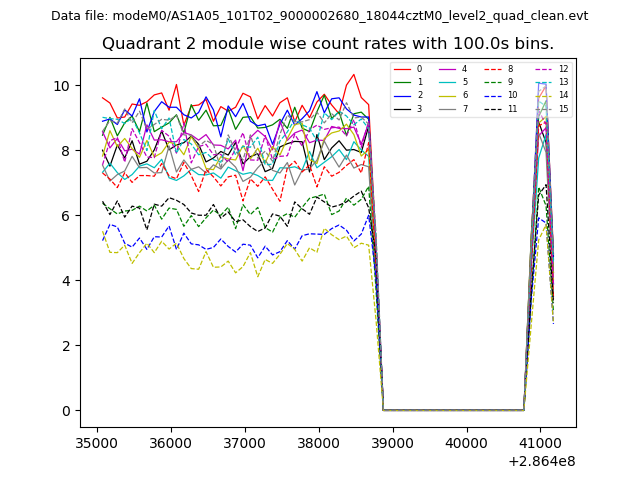
| Module-wise count rates for Quadrant B Data is divided into 100 sec bins |
 |
 |
| Module-wise count rates for Quadrant C Data is divided into 100 sec bins |
 |
 |
| Module-wise count rates for Quadrant D Data is divided into 100 sec bins |
 |
 |
| Parameter | Plot |
|---|---|
| CZT HV Monitor | 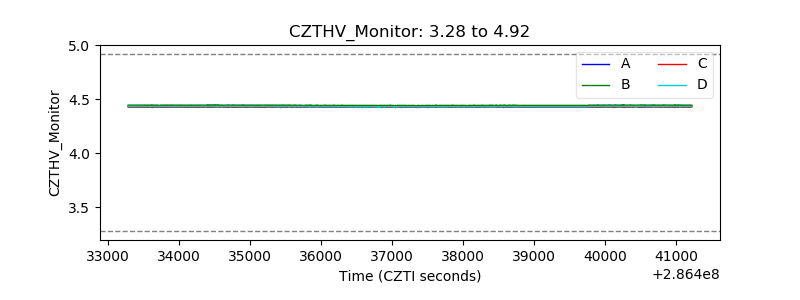 |
| D_VDD | 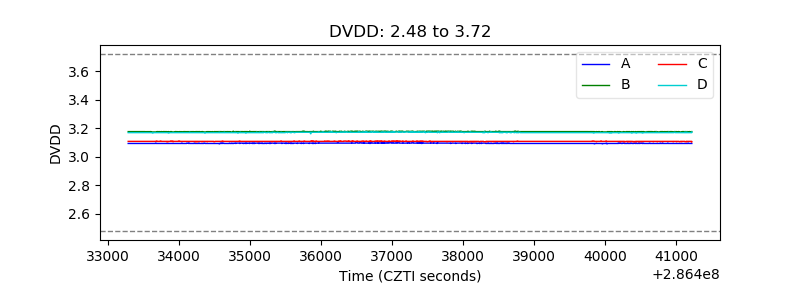 |
| Temperature 1 | 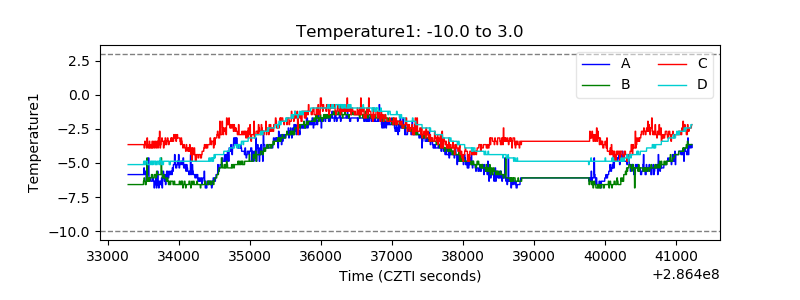 |
| Veto HV Monitor | 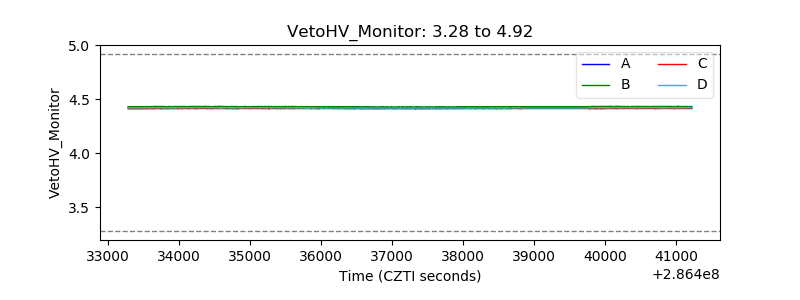 |
| Veto LLD |  |
| Alpha Counter | 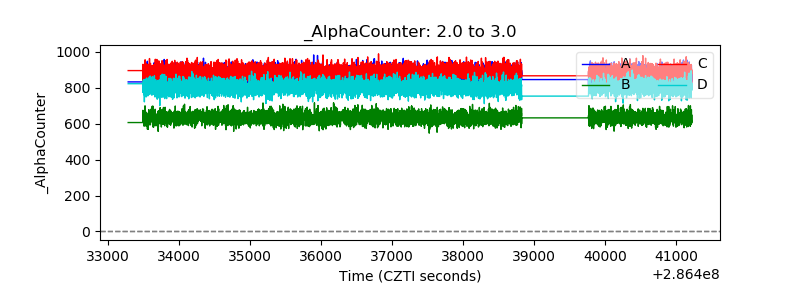 |
| _CPM_Rate | 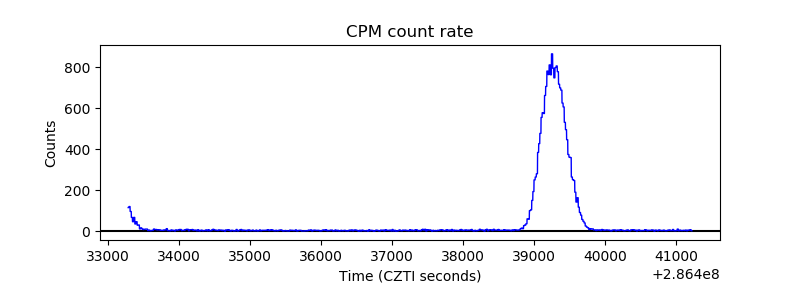 |
| CZT Counter |  |
| +2.5 Volts monitor |  |
| +5 Volts monitor | 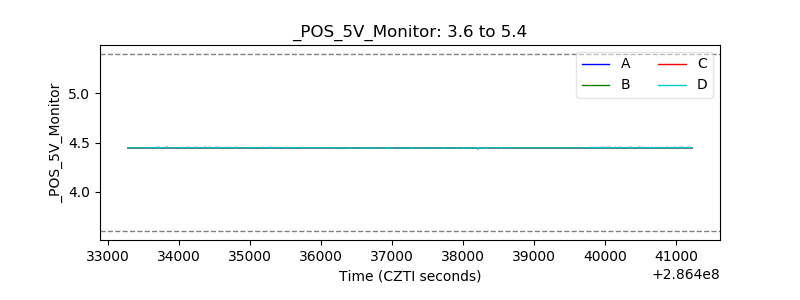 |
| _ROLL_ROT | 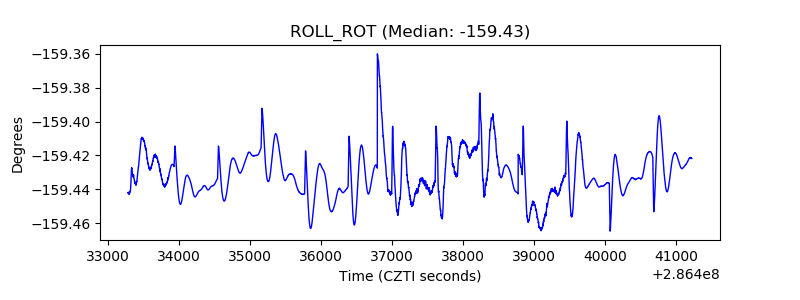 |
| _Roll_DEC | 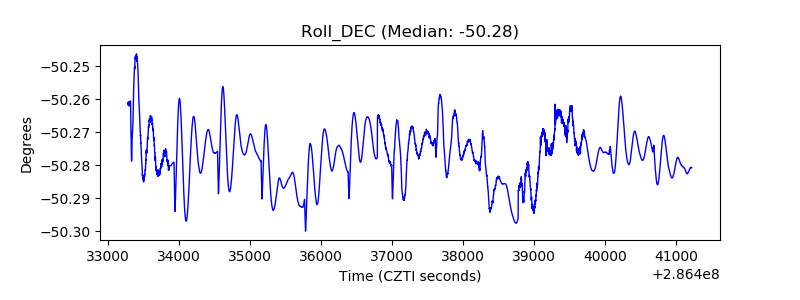 |
| _Roll_RA |  |
| Veto Counter | 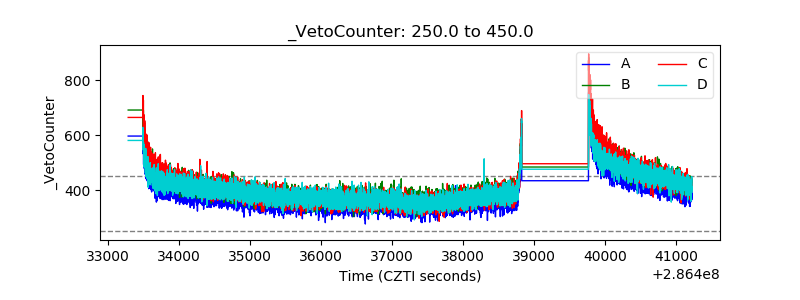 |