| Param | Original file | Final file |
|---|---|---|
| Filename | modeM0/AS1A05_101T02_9000002680_18045cztM0_level2.evt | modeM0/AS1A05_101T02_9000002680_18045cztM0_level2_quad_clean.evt |
| Size (bytes) | 339,163,200 | 63,936,000 |
| Size | 323.5 MB | 61.0 MB |
| Events in quadrant A | 2,082,191 | 411,994 |
| Events in quadrant B | 2,303,105 | 416,958 |
| Events in quadrant C | 2,097,525 | 408,574 |
| Events in quadrant D | 3,486,557 | 386,431 |
| Mode M0 | |||
|---|---|---|---|
| Quadrant | BADHDUFLAG | Total packets | Discarded packets |
| A | 0 | 9094 | 1 |
| B | 0 | 9617 | 1 |
| C | 0 | 9124 | 1 |
| D | 0 | 13475 | 1 |
| Mode SS | |||
|---|---|---|---|
| Quadrant | BADHDUFLAG | Total packets | Discarded packets |
| A | 0 | 90 | 0 |
| B | 0 | 90 | 0 |
| C | 0 | 90 | 0 |
| D | 0 | 90 | 0 |
| Quadrant | Total seconds | Saturated seconds | Saturation percentage |
|---|---|---|---|
| A | 4431 | 20 | 0.451365% |
| B | 4431 | 45 | 1.015572% |
| C | 4431 | 36 | 0.812458% |
| D | 4431 | 93 | 2.098849% |
Noise dominated data is calculated using 1-second bins in cleaned event files. If a bin has >2000 counts, and if more than 50% of those come from <1% of pixels, then it is considered to be noise-dominated and hence unusable.
| Quadrant | # 1 sec bins | Bins with >0 counts | Bins with >2000 counts | High rate bins dominated by noise | Noise dominated (total time) | Noise dominated (detector-on time) | Marked lightcurve |
|---|---|---|---|---|---|---|---|
| A | 4431 | 4431 | 4 | 4 | 0.09% | 0.09% | 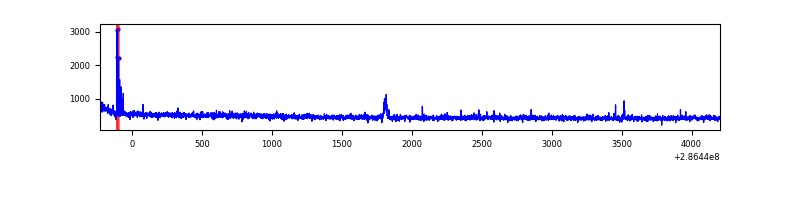 |
| B | 4431 | 4431 | 26 | 26 | 0.59% | 0.59% | 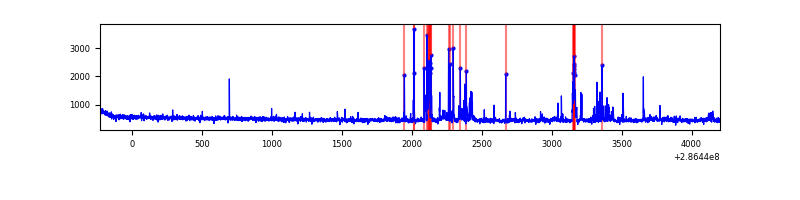 |
| C | 4431 | 4431 | 0 | 0 | 0.00% | 0.00% | 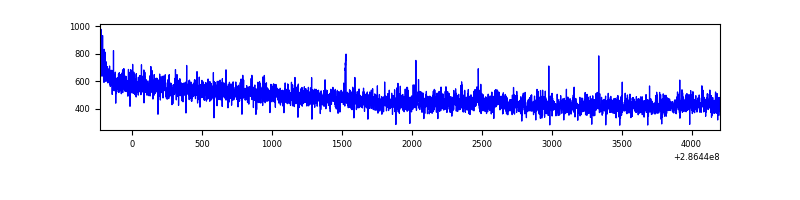 |
| D | 4431 | 4431 | 70 | 70 | 1.58% | 1.58% | 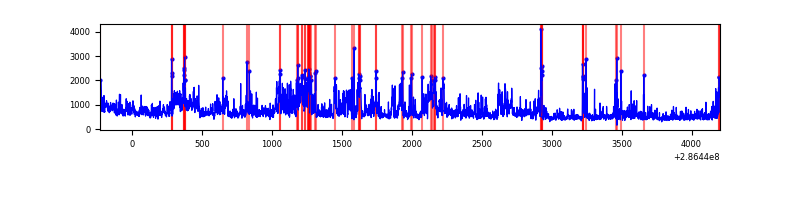 |
Top three noisy pixels from each quadrant. If the there are fewer than three noisy pixels in the level2.evt file, extra rows are filled as -1
| Pixel properties | Quadrant properties | ||||||
|---|---|---|---|---|---|---|---|
| Quadrant | DetID | PixID | Counts | Sigma | Mean | Median | Sigma |
| A | 15 | 174 | 33374 | 305.2 | 530 | 519 | 107.6 |
| A | 4 | 2 | 10868 | 96.14 | 530 | 519 | 107.6 |
| A | 0 | 226 | 4695 | 38.79 | 530 | 519 | 107.6 |
| B | 7 | 220 | 174052 | 1728.46 | 530 | 516 | 100.4 |
| B | 0 | 197 | 17398 | 168.15 | 530 | 516 | 100.4 |
| B | 12 | 111 | 11282 | 107.23 | 530 | 516 | 100.4 |
| C | 14 | 238 | 80548 | 668.24 | 509 | 511 | 119.8 |
| C | 8 | 208 | 21398 | 174.39 | 509 | 511 | 119.8 |
| C | 3 | 233 | 5963 | 45.52 | 509 | 511 | 119.8 |
| D | 7 | 238 | 742400 | 5933.36 | 510 | 496 | 125.0 |
| D | 1 | 52 | 318230 | 2541.07 | 510 | 496 | 125.0 |
| D | 5 | 222 | 241141 | 1924.55 | 510 | 496 | 125.0 |
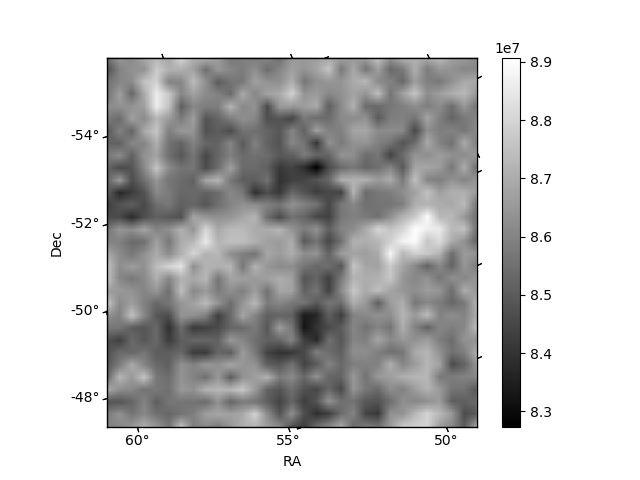
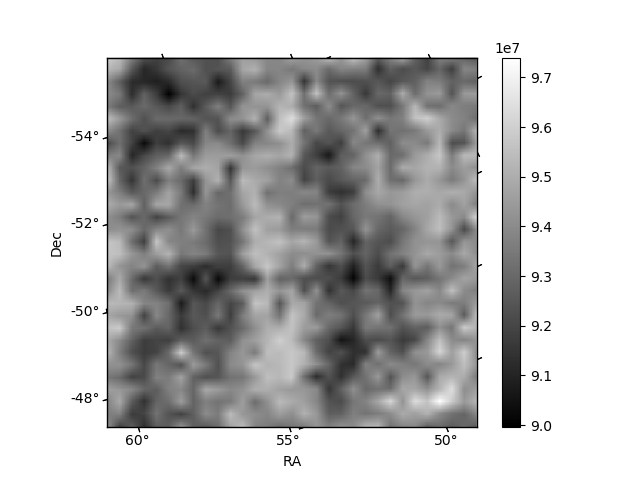
Histogram calculated using DETX and DETY for each event in the final _common_clean file
| Quadrant A | 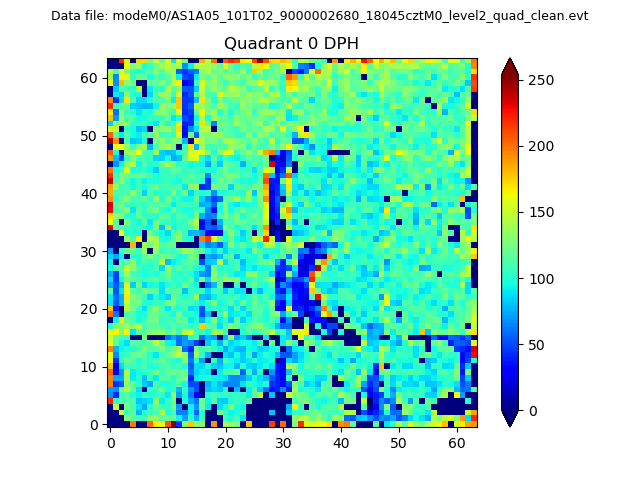 |
 |
Quadrant B |
|---|---|---|---|
| Quadrant D | 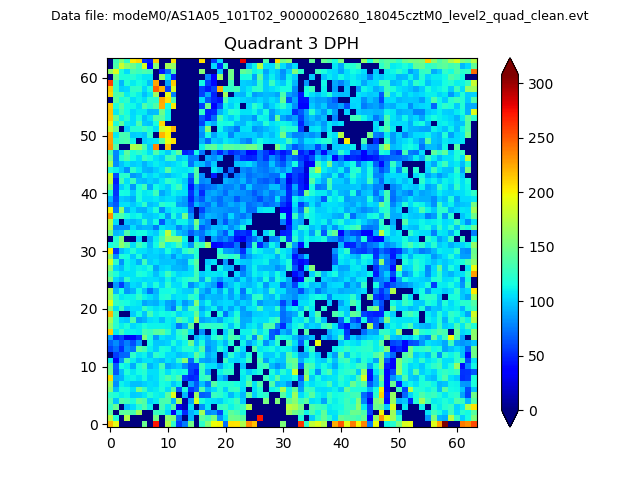 |
 |
Quadrant C |
| Plot type | Count rate plots | Images |
|---|---|---|
| Comparison with Poisson distribution Blue bars denote a histogram of data divided into 1 sec bins. Red curve is a Poisson curve with rate = median count rate of data. |
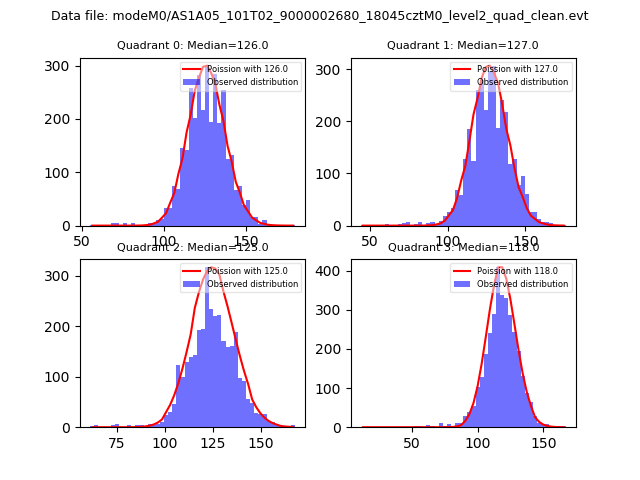 |
 |
| Quadrant-wise count rates Data is divided into 100 sec bins |
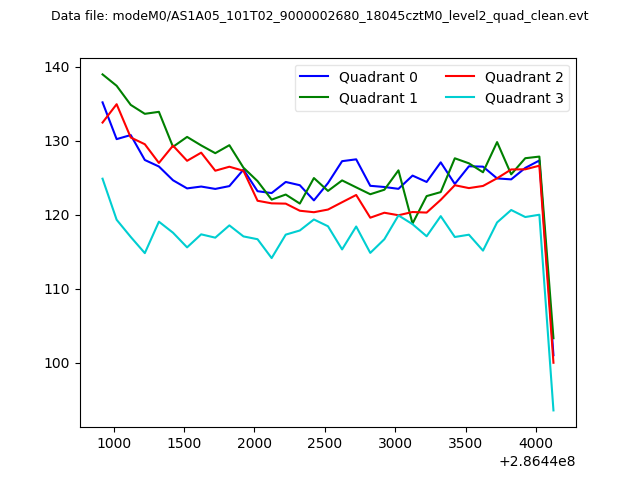 |
|
| Module-wise count rates for Quadrant A Data is divided into 100 sec bins |
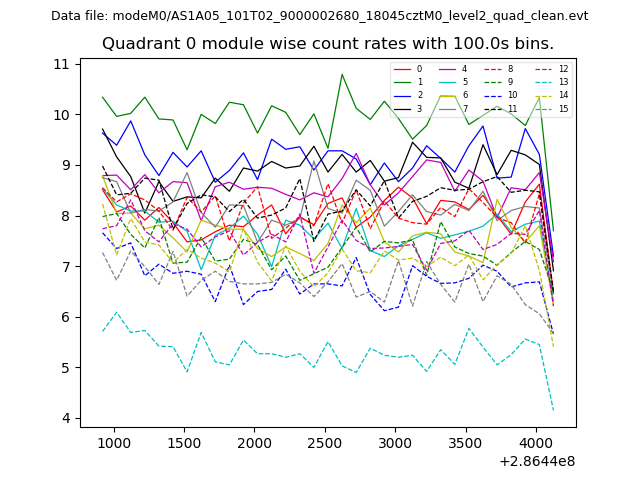 |
 |
| Module-wise count rates for Quadrant B Data is divided into 100 sec bins |
 |
 |
| Module-wise count rates for Quadrant C Data is divided into 100 sec bins |
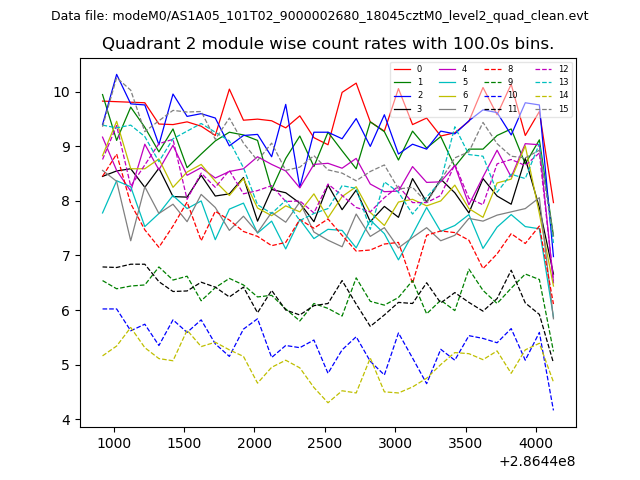 |
 |
| Module-wise count rates for Quadrant D Data is divided into 100 sec bins |
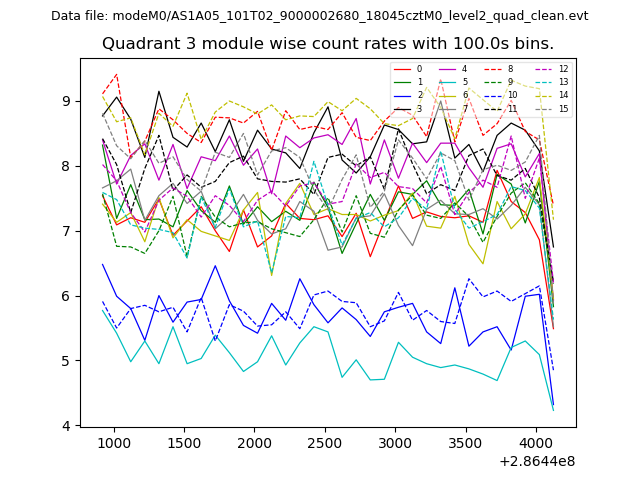 |
 |
| Parameter | Plot |
|---|---|
| CZT HV Monitor |  |
| D_VDD | 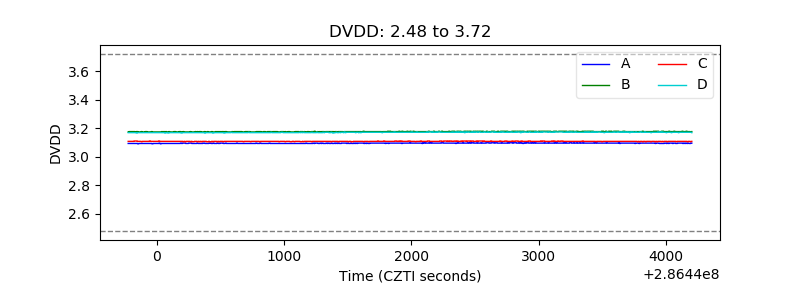 |
| Temperature 1 | 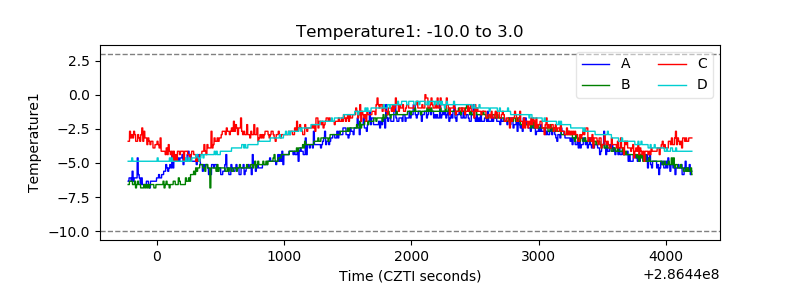 |
| Veto HV Monitor | 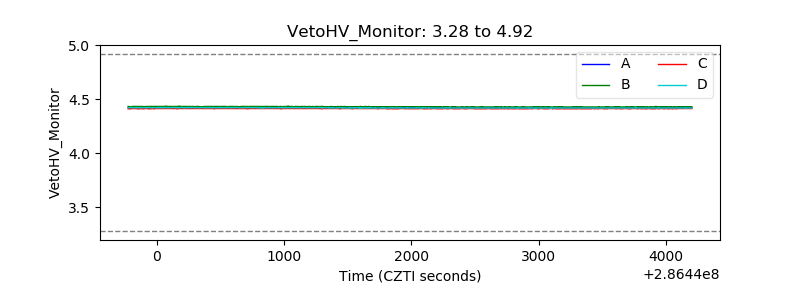 |
| Veto LLD | 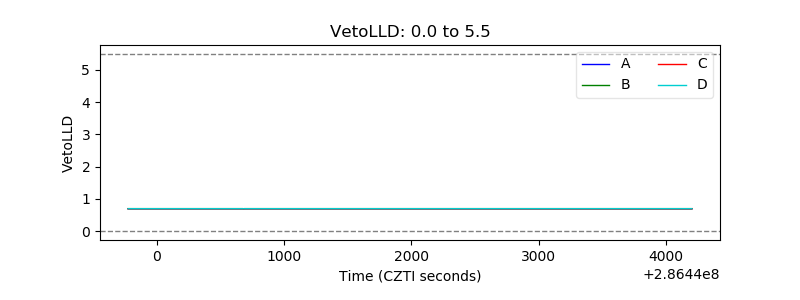 |
| Alpha Counter | 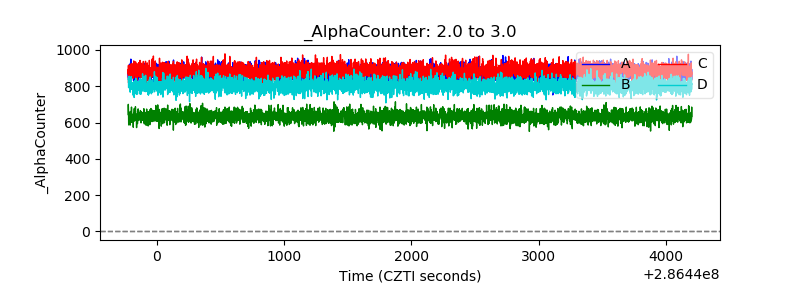 |
| _CPM_Rate | 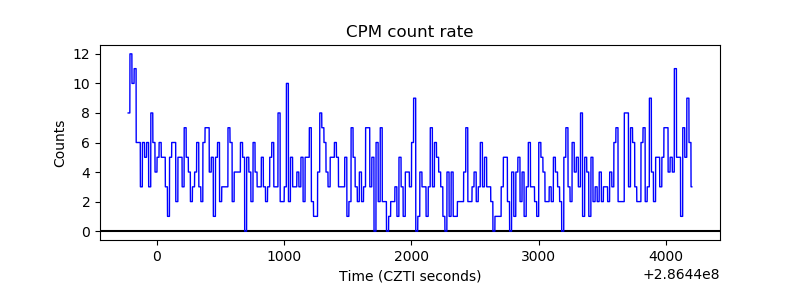 |
| CZT Counter |  |
| +2.5 Volts monitor |  |
| +5 Volts monitor | 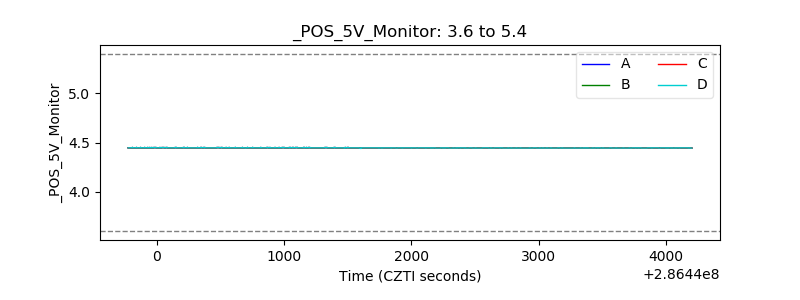 |
| _ROLL_ROT | 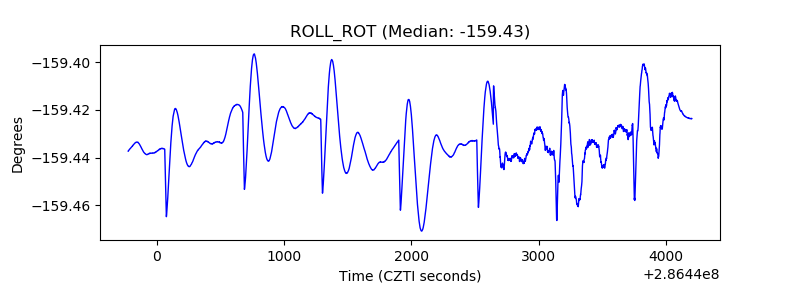 |
| _Roll_DEC | 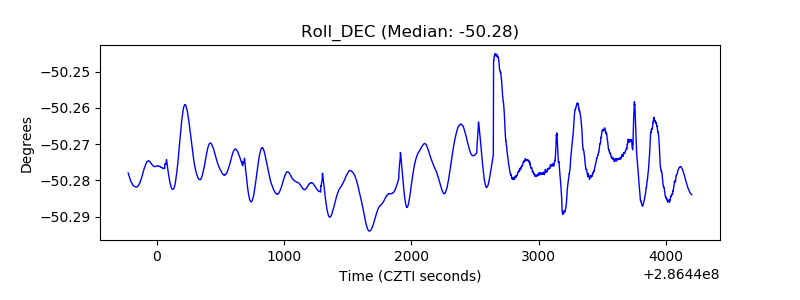 |
| _Roll_RA | 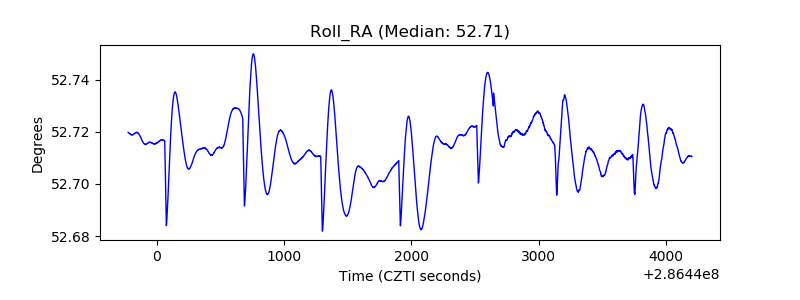 |
| Veto Counter | 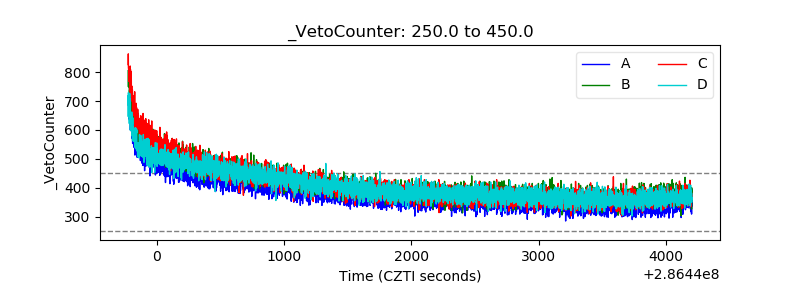 |