| Param | Original file | Final file |
|---|---|---|
| Filename | modeM0/AS1A06_003T04_9000002682cztM0_level2.fits | modeM0/AS1A06_003T04_9000002682cztM0_level2_quad_clean.evt |
| Size (bytes) | 1,225,474,560 | 1,059,975,360 |
| Size | 1.1 GB | 1010.9 MB |
| Events in quadrant A | 7,530,784 | 6,067,123 |
| Events in quadrant B | 7,321,254 | 6,303,008 |
| Events in quadrant C | 7,323,502 | 5,881,600 |
| Events in quadrant D | 6,319,058 | 5,235,014 |
| Mode SS | |||
|---|---|---|---|
| Quadrant | BADHDUFLAG | Total packets | Discarded packets |
| A | 0 | 2562 | 0 |
| B | 0 | 2562 | 0 |
| C | 0 | 2562 | 0 |
| D | 0 | 2562 | 0 |
| Mode M0 | |||
|---|---|---|---|
| Quadrant | BADHDUFLAG | Total packets | Discarded packets |
| A | 0 | 288945 | 0 |
| B | 0 | 268635 | 0 |
| C | 0 | 263790 | 0 |
| D | 0 | 333962 | 0 |
| Mode M9 | |||
|---|---|---|---|
| Quadrant | BADHDUFLAG | Total packets | Discarded packets |
| A | 0 | 212 | 0 |
| B | 0 | 212 | 0 |
| C | 0 | 212 | 0 |
| D | 0 | 212 | 0 |
| Quadrant | Total seconds | Saturated seconds | Saturation percentage |
|---|---|---|---|
| A | 125690 | 8940 | 7.112738% |
| B | 125690 | 1730 | 1.376402% |
| C | 125690 | 1961 | 1.560188% |
| D | 125690 | 7146 | 5.685417% |
Noise dominated data is calculated using 1-second bins in cleaned event files. If a bin has >2000 counts, and if more than 50% of those come from <1% of pixels, then it is considered to be noise-dominated and hence unusable.
| Quadrant | # 1 sec bins | Bins with >0 counts | Bins with >2000 counts | High rate bins dominated by noise | Noise dominated (total time) | Noise dominated (detector-on time) | Marked lightcurve |
|---|---|---|---|---|---|---|---|
| A | 146039 | 125677 | 0 | 0 | 0.00% | 0.00% |  |
| B | 146039 | 125676 | 0 | 0 | 0.00% | 0.00% | 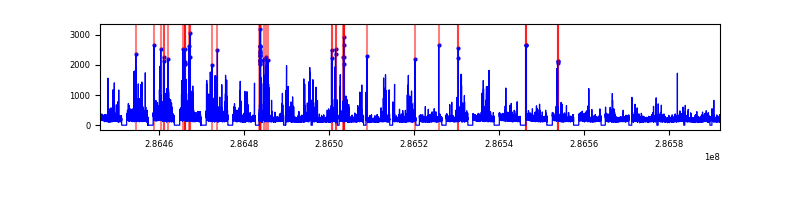 |
| C | 146039 | 125686 | 0 | 0 | 0.00% | 0.00% | 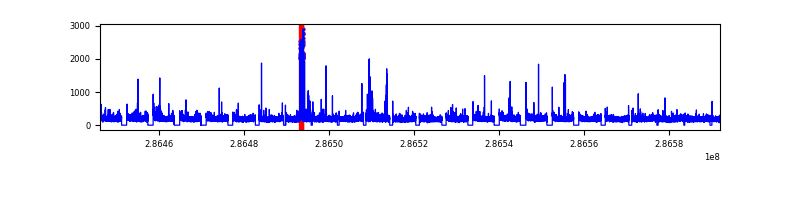 |
| D | 146039 | 125646 | 0 | 0 | 0.00% | 0.00% | 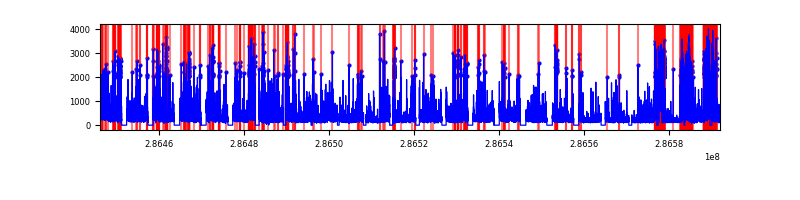 |
Top three noisy pixels from each quadrant. If the there are fewer than three noisy pixels in the level2.evt file, extra rows are filled as -1
| Pixel properties | Quadrant properties | ||||||
|---|---|---|---|---|---|---|---|
| Quadrant | DetID | PixID | Counts | Sigma | Mean | Median | Sigma |
| A | 0 | 29 | 7147 | 11.01 | 1961 | 1836 | 482.5 |
| A | 7 | 110 | 5985 | 8.6 | 1961 | 1836 | 482.5 |
| A | 0 | 30 | 5669 | 7.94 | 1961 | 1836 | 482.5 |
| B | 2 | 9 | 5914 | 10.72 | 1933 | 1848 | 379.2 |
| B | 3 | 17 | 4996 | 8.3 | 1933 | 1848 | 379.2 |
| B | 2 | 8 | 4930 | 8.13 | 1933 | 1848 | 379.2 |
| C | 1 | 80 | 5628 | 7.72 | 1935 | 1805 | 495.3 |
| C | 1 | 81 | 5619 | 7.7 | 1935 | 1805 | 495.3 |
| C | 12 | 241 | 5099 | 6.65 | 1935 | 1805 | 495.3 |
| D | 10 | 190 | 4819 | 6.68 | 1807 | 1646 | 475.0 |
| D | 3 | 14 | 4671 | 6.37 | 1807 | 1646 | 475.0 |
| D | 6 | 231 | 4621 | 6.26 | 1807 | 1646 | 475.0 |
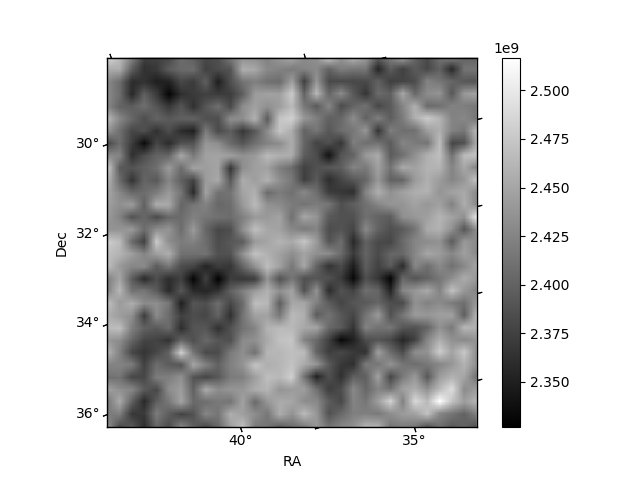
Histogram calculated using DETX and DETY for each event in the final _common_clean file
| Quadrant A | 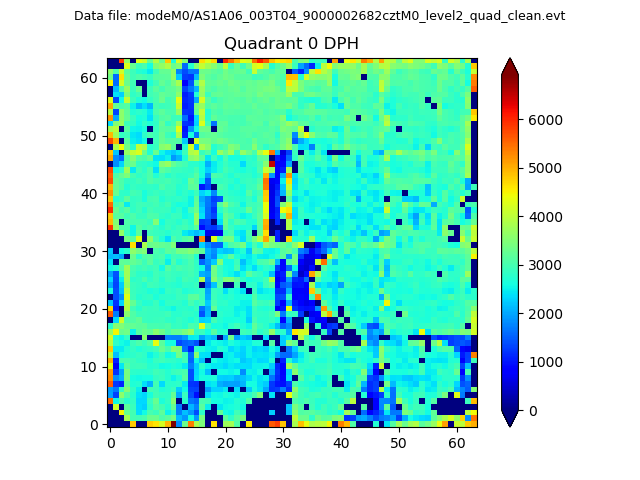 |
 |
Quadrant B |
|---|---|---|---|
| Quadrant D | 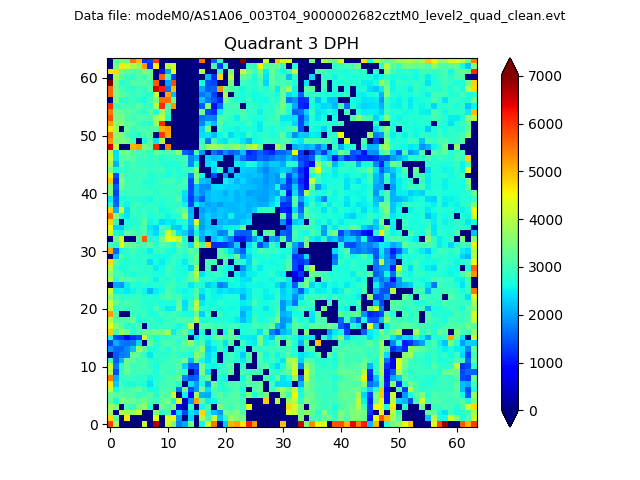 |
 |
Quadrant C |
| Plot type | Count rate plots | Images |
|---|---|---|
| Comparison with Poisson distribution Blue bars denote a histogram of data divided into 1 sec bins. Red curve is a Poisson curve with rate = median count rate of data. |
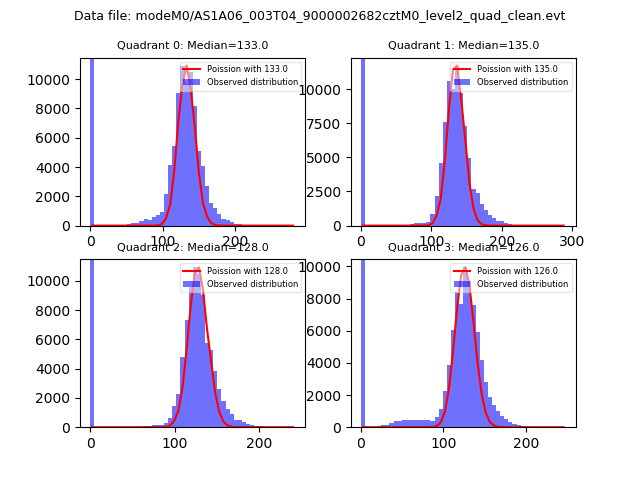 |
 |
| Quadrant-wise count rates Data is divided into 100 sec bins |
 |
|
| Module-wise count rates for Quadrant A Data is divided into 100 sec bins |
 |
 |
| Module-wise count rates for Quadrant B Data is divided into 100 sec bins |
 |
 |
| Module-wise count rates for Quadrant C Data is divided into 100 sec bins |
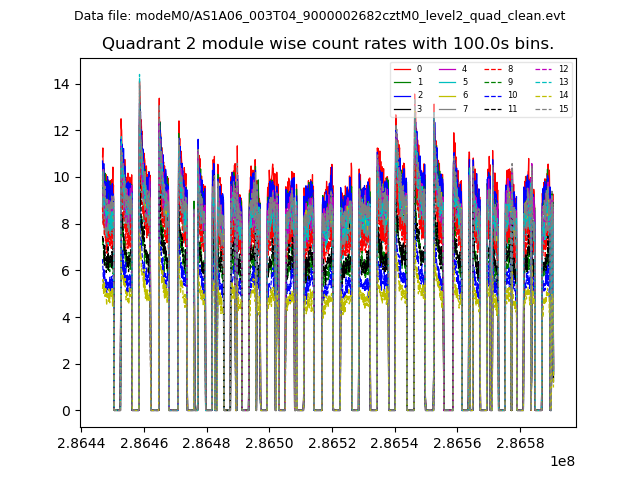 |
 |
| Module-wise count rates for Quadrant D Data is divided into 100 sec bins |
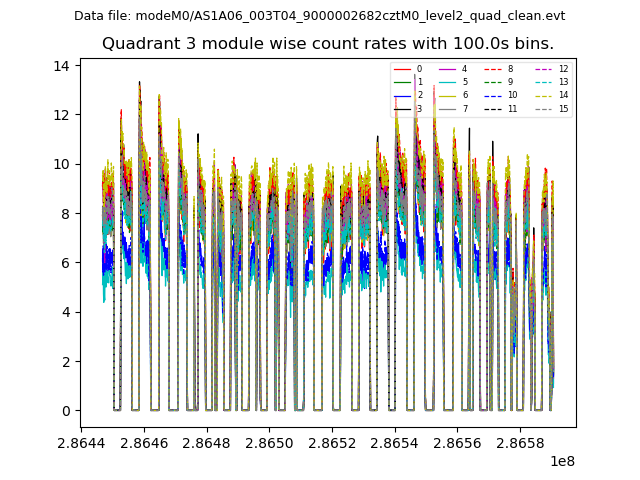 |
 |
| Parameter | Plot |
|---|---|
| CZT HV Monitor |  |
| D_VDD |  |
| Temperature 1 | 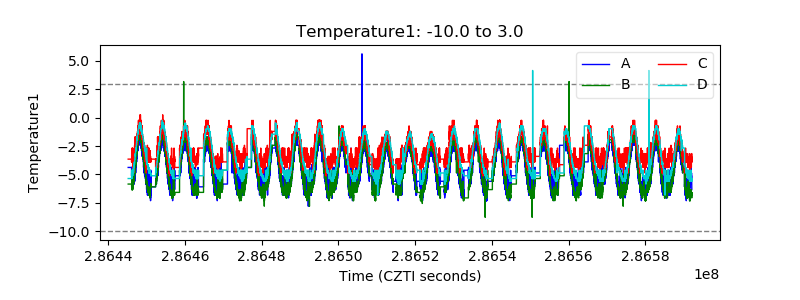 |
| Veto HV Monitor |  |
| Veto LLD |  |
| Alpha Counter |  |
| _CPM_Rate |  |
| CZT Counter | 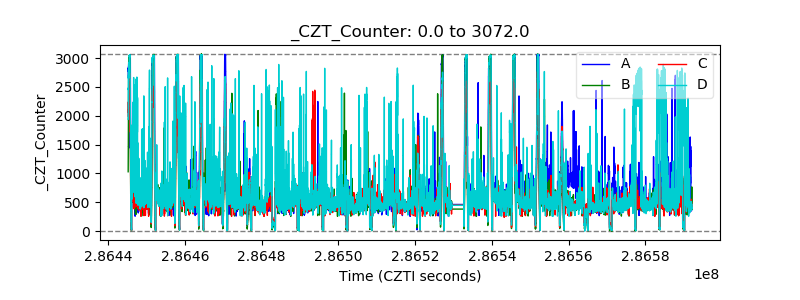 |
| +2.5 Volts monitor | 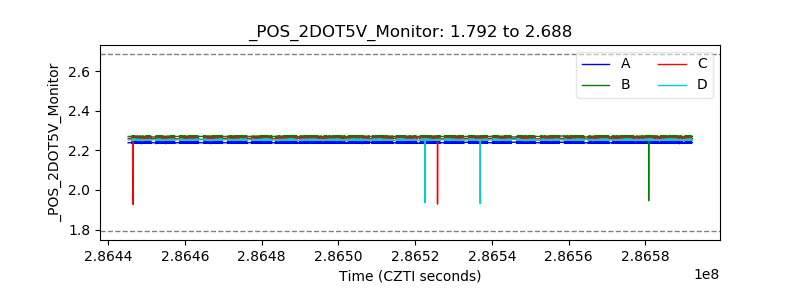 |
| +5 Volts monitor |  |
| _ROLL_ROT |  |
| _Roll_DEC | 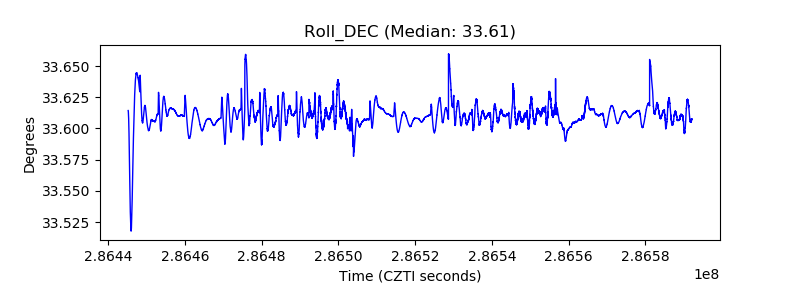 |
| _Roll_RA |  |
| Veto Counter |  |