| Param | Original file | Final file |
|---|---|---|
| Filename | modeM0/AS1A06_003T04_9000002682_18045cztM0_level2.evt | modeM0/AS1A06_003T04_9000002682_18045cztM0_level2_quad_clean.evt |
| Size (bytes) | 141,808,320 | 15,229,440 |
| Size | 135.2 MB | 14.5 MB |
| Events in quadrant A | 783,915 | 92,192 |
| Events in quadrant B | 790,048 | 95,274 |
| Events in quadrant C | 780,957 | 88,910 |
| Events in quadrant D | 1,841,795 | 79,382 |
| Mode SS | |||
|---|---|---|---|
| Quadrant | BADHDUFLAG | Total packets | Discarded packets |
| A | 0 | 28 | 0 |
| B | 0 | 28 | 0 |
| C | 0 | 28 | 0 |
| D | 0 | 28 | 0 |
| Mode M0 | |||
|---|---|---|---|
| Quadrant | BADHDUFLAG | Total packets | Discarded packets |
| A | 0 | 3176 | 1 |
| B | 0 | 3230 | 1 |
| C | 0 | 3157 | 1 |
| D | 0 | 6473 | 1 |
| Mode M9 | |||
|---|---|---|---|
| Quadrant | BADHDUFLAG | Total packets | Discarded packets |
| A | 0 | 9 | 0 |
| B | 0 | 9 | 0 |
| C | 0 | 9 | 0 |
| D | 0 | 9 | 0 |
| Quadrant | Total seconds | Saturated seconds | Saturation percentage |
|---|---|---|---|
| A | 1407 | 11 | 0.781805% |
| B | 1407 | 13 | 0.923952% |
| C | 1407 | 23 | 1.634684% |
| D | 1407 | 312 | 22.174840% |
Noise dominated data is calculated using 1-second bins in cleaned event files. If a bin has >2000 counts, and if more than 50% of those come from <1% of pixels, then it is considered to be noise-dominated and hence unusable.
| Quadrant | # 1 sec bins | Bins with >0 counts | Bins with >2000 counts | High rate bins dominated by noise | Noise dominated (total time) | Noise dominated (detector-on time) | Marked lightcurve |
|---|---|---|---|---|---|---|---|
| A | 1407 | 1407 | 0 | 0 | 0.00% | 0.00% | 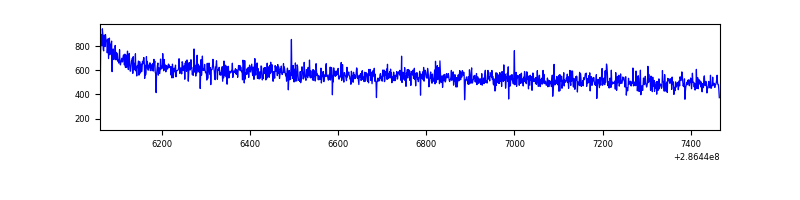 |
| B | 1407 | 1407 | 0 | 0 | 0.00% | 0.00% | 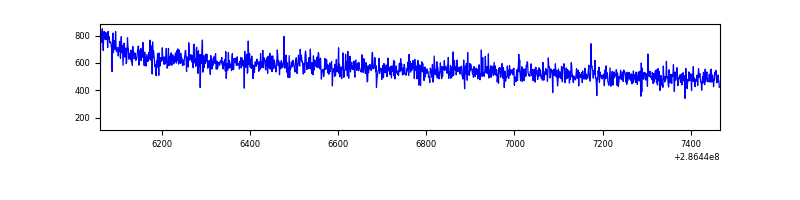 |
| C | 1407 | 1407 | 0 | 0 | 0.00% | 0.00% | 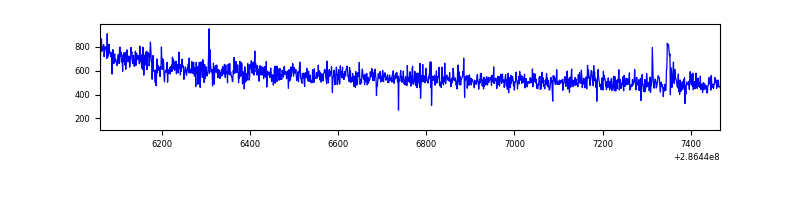 |
| D | 1407 | 1407 | 224 | 224 | 15.92% | 15.92% | 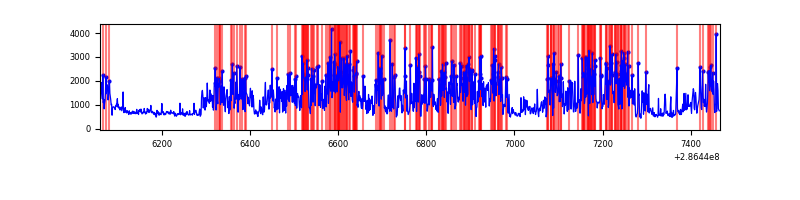 |
Top three noisy pixels from each quadrant. If the there are fewer than three noisy pixels in the level2.evt file, extra rows are filled as -1
| Pixel properties | Quadrant properties | ||||||
|---|---|---|---|---|---|---|---|
| Quadrant | DetID | PixID | Counts | Sigma | Mean | Median | Sigma |
| A | 0 | 226 | 1721 | 35.75 | 204 | 199 | 42.6 |
| A | 12 | 194 | 1480 | 30.09 | 204 | 199 | 42.6 |
| A | 3 | 137 | 1398 | 28.16 | 204 | 199 | 42.6 |
| B | 12 | 111 | 4613 | 107.77 | 202 | 198 | 41.0 |
| B | 11 | 111 | 3963 | 91.9 | 202 | 198 | 41.0 |
| B | 14 | 111 | 3462 | 79.68 | 202 | 198 | 41.0 |
| C | 14 | 238 | 30632 | 677.42 | 187 | 188 | 44.9 |
| C | 8 | 208 | 11420 | 249.93 | 187 | 188 | 44.9 |
| C | 9 | 160 | 1703 | 33.71 | 187 | 188 | 44.9 |
| D | 5 | 222 | 1102445 | 23963.73 | 182 | 176 | 46.0 |
| D | 7 | 238 | 22485 | 485.01 | 182 | 176 | 46.0 |
| D | 1 | 52 | 10391 | 222.08 | 182 | 176 | 46.0 |
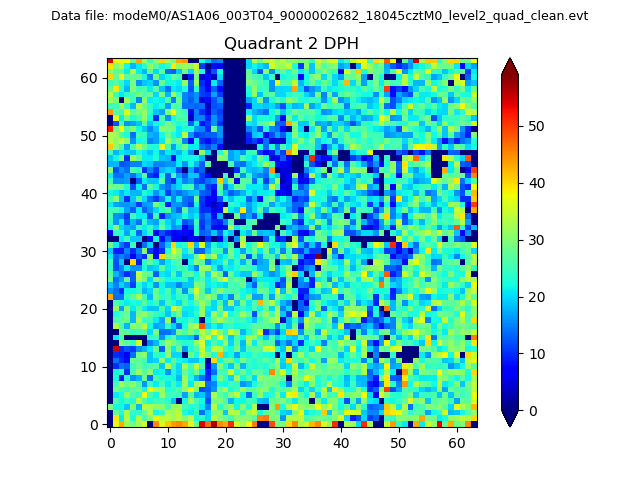
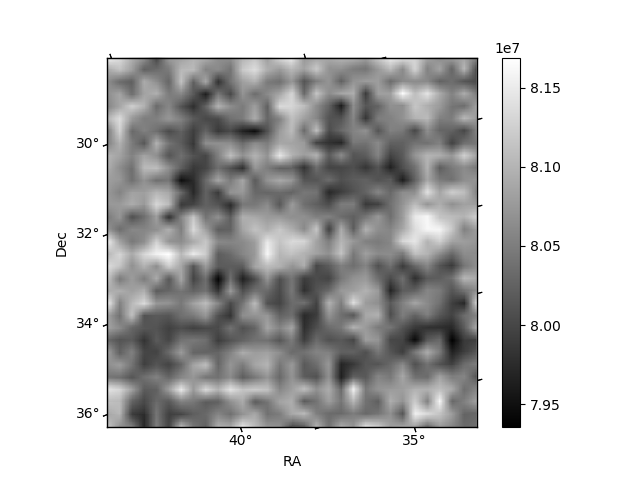
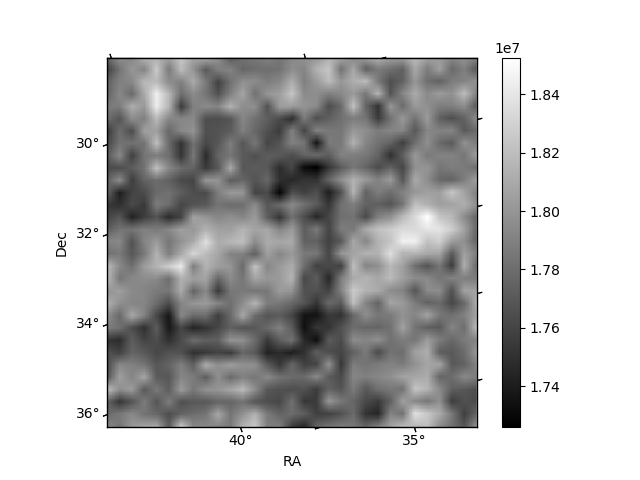
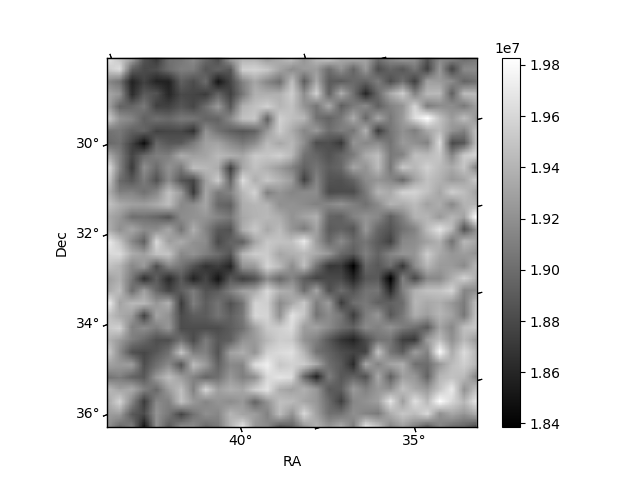
Histogram calculated using DETX and DETY for each event in the final _common_clean file
| Quadrant A | 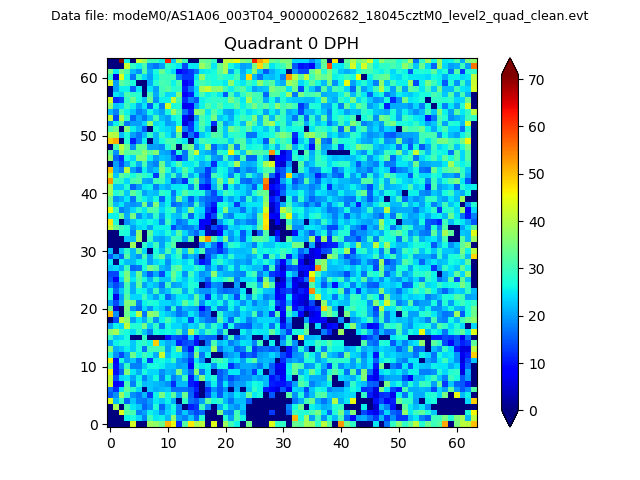 |
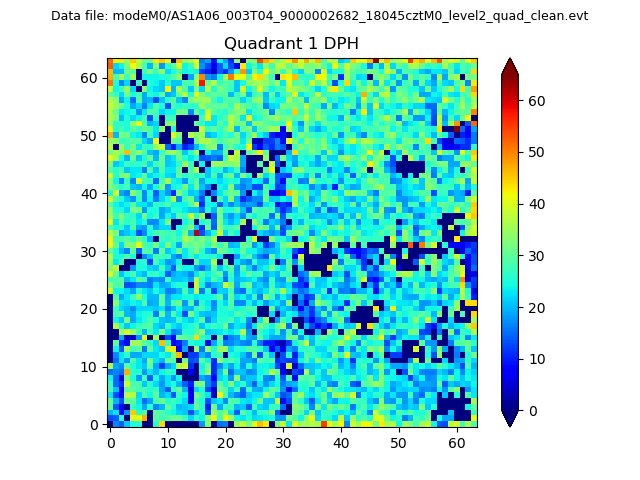 |
Quadrant B |
|---|---|---|---|
| Quadrant D | 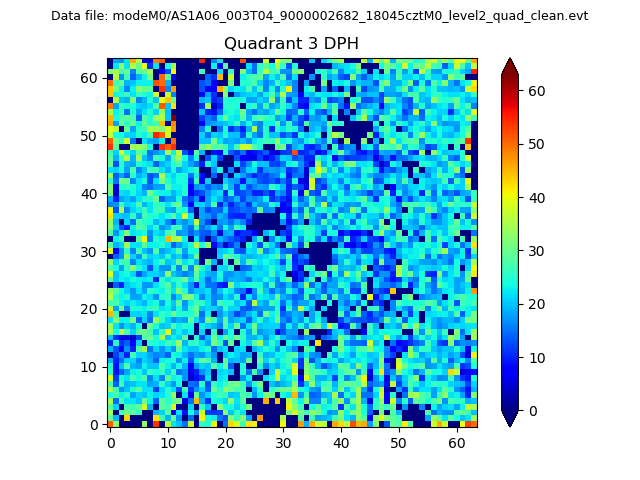 |
 |
Quadrant C |
| Plot type | Count rate plots | Images |
|---|---|---|
| Comparison with Poisson distribution Blue bars denote a histogram of data divided into 1 sec bins. Red curve is a Poisson curve with rate = median count rate of data. |
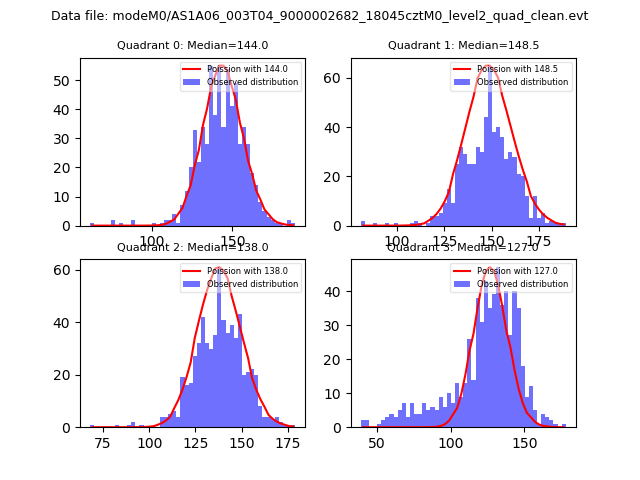 |
 |
| Quadrant-wise count rates Data is divided into 100 sec bins |
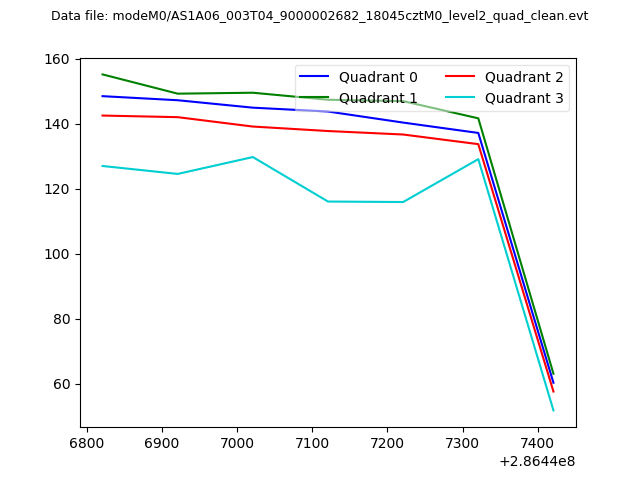 |
|
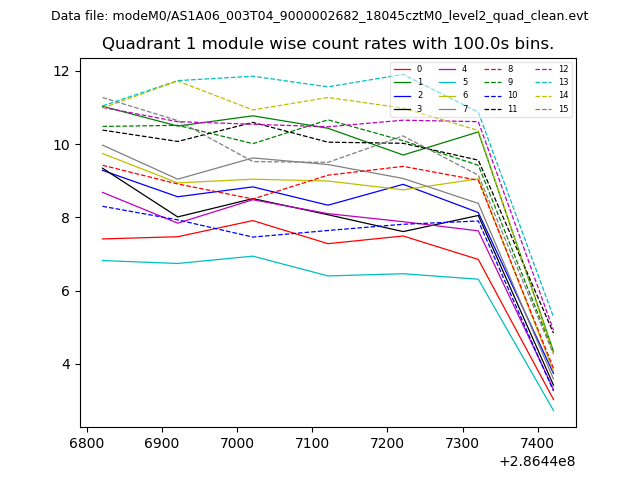
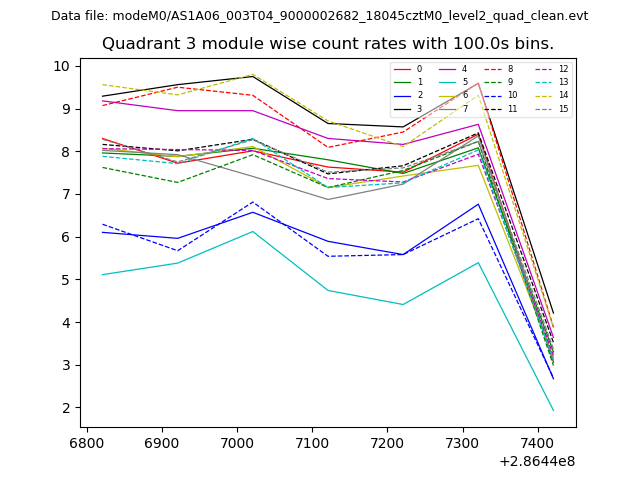
| Module-wise count rates for Quadrant A Data is divided into 100 sec bins |
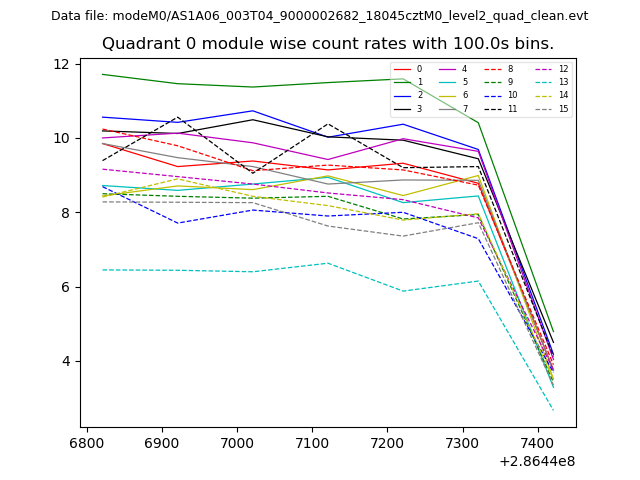 |
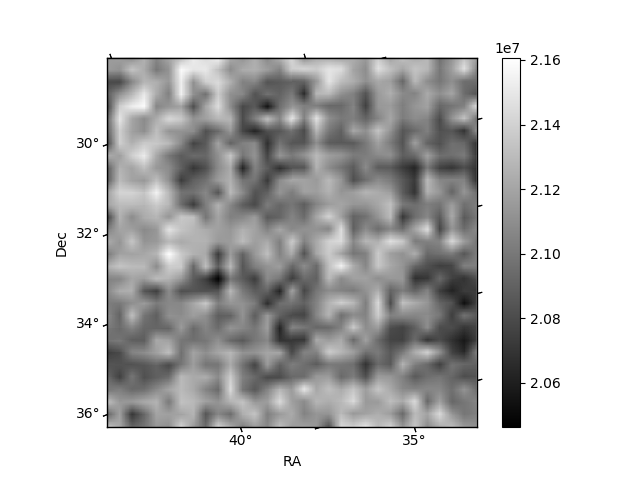 |
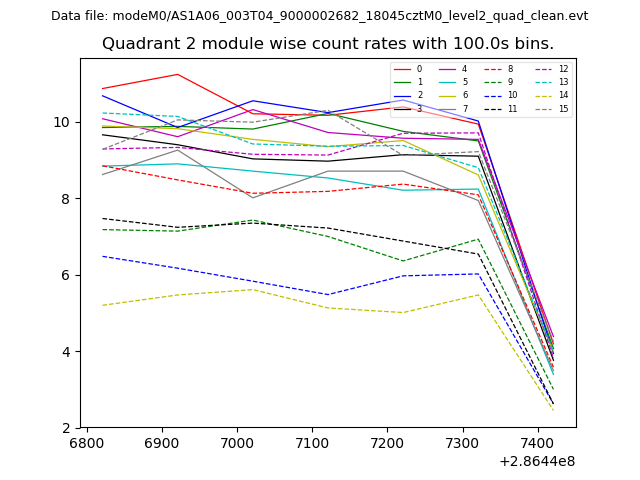
| Module-wise count rates for Quadrant B Data is divided into 100 sec bins |
 |
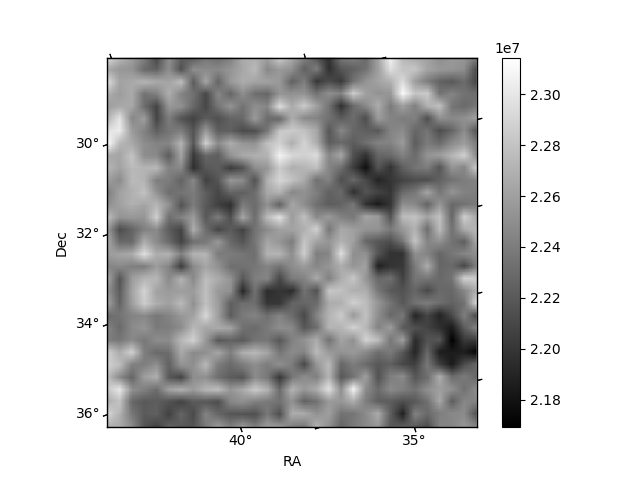 |
| Module-wise count rates for Quadrant C Data is divided into 100 sec bins |
 |
 |
| Module-wise count rates for Quadrant D Data is divided into 100 sec bins |
 |
 |
| Parameter | Plot |
|---|---|
| CZT HV Monitor | 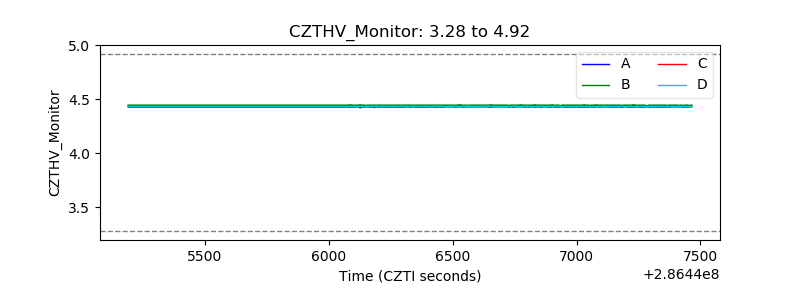 |
| D_VDD | 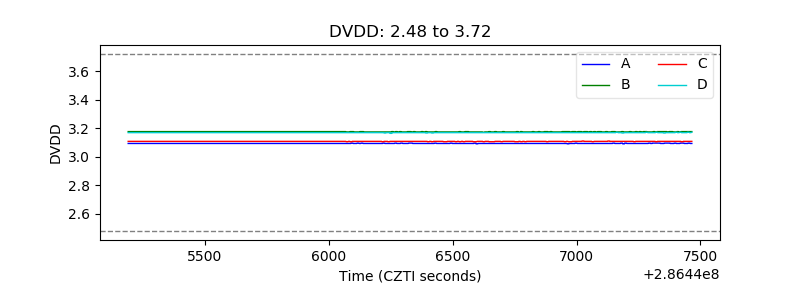 |
| Temperature 1 | 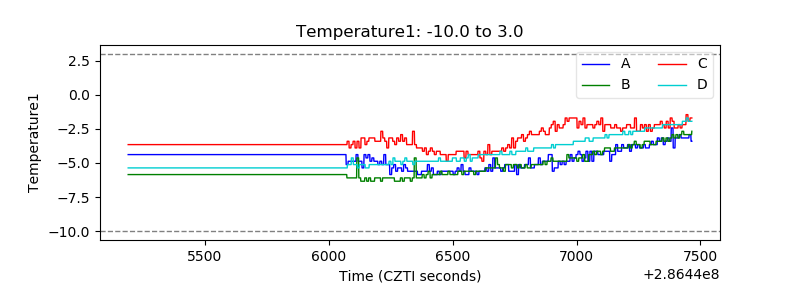 |
| Veto HV Monitor | 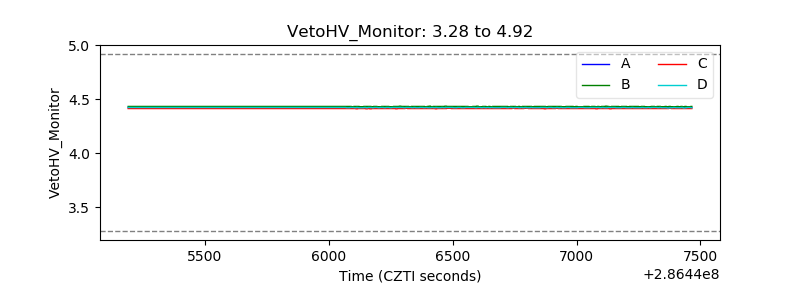 |
| Veto LLD | 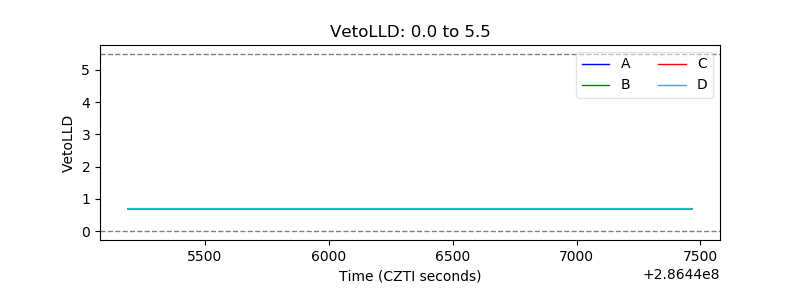 |
| Alpha Counter | 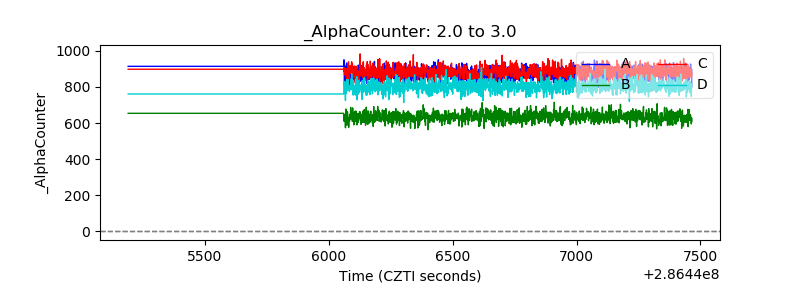 |
| _CPM_Rate | 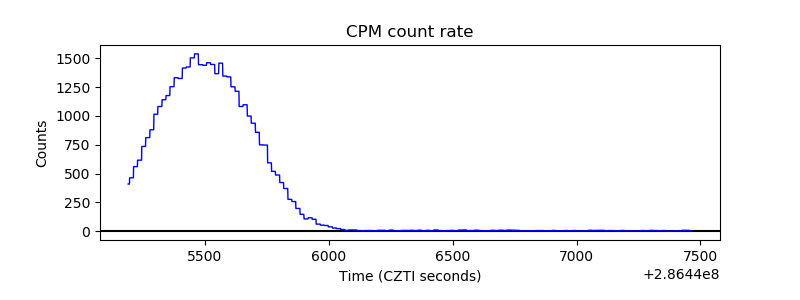 |
| CZT Counter | 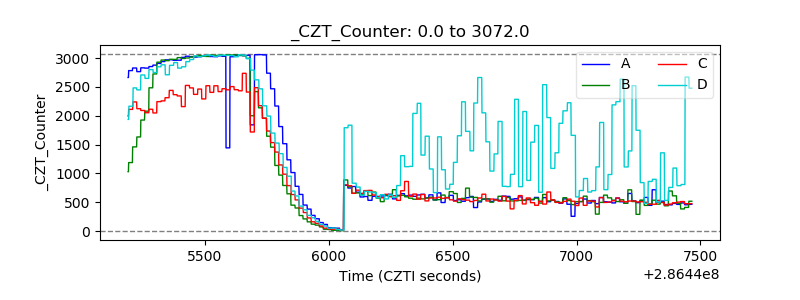 |
| +2.5 Volts monitor |  |
| +5 Volts monitor | 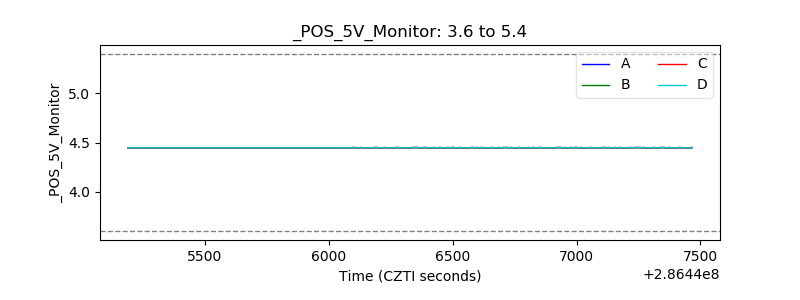 |
| _ROLL_ROT | 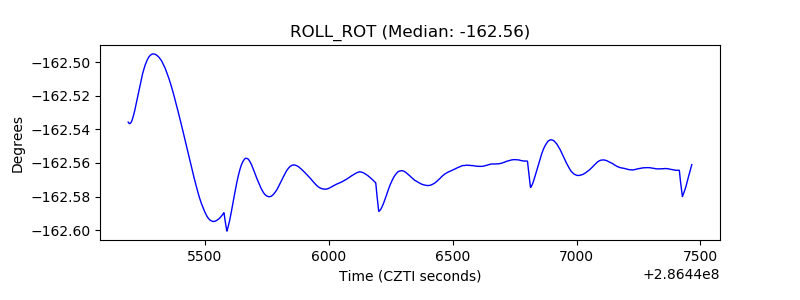 |
| _Roll_DEC | 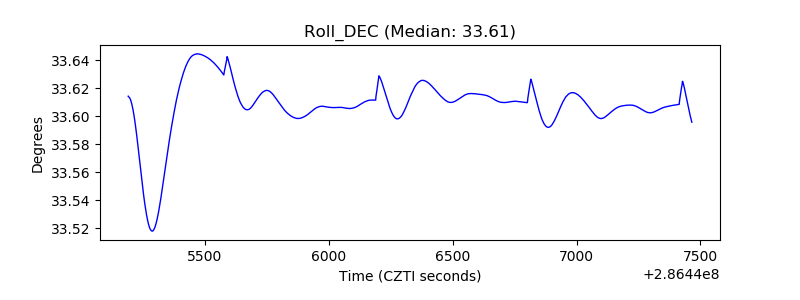 |
| _Roll_RA | 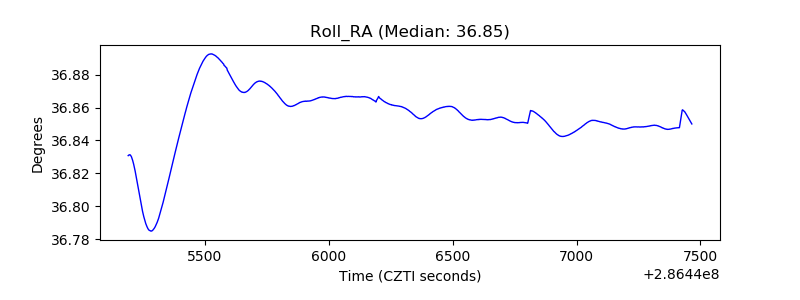 |
| Veto Counter |  |