| Param | Original file | Final file |
|---|---|---|
| Filename | modeM0/AS1A06_003T04_9000002682_18047cztM0_level2.evt | modeM0/AS1A06_003T04_9000002682_18047cztM0_level2_quad_clean.evt |
| Size (bytes) | 482,446,080 | 97,755,840 |
| Size | 460.1 MB | 93.2 MB |
| Events in quadrant A | 2,991,951 | 657,544 |
| Events in quadrant B | 3,074,198 | 664,966 |
| Events in quadrant C | 2,975,415 | 619,453 |
| Events in quadrant D | 5,164,996 | 602,386 |
| Mode SS | |||
|---|---|---|---|
| Quadrant | BADHDUFLAG | Total packets | Discarded packets |
| A | 0 | 120 | 0 |
| B | 0 | 120 | 0 |
| C | 0 | 120 | 0 |
| D | 0 | 120 | 0 |
| Mode M0 | |||
|---|---|---|---|
| Quadrant | BADHDUFLAG | Total packets | Discarded packets |
| A | 0 | 12678 | 1 |
| B | 0 | 12834 | 1 |
| C | 0 | 12571 | 1 |
| D | 0 | 19422 | 1 |
| Mode M9 | |||
|---|---|---|---|
| Quadrant | BADHDUFLAG | Total packets | Discarded packets |
| A | 0 | 12 | 0 |
| B | 0 | 12 | 0 |
| C | 0 | 12 | 0 |
| D | 0 | 12 | 0 |
| Quadrant | Total seconds | Saturated seconds | Saturation percentage |
|---|---|---|---|
| A | 5960 | 38 | 0.637584% |
| B | 5961 | 56 | 0.939440% |
| C | 5961 | 62 | 1.040094% |
| D | 5961 | 484 | 8.119443% |
Noise dominated data is calculated using 1-second bins in cleaned event files. If a bin has >2000 counts, and if more than 50% of those come from <1% of pixels, then it is considered to be noise-dominated and hence unusable.
| Quadrant | # 1 sec bins | Bins with >0 counts | Bins with >2000 counts | High rate bins dominated by noise | Noise dominated (total time) | Noise dominated (detector-on time) | Marked lightcurve |
|---|---|---|---|---|---|---|---|
| A | 7145 | 5961 | 0 | 0 | 0.00% | 0.00% | 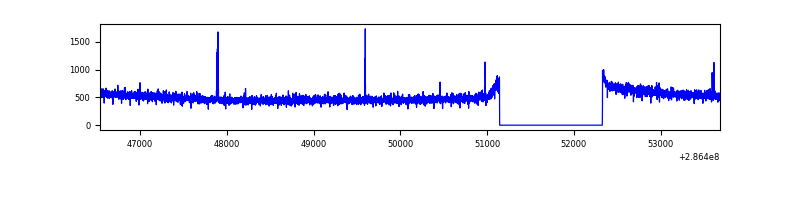 |
| B | 7146 | 5962 | 2 | 2 | 0.03% | 0.03% | 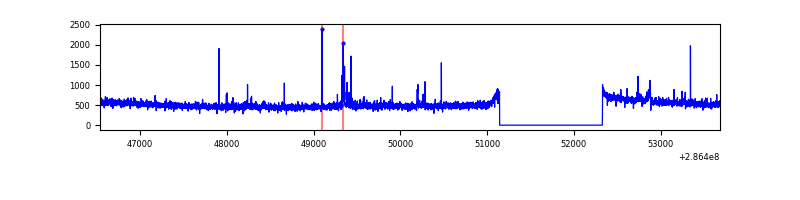 |
| C | 7146 | 5962 | 0 | 0 | 0.00% | 0.00% | 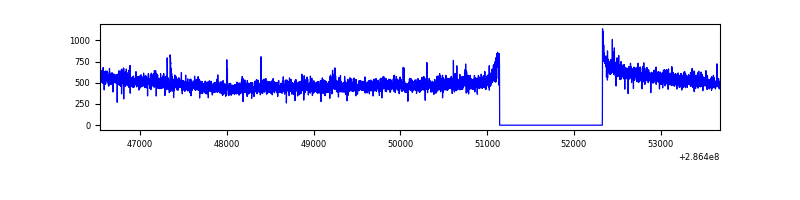 |
| D | 7146 | 5962 | 360 | 360 | 5.04% | 6.04% | 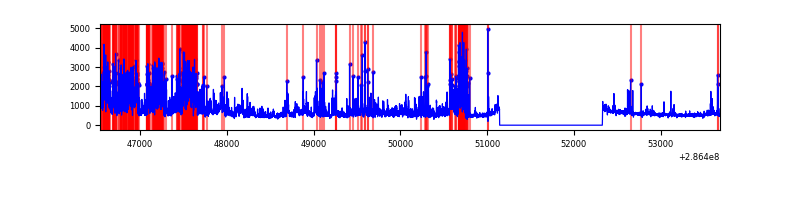 |
Top three noisy pixels from each quadrant. If the there are fewer than three noisy pixels in the level2.evt file, extra rows are filled as -1
| Pixel properties | Quadrant properties | ||||||
|---|---|---|---|---|---|---|---|
| Quadrant | DetID | PixID | Counts | Sigma | Mean | Median | Sigma |
| A | 15 | 174 | 15112 | 93.25 | 773 | 758 | 153.9 |
| A | 0 | 226 | 6774 | 39.08 | 773 | 758 | 153.9 |
| A | 12 | 194 | 5719 | 32.23 | 773 | 758 | 153.9 |
| B | 0 | 197 | 25748 | 172.39 | 766 | 747 | 145.0 |
| B | 12 | 111 | 16471 | 108.42 | 766 | 747 | 145.0 |
| B | 0 | 189 | 15412 | 101.12 | 766 | 747 | 145.0 |
| C | 14 | 238 | 114278 | 677.57 | 721 | 728 | 167.6 |
| C | 8 | 208 | 21040 | 121.2 | 721 | 728 | 167.6 |
| C | 5 | 218 | 8298 | 45.17 | 721 | 728 | 167.6 |
| D | 5 | 222 | 1856048 | 10424.64 | 729 | 707 | 178.0 |
| D | 11 | 176 | 213763 | 1197.1 | 729 | 707 | 178.0 |
| D | 1 | 52 | 113825 | 635.58 | 729 | 707 | 178.0 |
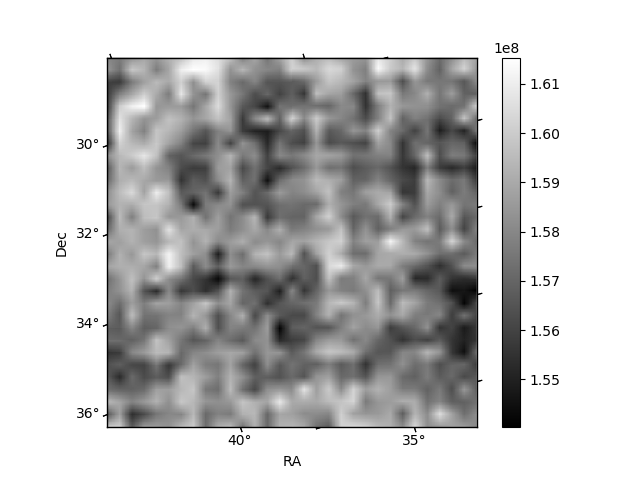
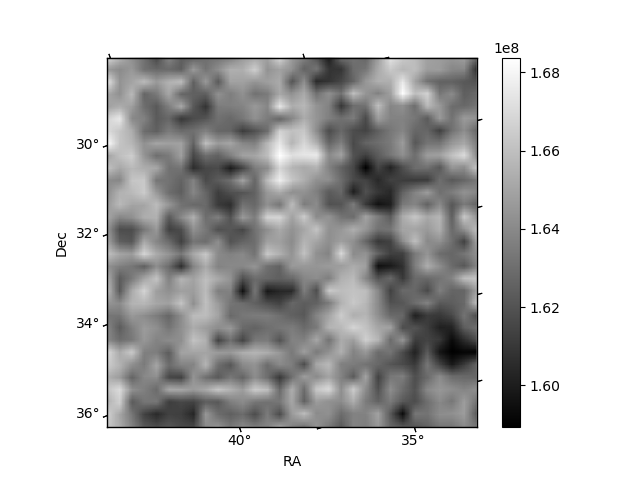
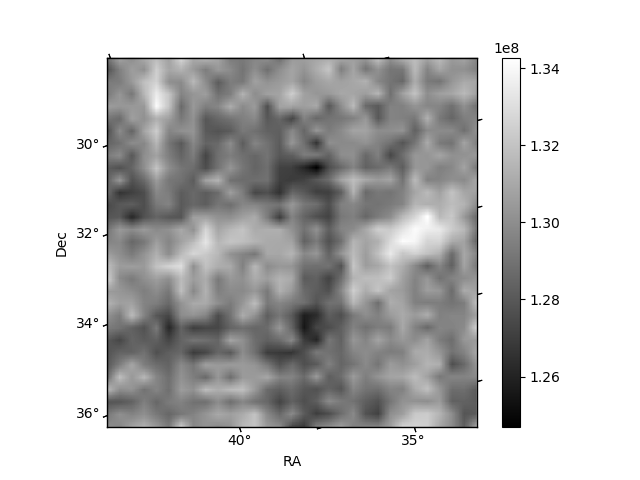
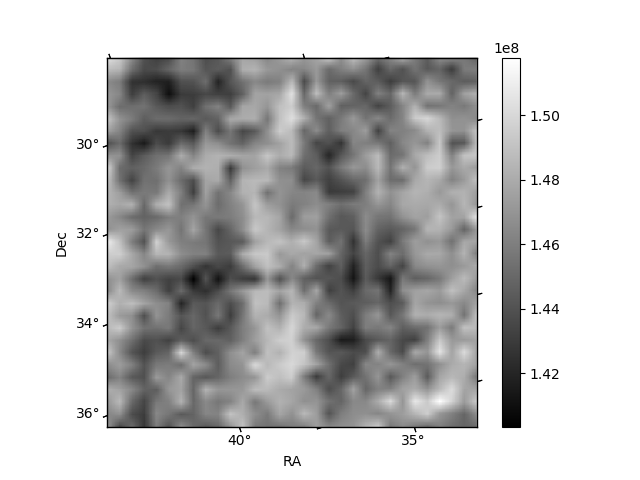
Histogram calculated using DETX and DETY for each event in the final _common_clean file
| Quadrant A |  |
 |
Quadrant B |
|---|---|---|---|
| Quadrant D |  |
 |
Quadrant C |
| Plot type | Count rate plots | Images |
|---|---|---|
| Comparison with Poisson distribution Blue bars denote a histogram of data divided into 1 sec bins. Red curve is a Poisson curve with rate = median count rate of data. |
 |
 |
| Quadrant-wise count rates Data is divided into 100 sec bins |
 |
|
| Module-wise count rates for Quadrant A Data is divided into 100 sec bins |
 |
 |
| Module-wise count rates for Quadrant B Data is divided into 100 sec bins |
 |
 |
| Module-wise count rates for Quadrant C Data is divided into 100 sec bins |
 |
 |
| Module-wise count rates for Quadrant D Data is divided into 100 sec bins |
 |
 |
| Parameter | Plot |
|---|---|
| CZT HV Monitor |  |
| D_VDD |  |
| Temperature 1 | 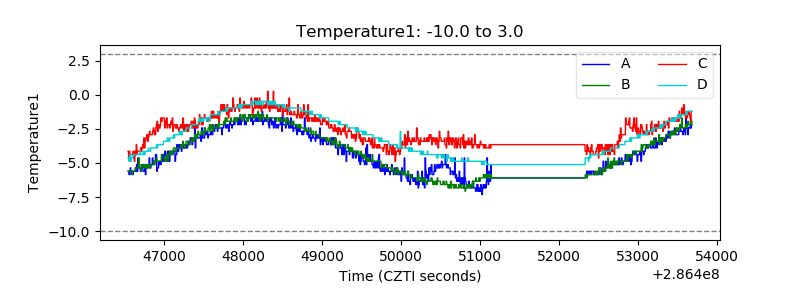 |
| Veto HV Monitor |  |
| Veto LLD |  |
| Alpha Counter |  |
| _CPM_Rate |  |
| CZT Counter |  |
| +2.5 Volts monitor |  |
| +5 Volts monitor |  |
| _ROLL_ROT |  |
| _Roll_DEC |  |
| _Roll_RA |  |
| Veto Counter |  |