| Param | Original file | Final file |
|---|---|---|
| Filename | modeM0/AS1A06_003T04_9000002682_18050cztM0_level2.evt | modeM0/AS1A06_003T04_9000002682_18050cztM0_level2_quad_clean.evt |
| Size (bytes) | 478,512,000 | 98,236,800 |
| Size | 456.3 MB | 93.7 MB |
| Events in quadrant A | 3,099,278 | 660,960 |
| Events in quadrant B | 3,461,987 | 658,041 |
| Events in quadrant C | 3,100,795 | 615,874 |
| Events in quadrant D | 4,411,734 | 610,166 |
| Mode SS | |||
|---|---|---|---|
| Quadrant | BADHDUFLAG | Total packets | Discarded packets |
| A | 0 | 126 | 0 |
| B | 0 | 126 | 0 |
| C | 0 | 126 | 0 |
| D | 0 | 126 | 0 |
| Mode M0 | |||
|---|---|---|---|
| Quadrant | BADHDUFLAG | Total packets | Discarded packets |
| A | 0 | 12897 | 2 |
| B | 0 | 14030 | 2 |
| C | 0 | 12914 | 2 |
| D | 0 | 17111 | 2 |
| Mode M9 | |||
|---|---|---|---|
| Quadrant | BADHDUFLAG | Total packets | Discarded packets |
| A | 0 | 12 | 0 |
| B | 0 | 12 | 0 |
| C | 0 | 12 | 0 |
| D | 0 | 12 | 0 |
| Quadrant | Total seconds | Saturated seconds | Saturation percentage |
|---|---|---|---|
| A | 6157 | 93 | 1.510476% |
| B | 6157 | 104 | 1.689134% |
| C | 6157 | 83 | 1.348059% |
| D | 6158 | 213 | 3.458915% |
Noise dominated data is calculated using 1-second bins in cleaned event files. If a bin has >2000 counts, and if more than 50% of those come from <1% of pixels, then it is considered to be noise-dominated and hence unusable.
| Quadrant | # 1 sec bins | Bins with >0 counts | Bins with >2000 counts | High rate bins dominated by noise | Noise dominated (total time) | Noise dominated (detector-on time) | Marked lightcurve |
|---|---|---|---|---|---|---|---|
| A | 7442 | 6159 | 0 | 0 | 0.00% | 0.00% | 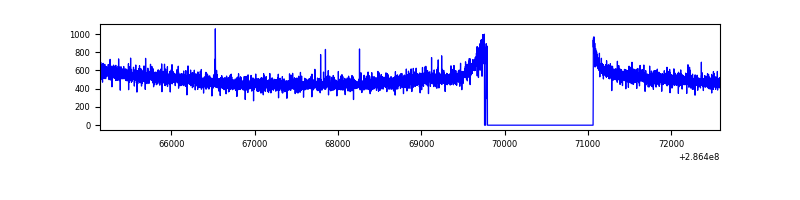 |
| B | 7442 | 6159 | 24 | 24 | 0.32% | 0.39% | 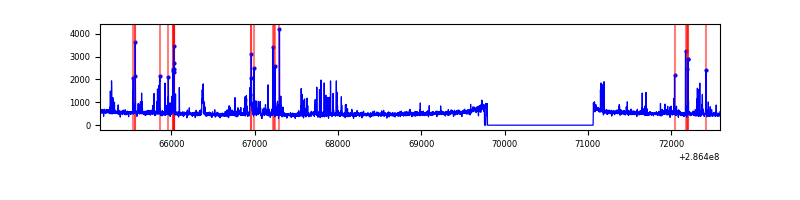 |
| C | 7442 | 6159 | 0 | 0 | 0.00% | 0.00% | 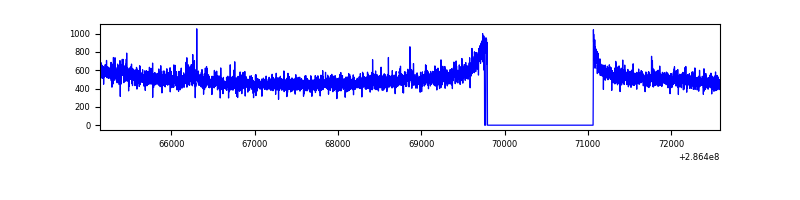 |
| D | 7443 | 6160 | 147 | 147 | 1.98% | 2.39% | 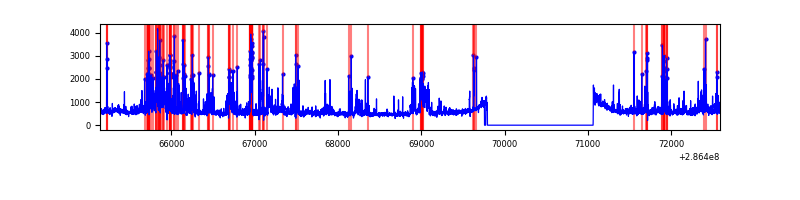 |
Top three noisy pixels from each quadrant. If the there are fewer than three noisy pixels in the level2.evt file, extra rows are filled as -1
| Pixel properties | Quadrant properties | ||||||
|---|---|---|---|---|---|---|---|
| Quadrant | DetID | PixID | Counts | Sigma | Mean | Median | Sigma |
| A | 14 | 111 | 10328 | 59.52 | 802 | 789 | 160.3 |
| A | 0 | 226 | 7066 | 39.17 | 802 | 789 | 160.3 |
| A | 12 | 194 | 5947 | 32.18 | 802 | 789 | 160.3 |
| B | 3 | 64 | 268594 | 1814.35 | 790 | 772 | 147.6 |
| B | 4 | 216 | 43954 | 292.53 | 790 | 772 | 147.6 |
| B | 7 | 220 | 29241 | 192.86 | 790 | 772 | 147.6 |
| C | 14 | 238 | 118424 | 677.26 | 753 | 761 | 173.7 |
| C | 8 | 208 | 27944 | 156.46 | 753 | 761 | 173.7 |
| C | 0 | 207 | 11769 | 63.36 | 753 | 761 | 173.7 |
| D | 1 | 52 | 726144 | 3878.39 | 774 | 753 | 187.0 |
| D | 7 | 238 | 266352 | 1420.06 | 774 | 753 | 187.0 |
| D | 5 | 222 | 213154 | 1135.63 | 774 | 753 | 187.0 |
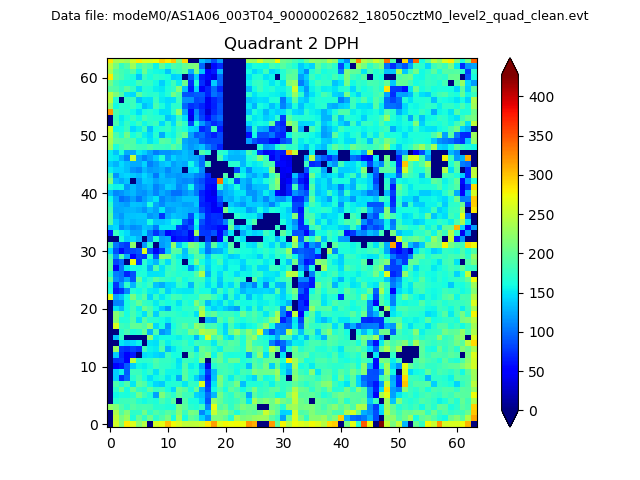
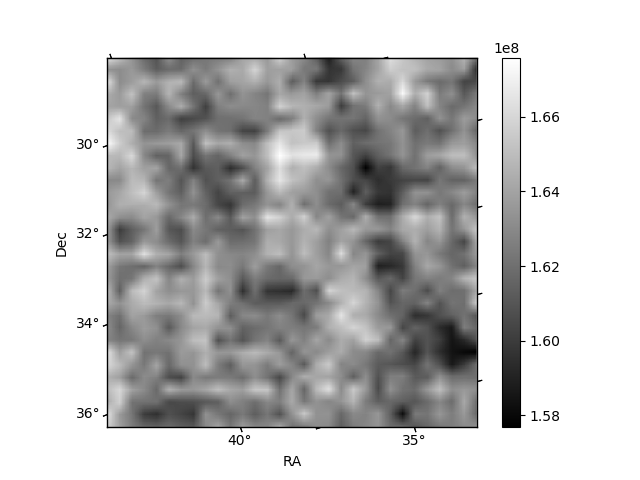
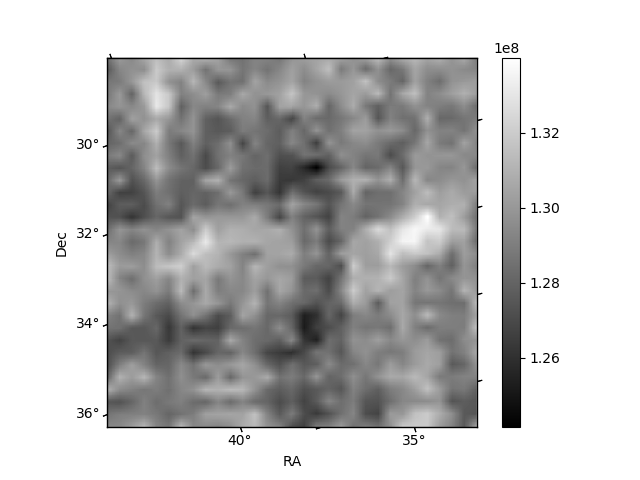
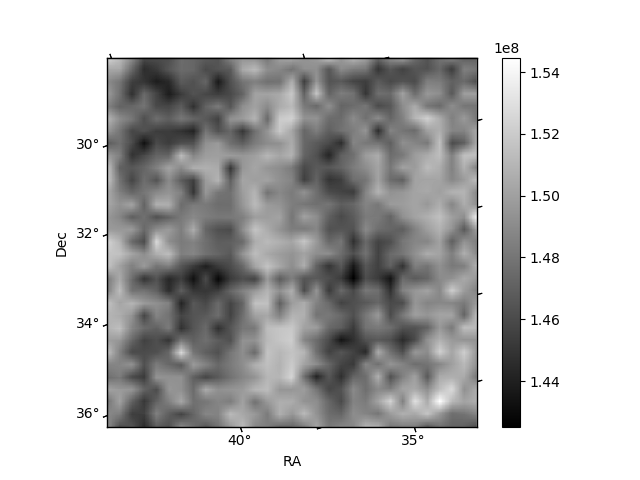
Histogram calculated using DETX and DETY for each event in the final _common_clean file
| Quadrant A | 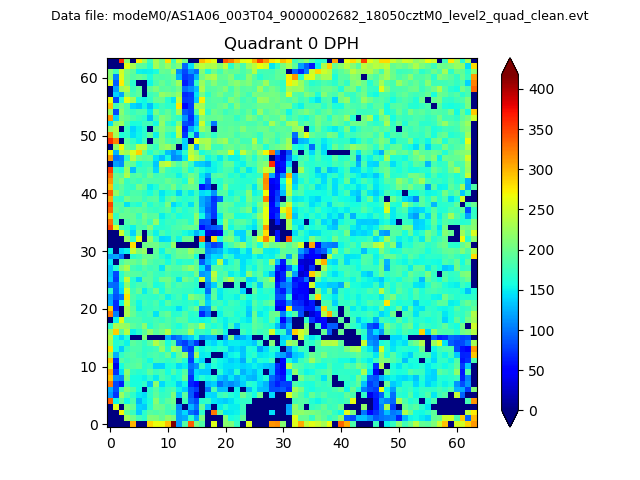 |
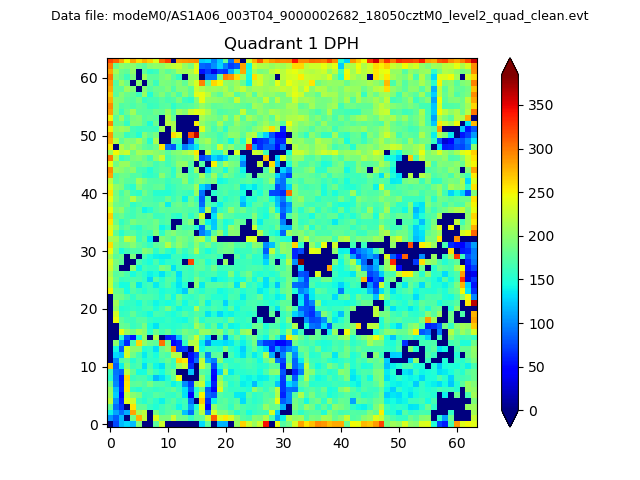 |
Quadrant B |
|---|---|---|---|
| Quadrant D | 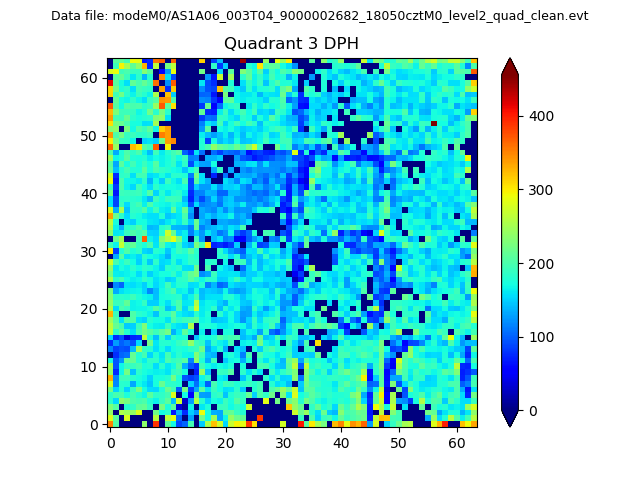 |
 |
Quadrant C |
| Plot type | Count rate plots | Images |
|---|---|---|
| Comparison with Poisson distribution Blue bars denote a histogram of data divided into 1 sec bins. Red curve is a Poisson curve with rate = median count rate of data. |
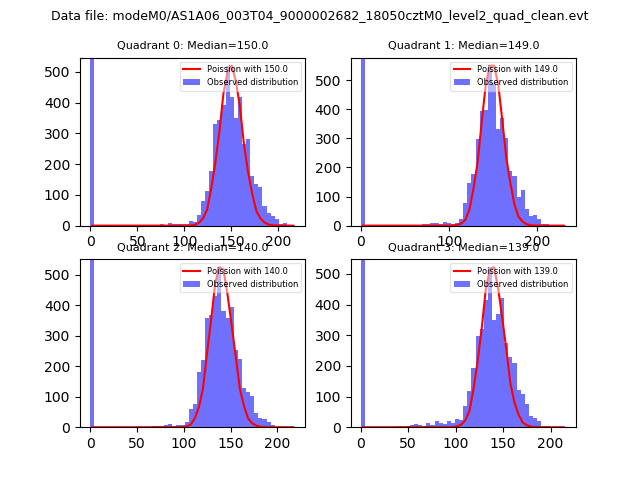 |
 |
| Quadrant-wise count rates Data is divided into 100 sec bins |
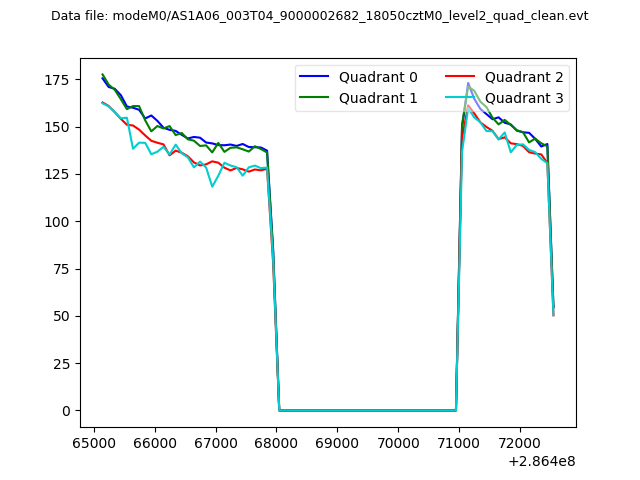 |
|
| Module-wise count rates for Quadrant A Data is divided into 100 sec bins |
 |
 |
| Module-wise count rates for Quadrant B Data is divided into 100 sec bins |
 |
 |
| Module-wise count rates for Quadrant C Data is divided into 100 sec bins |
 |
 |
| Module-wise count rates for Quadrant D Data is divided into 100 sec bins |
 |
 |
| Parameter | Plot |
|---|---|
| CZT HV Monitor |  |
| D_VDD | 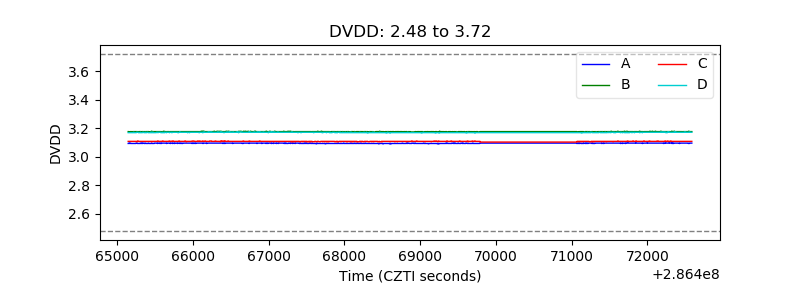 |
| Temperature 1 | 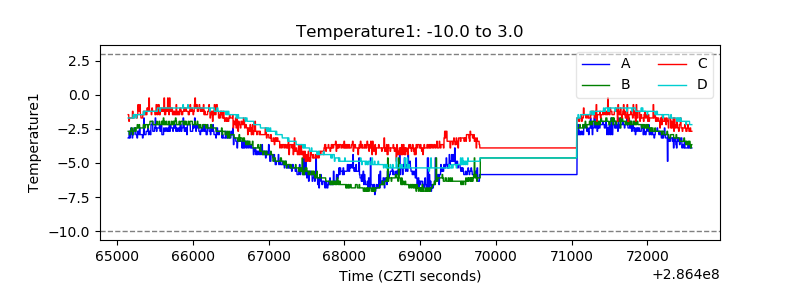 |
| Veto HV Monitor | 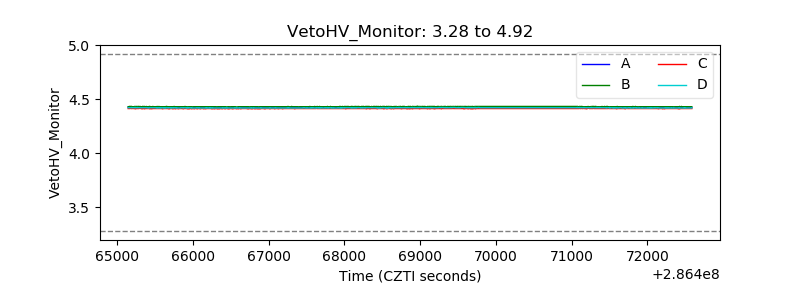 |
| Veto LLD | 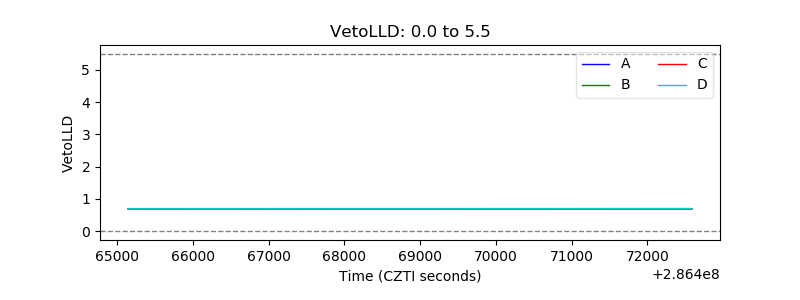 |
| Alpha Counter | 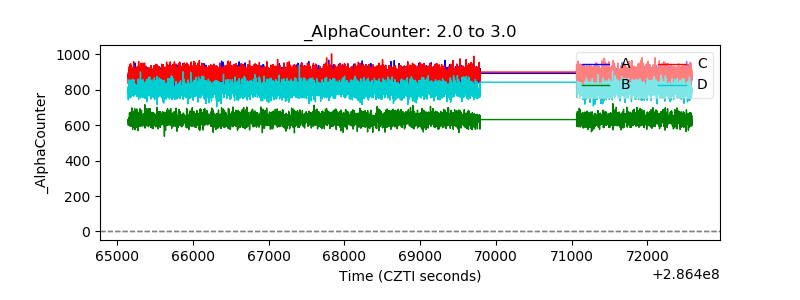 |
| _CPM_Rate | 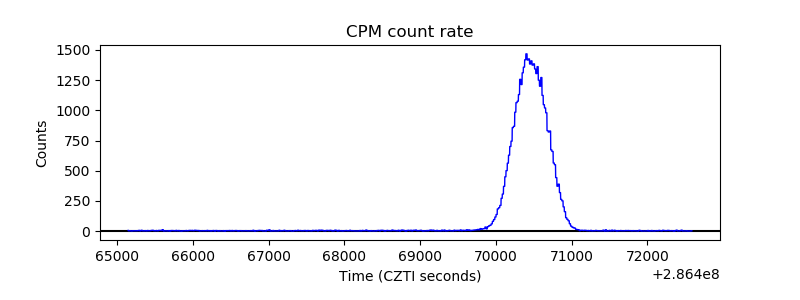 |
| CZT Counter | 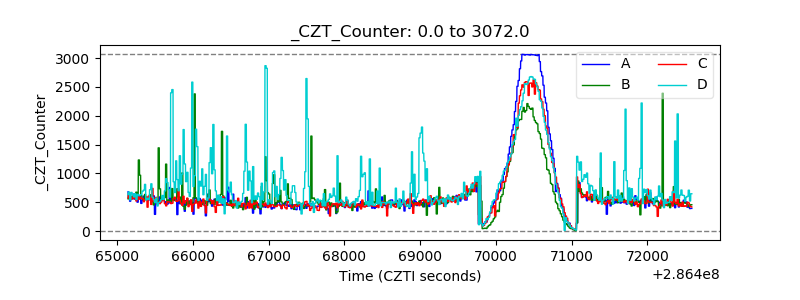 |
| +2.5 Volts monitor |  |
| +5 Volts monitor | 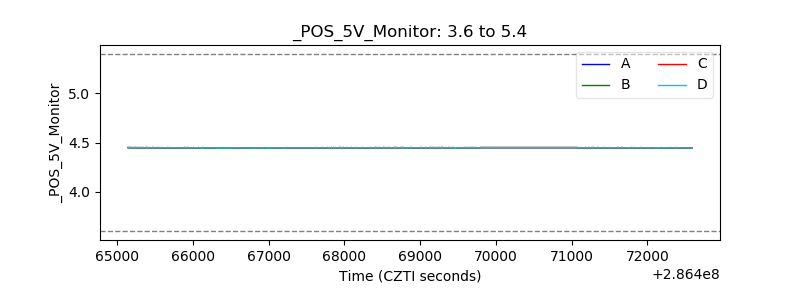 |
| _ROLL_ROT |  |
| _Roll_DEC | 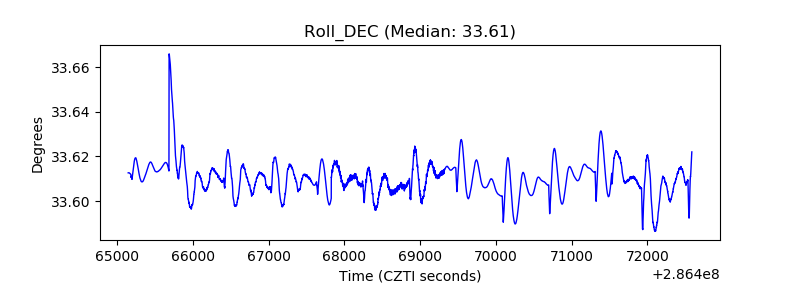 |
| _Roll_RA | 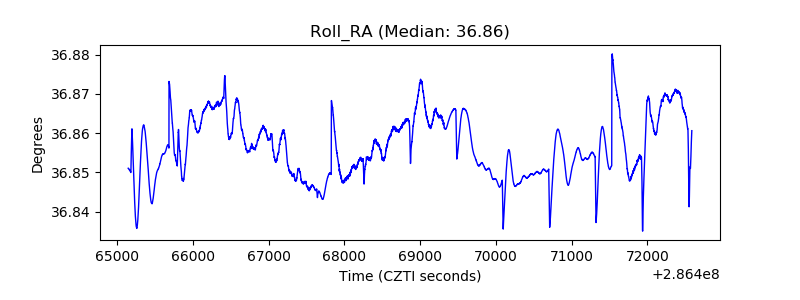 |
| Veto Counter |  |