| Param | Original file | Final file |
|---|---|---|
| Filename | modeM0/AS1A06_003T04_9000002682_18052cztM0_level2.evt | modeM0/AS1A06_003T04_9000002682_18052cztM0_level2_quad_clean.evt |
| Size (bytes) | 506,494,080 | 92,856,960 |
| Size | 483.0 MB | 88.6 MB |
| Events in quadrant A | 3,159,956 | 604,229 |
| Events in quadrant B | 3,470,146 | 603,340 |
| Events in quadrant C | 3,183,749 | 575,915 |
| Events in quadrant D | 5,072,735 | 563,566 |
| Mode SS | |||
|---|---|---|---|
| Quadrant | BADHDUFLAG | Total packets | Discarded packets |
| A | 0 | 134 | 0 |
| B | 0 | 134 | 0 |
| C | 0 | 134 | 0 |
| D | 0 | 134 | 0 |
| Mode M0 | |||
|---|---|---|---|
| Quadrant | BADHDUFLAG | Total packets | Discarded packets |
| A | 0 | 13765 | 2 |
| B | 0 | 14573 | 2 |
| C | 0 | 13729 | 2 |
| D | 0 | 19664 | 3 |
| Mode M9 | |||
|---|---|---|---|
| Quadrant | BADHDUFLAG | Total packets | Discarded packets |
| A | 0 | 17 | 0 |
| B | 0 | 18 | 0 |
| C | 0 | 18 | 0 |
| D | 0 | 18 | 0 |
| Quadrant | Total seconds | Saturated seconds | Saturation percentage |
|---|---|---|---|
| A | 6673 | 37 | 0.554473% |
| B | 6673 | 100 | 1.498576% |
| C | 6673 | 65 | 0.974075% |
| D | 6672 | 350 | 5.245803% |
Noise dominated data is calculated using 1-second bins in cleaned event files. If a bin has >2000 counts, and if more than 50% of those come from <1% of pixels, then it is considered to be noise-dominated and hence unusable.
| Quadrant | # 1 sec bins | Bins with >0 counts | Bins with >2000 counts | High rate bins dominated by noise | Noise dominated (total time) | Noise dominated (detector-on time) | Marked lightcurve |
|---|---|---|---|---|---|---|---|
| A | 7563 | 6674 | 2 | 2 | 0.03% | 0.03% | 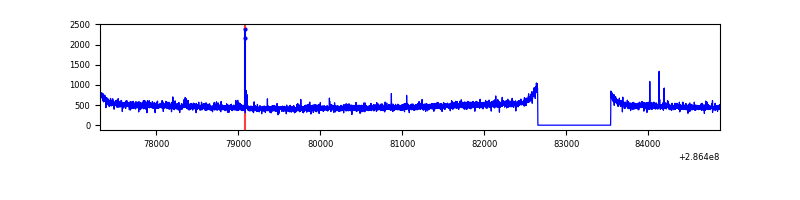 |
| B | 7563 | 6674 | 48 | 48 | 0.63% | 0.72% | 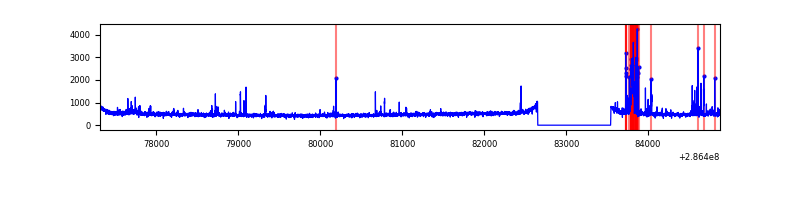 |
| C | 7563 | 6674 | 1 | 1 | 0.01% | 0.01% | 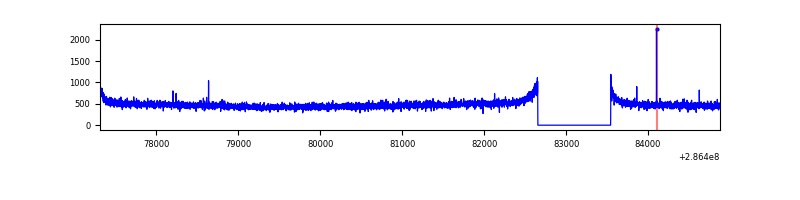 |
| D | 7562 | 6673 | 221 | 221 | 2.92% | 3.31% | 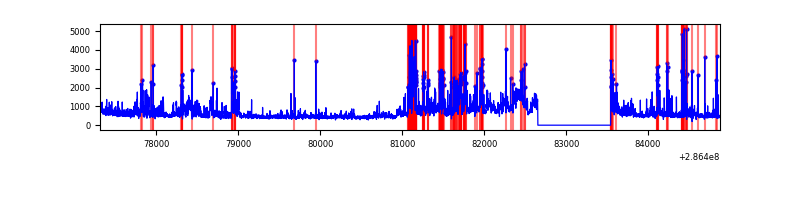 |
Top three noisy pixels from each quadrant. If the there are fewer than three noisy pixels in the level2.evt file, extra rows are filled as -1
| Pixel properties | Quadrant properties | ||||||
|---|---|---|---|---|---|---|---|
| Quadrant | DetID | PixID | Counts | Sigma | Mean | Median | Sigma |
| A | 15 | 174 | 13778 | 79.04 | 814 | 797 | 164.2 |
| A | 5 | 98 | 8080 | 44.34 | 814 | 797 | 164.2 |
| A | 0 | 226 | 6971 | 37.59 | 814 | 797 | 164.2 |
| B | 3 | 64 | 130829 | 850.58 | 808 | 788 | 152.9 |
| B | 7 | 220 | 75631 | 489.54 | 808 | 788 | 152.9 |
| B | 0 | 197 | 41653 | 267.29 | 808 | 788 | 152.9 |
| C | 14 | 238 | 122220 | 665.76 | 780 | 786 | 182.4 |
| C | 0 | 207 | 7475 | 36.67 | 780 | 786 | 182.4 |
| C | 13 | 61 | 5467 | 25.66 | 780 | 786 | 182.4 |
| D | 11 | 176 | 889971 | 4657.92 | 782 | 759 | 190.9 |
| D | 1 | 52 | 767980 | 4018.9 | 782 | 759 | 190.9 |
| D | 7 | 238 | 284122 | 1484.33 | 782 | 759 | 190.9 |
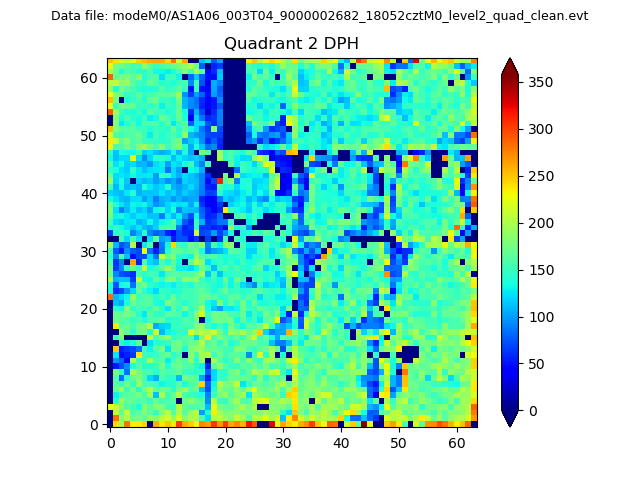
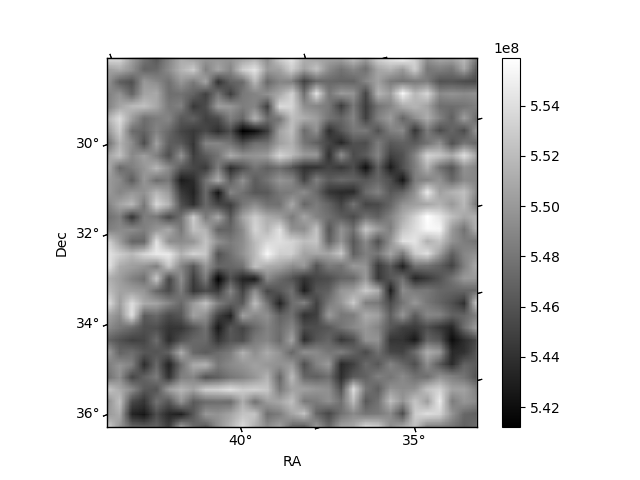
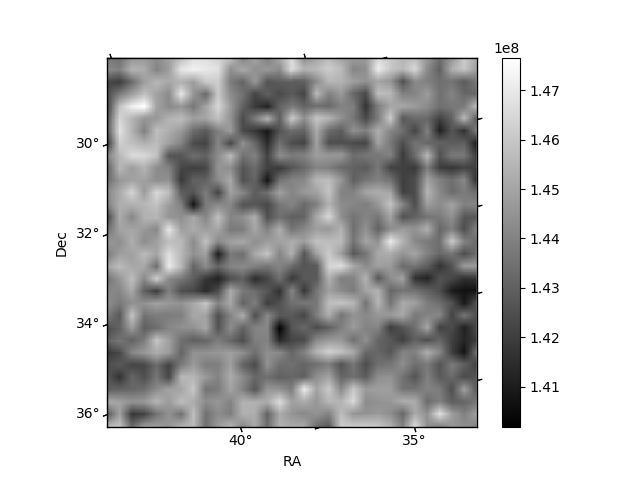
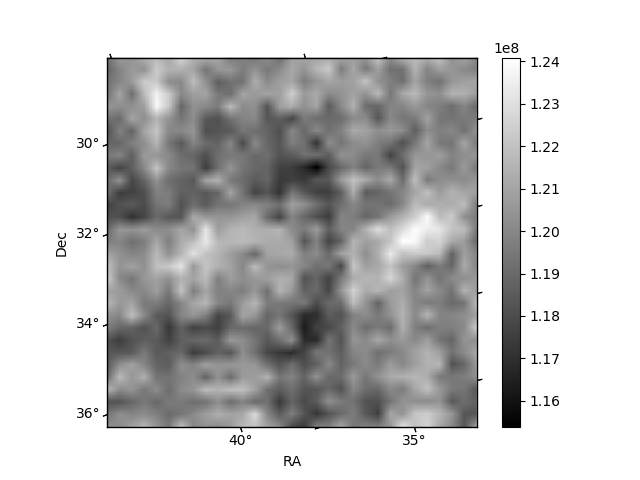
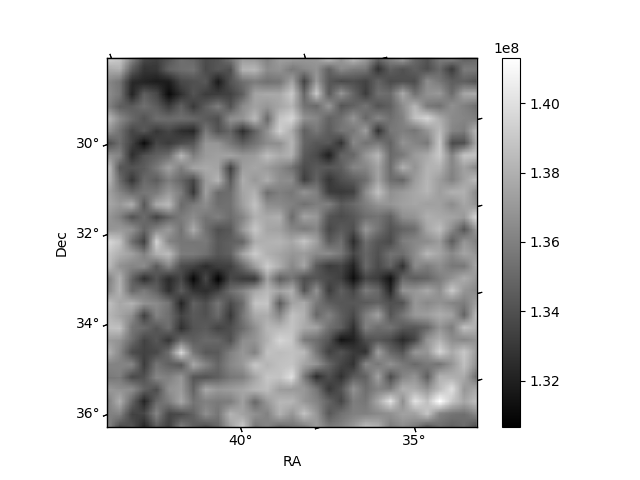
Histogram calculated using DETX and DETY for each event in the final _common_clean file
| Quadrant A | 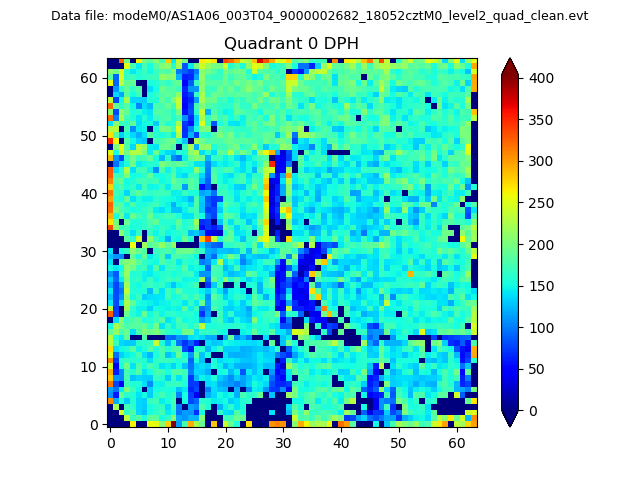 |
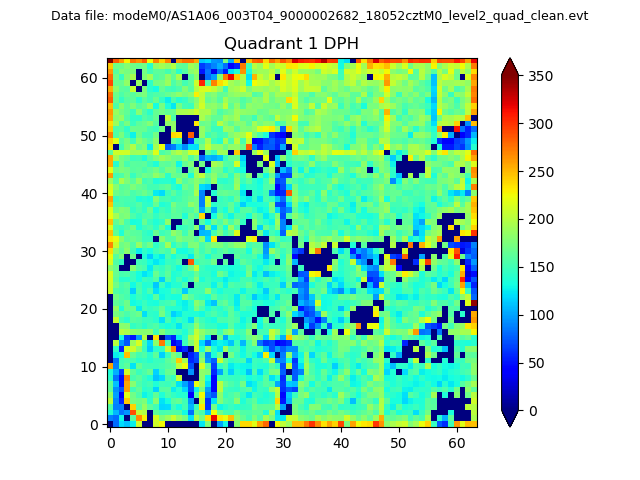 |
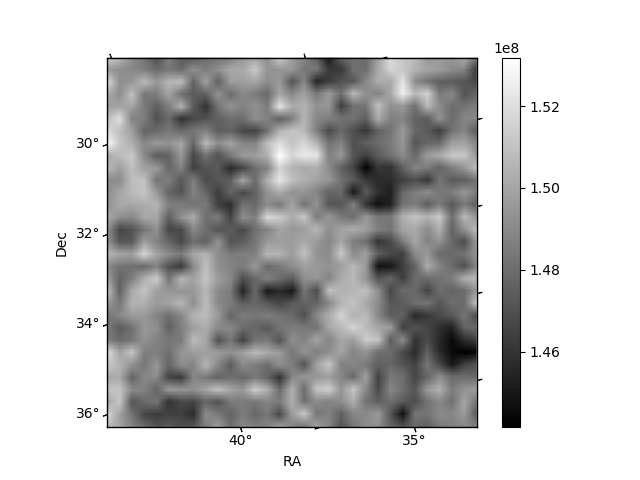
Quadrant B |
|---|---|---|---|
| Quadrant D | 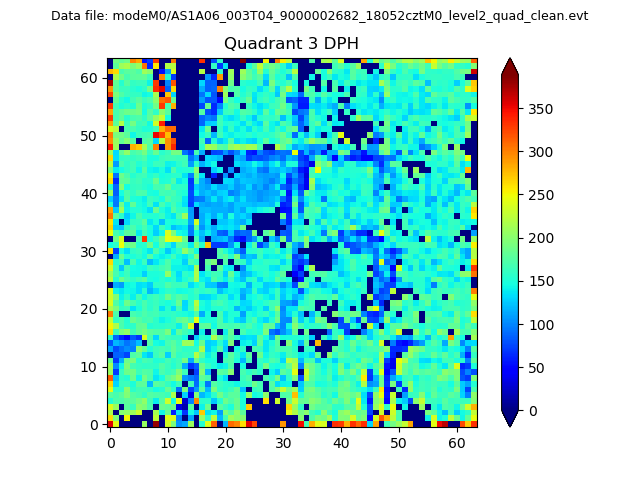 |
 |
Quadrant C |
| Plot type | Count rate plots | Images |
|---|---|---|
| Comparison with Poisson distribution Blue bars denote a histogram of data divided into 1 sec bins. Red curve is a Poisson curve with rate = median count rate of data. |
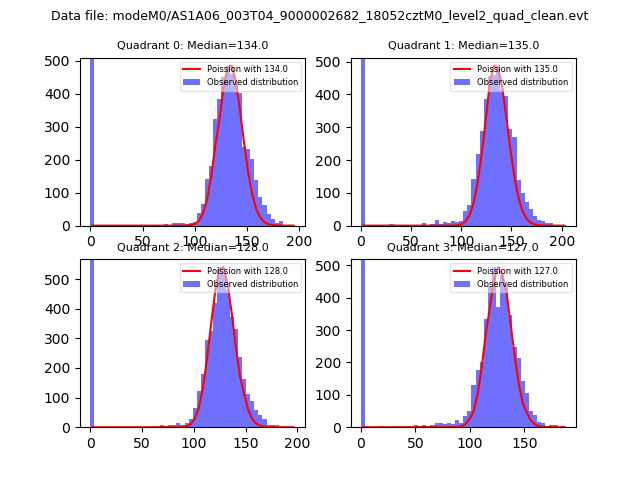 |
 |
| Quadrant-wise count rates Data is divided into 100 sec bins |
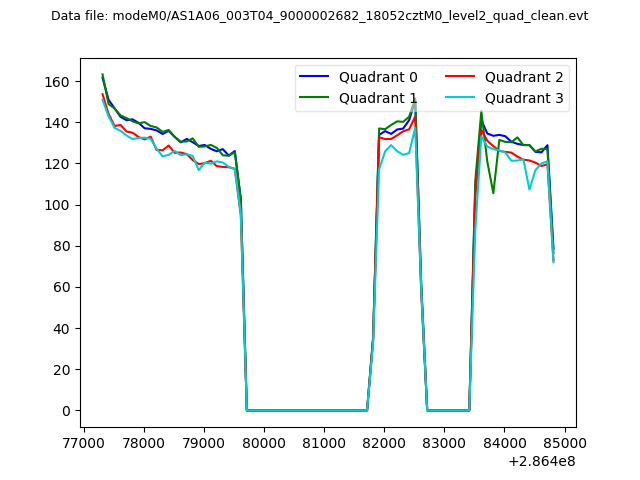 |
|
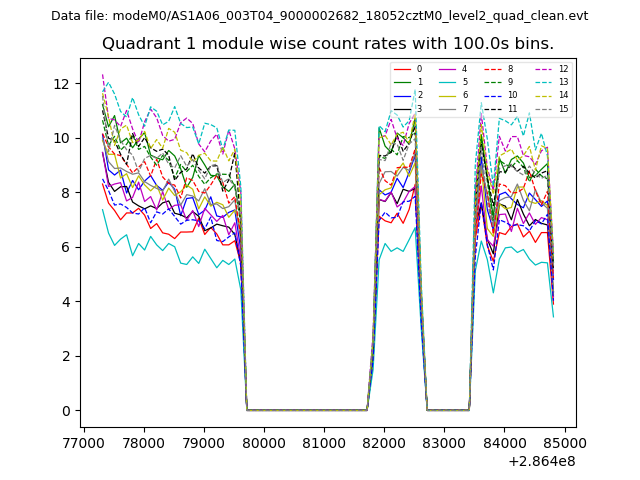
| Module-wise count rates for Quadrant A Data is divided into 100 sec bins |
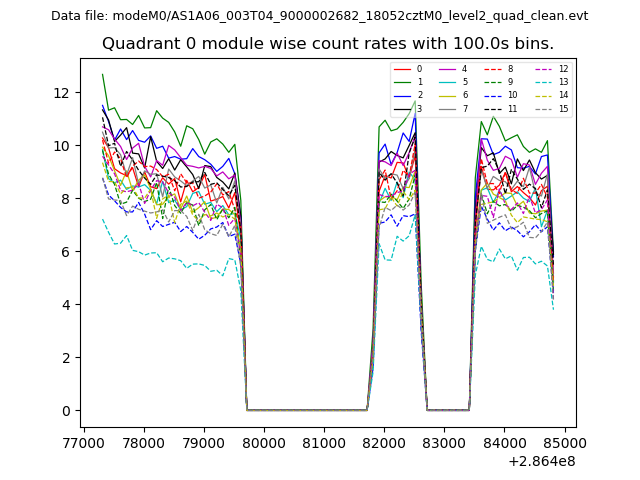 |
 |
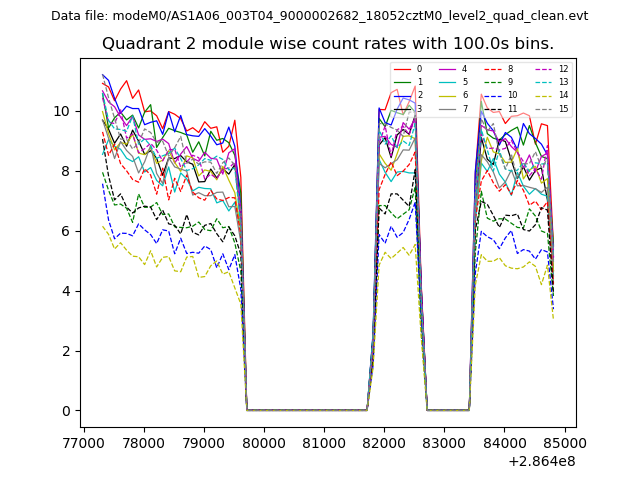
| Module-wise count rates for Quadrant B Data is divided into 100 sec bins |
 |
 |
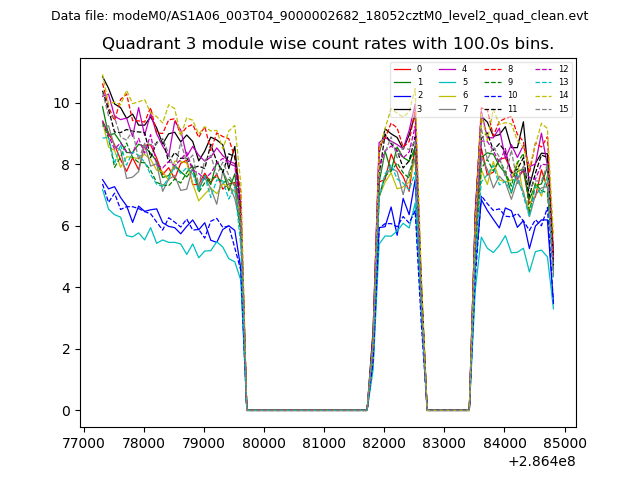
| Module-wise count rates for Quadrant C Data is divided into 100 sec bins |
 |
 |
| Module-wise count rates for Quadrant D Data is divided into 100 sec bins |
 |
 |
| Parameter | Plot |
|---|---|
| CZT HV Monitor | 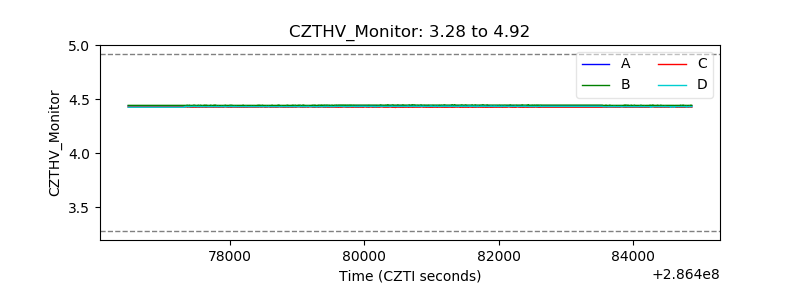 |
| D_VDD | 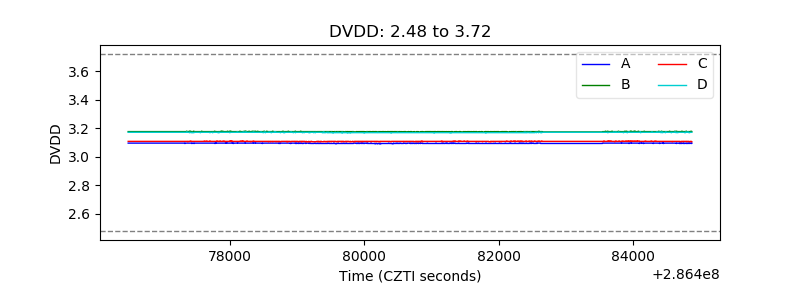 |
| Temperature 1 | 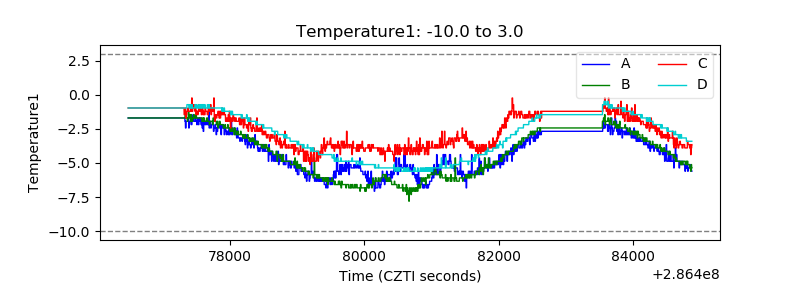 |
| Veto HV Monitor | 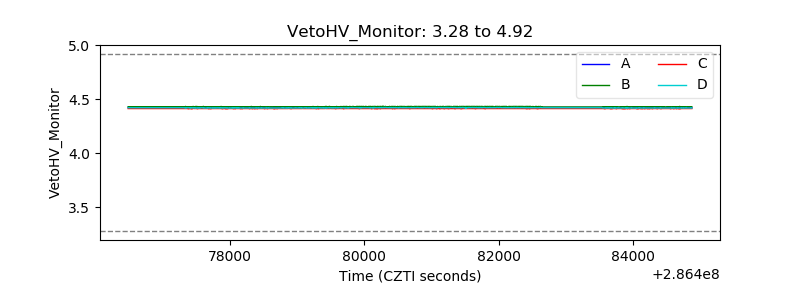 |
| Veto LLD | 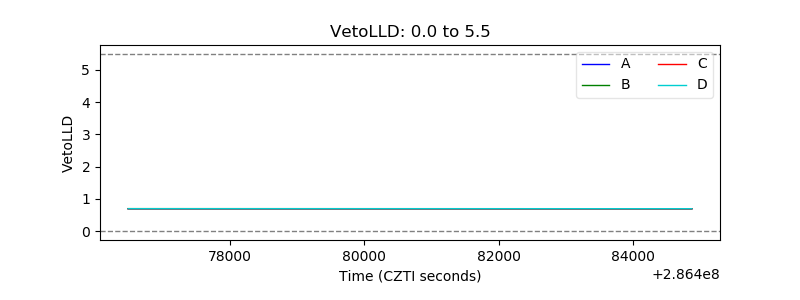 |
| Alpha Counter | 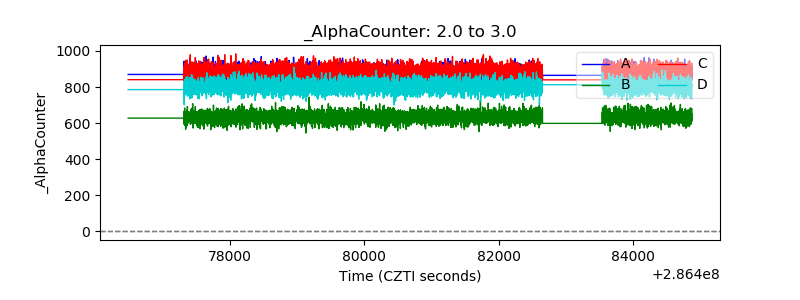 |
| _CPM_Rate | 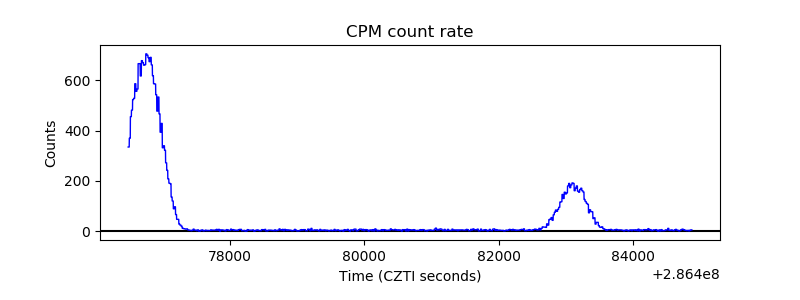 |
| CZT Counter | 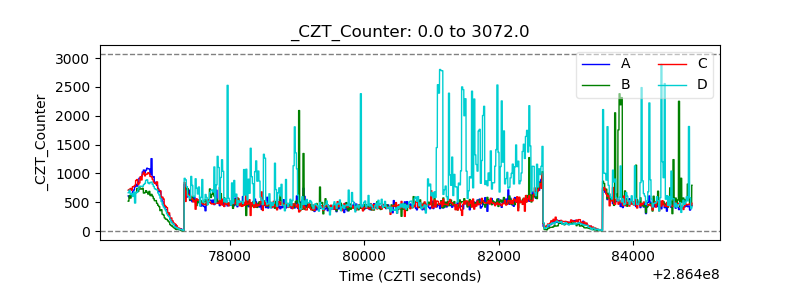 |
| +2.5 Volts monitor |  |
| +5 Volts monitor |  |
| _ROLL_ROT | 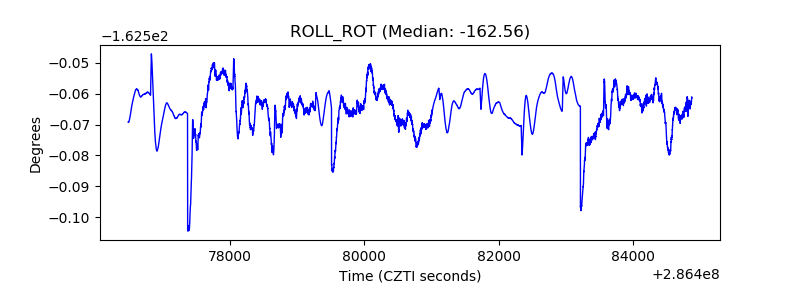 |
| _Roll_DEC | 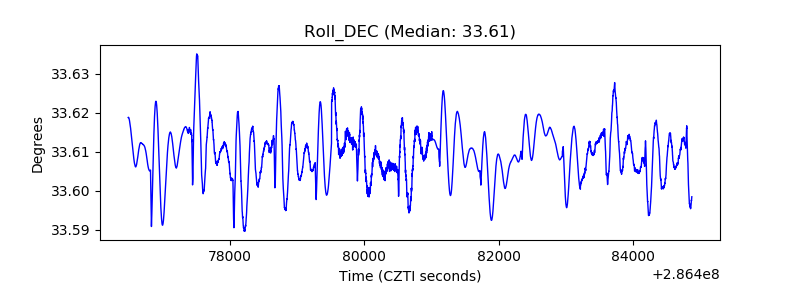 |
| _Roll_RA | 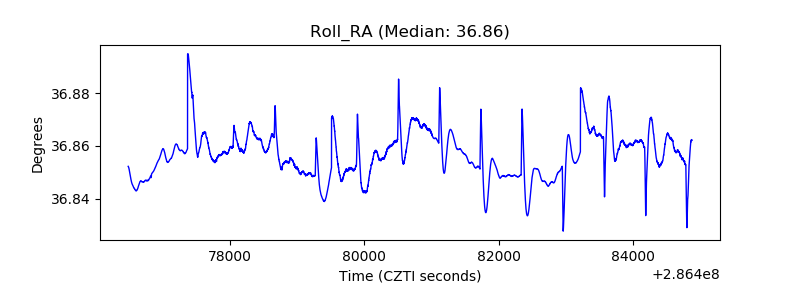 |
| Veto Counter | 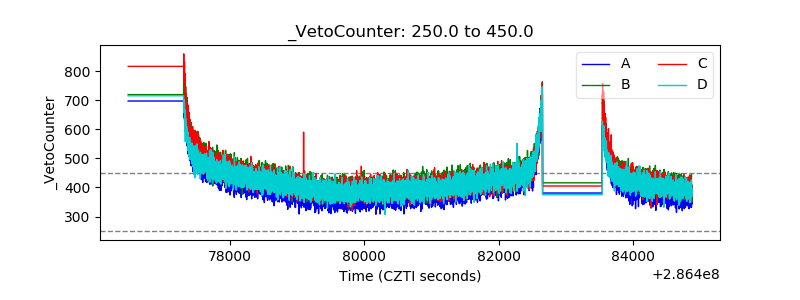 |