| Param | Original file | Final file |
|---|---|---|
| Filename | modeM0/AS1A06_003T04_9000002682_18058cztM0_level2.evt | modeM0/AS1A06_003T04_9000002682_18058cztM0_level2_quad_clean.evt |
| Size (bytes) | 1,258,395,840 | 211,904,640 |
| Size | 1.2 GB | 202.1 MB |
| Events in quadrant A | 8,519,560 | 1,313,070 |
| Events in quadrant B | 8,907,727 | 1,325,391 |
| Events in quadrant C | 8,874,606 | 1,265,561 |
| Events in quadrant D | 10,572,672 | 1,253,909 |
| Mode SS | |||
|---|---|---|---|
| Quadrant | BADHDUFLAG | Total packets | Discarded packets |
| A | 0 | 372 | 0 |
| B | 0 | 372 | 0 |
| C | 0 | 372 | 0 |
| D | 0 | 372 | 0 |
| Mode M0 | |||
|---|---|---|---|
| Quadrant | BADHDUFLAG | Total packets | Discarded packets |
| A | 0 | 37297 | 4 |
| B | 0 | 38119 | 4 |
| C | 0 | 37872 | 4 |
| D | 0 | 43807 | 4 |
| Mode M9 | |||
|---|---|---|---|
| Quadrant | BADHDUFLAG | Total packets | Discarded packets |
| A | 0 | 22 | 0 |
| B | 0 | 23 | 0 |
| C | 0 | 23 | 0 |
| D | 0 | 23 | 0 |
| Quadrant | Total seconds | Saturated seconds | Saturation percentage |
|---|---|---|---|
| A | 18278 | 103 | 0.563519% |
| B | 18278 | 177 | 0.968377% |
| C | 18278 | 202 | 1.105154% |
| D | 18278 | 492 | 2.691761% |
Noise dominated data is calculated using 1-second bins in cleaned event files. If a bin has >2000 counts, and if more than 50% of those come from <1% of pixels, then it is considered to be noise-dominated and hence unusable.
| Quadrant | # 1 sec bins | Bins with >0 counts | Bins with >2000 counts | High rate bins dominated by noise | Noise dominated (total time) | Noise dominated (detector-on time) | Marked lightcurve |
|---|---|---|---|---|---|---|---|
| A | 20418 | 18281 | 3 | 3 | 0.01% | 0.02% | 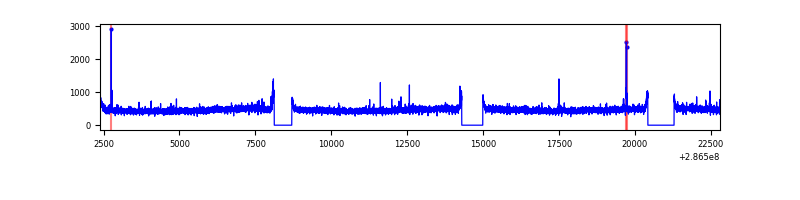 |
| B | 20418 | 18281 | 22 | 22 | 0.11% | 0.12% | 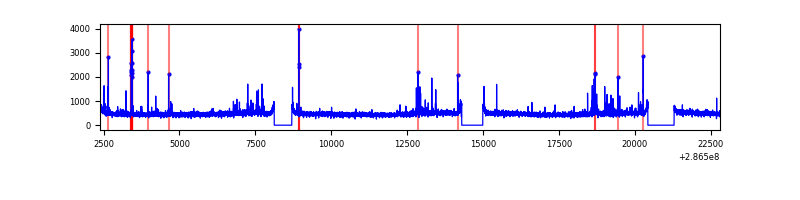 |
| C | 20418 | 18281 | 9 | 9 | 0.04% | 0.05% | 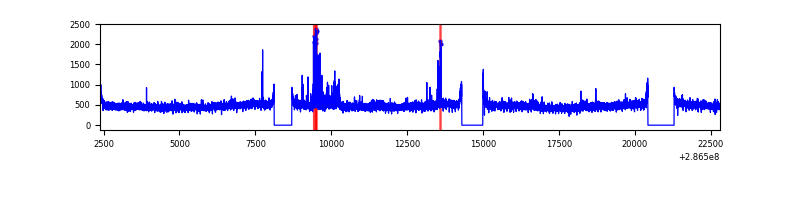 |
| D | 20418 | 18281 | 334 | 334 | 1.64% | 1.83% | 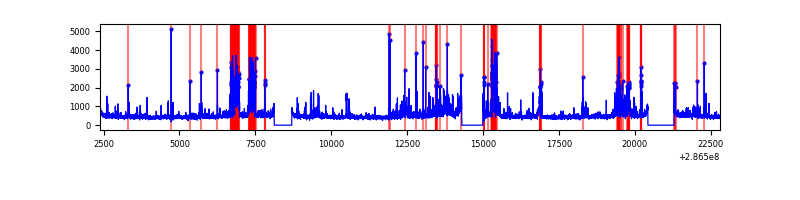 |
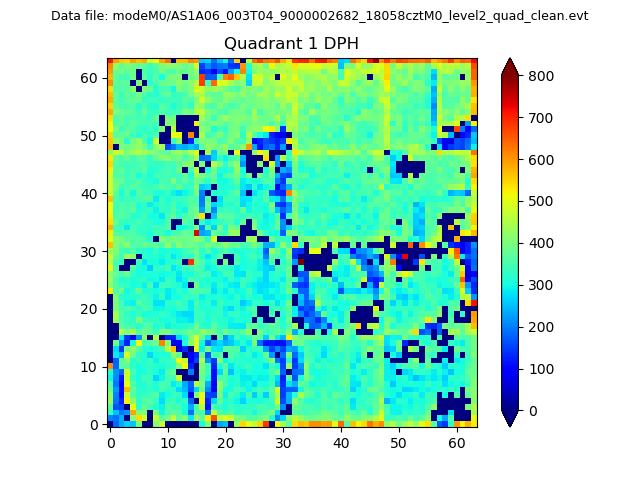
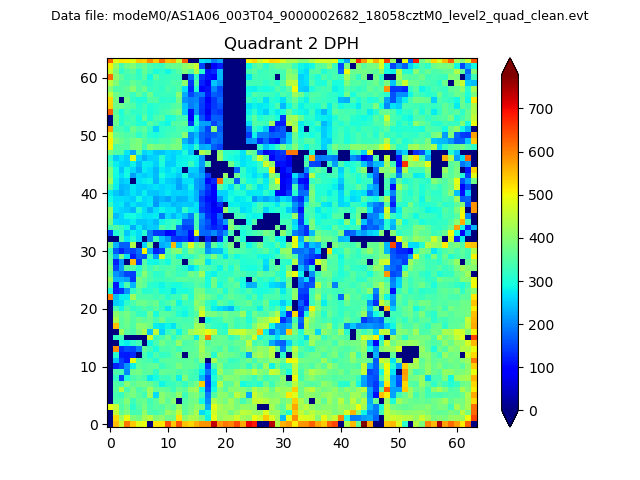
Top three noisy pixels from each quadrant. If the there are fewer than three noisy pixels in the level2.evt file, extra rows are filled as -1
| Pixel properties | Quadrant properties | ||||||
|---|---|---|---|---|---|---|---|
| Quadrant | DetID | PixID | Counts | Sigma | Mean | Median | Sigma |
| A | 15 | 174 | 83943 | 185.53 | 2190 | 2136 | 440.9 |
| A | 0 | 226 | 19102 | 38.48 | 2190 | 2136 | 440.9 |
| A | 3 | 137 | 16895 | 33.47 | 2190 | 2136 | 440.9 |
| B | 3 | 64 | 255620 | 603.25 | 2186 | 2130 | 420.2 |
| B | 12 | 111 | 51055 | 116.43 | 2186 | 2130 | 420.2 |
| B | 11 | 111 | 44553 | 100.96 | 2186 | 2130 | 420.2 |
| C | 14 | 238 | 324803 | 654.51 | 2100 | 2111 | 493.0 |
| C | 0 | 207 | 223453 | 448.94 | 2100 | 2111 | 493.0 |
| C | 3 | 233 | 103866 | 206.39 | 2100 | 2111 | 493.0 |
| D | 5 | 222 | 1462356 | 2845.3 | 2119 | 2058 | 513.2 |
| D | 11 | 176 | 616346 | 1196.9 | 2119 | 2058 | 513.2 |
| D | 10 | 199 | 99243 | 189.36 | 2119 | 2058 | 513.2 |
Histogram calculated using DETX and DETY for each event in the final _common_clean file
| Quadrant A | 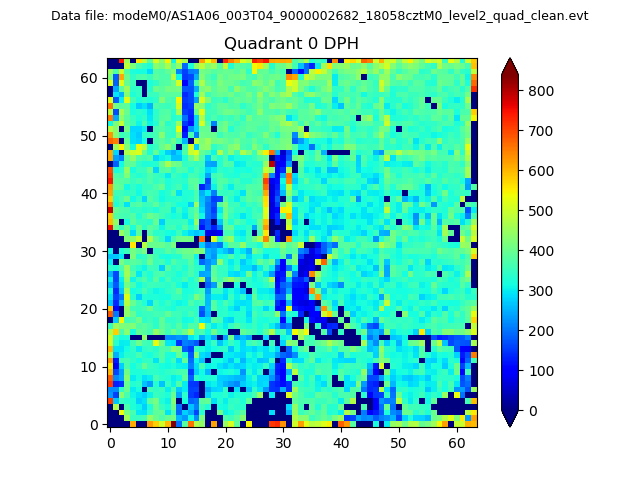 |
 |
Quadrant B |
|---|---|---|---|
| Quadrant D | 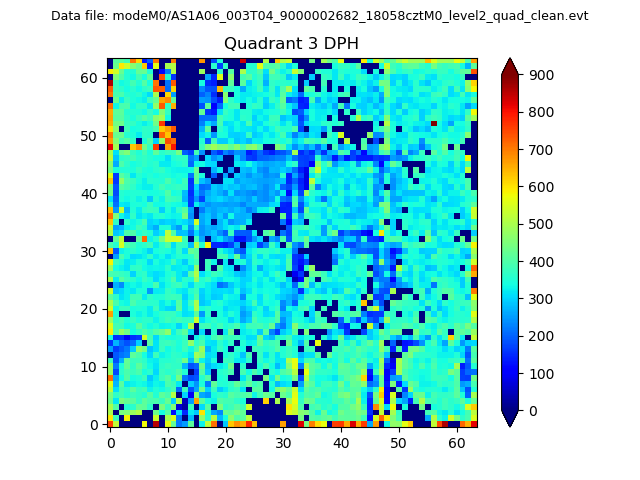 |
 |
Quadrant C |
| Plot type | Count rate plots | Images |
|---|---|---|
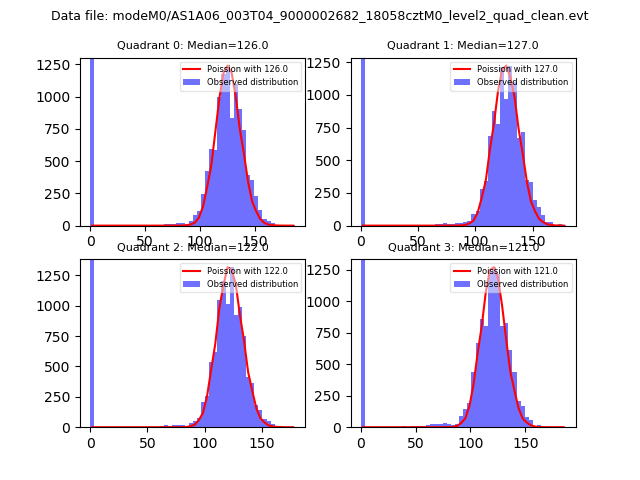
| Comparison with Poisson distribution Blue bars denote a histogram of data divided into 1 sec bins. Red curve is a Poisson curve with rate = median count rate of data. |
 |
 |
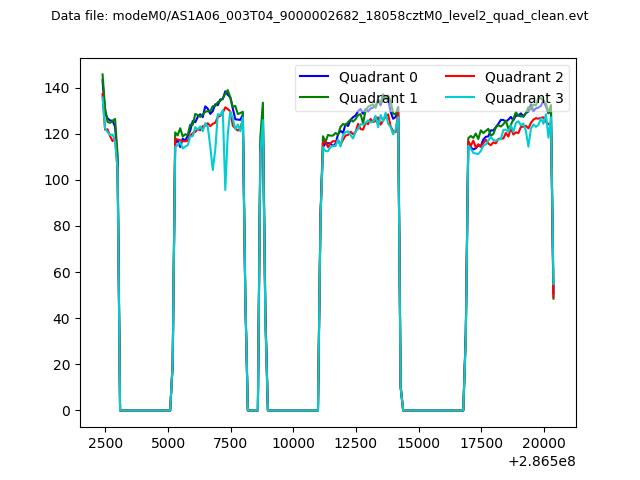
| Quadrant-wise count rates Data is divided into 100 sec bins |
 |
|
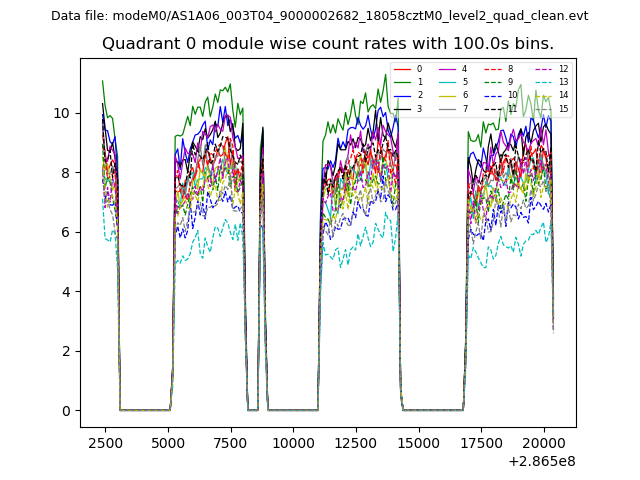
| Module-wise count rates for Quadrant A Data is divided into 100 sec bins |
 |
 |
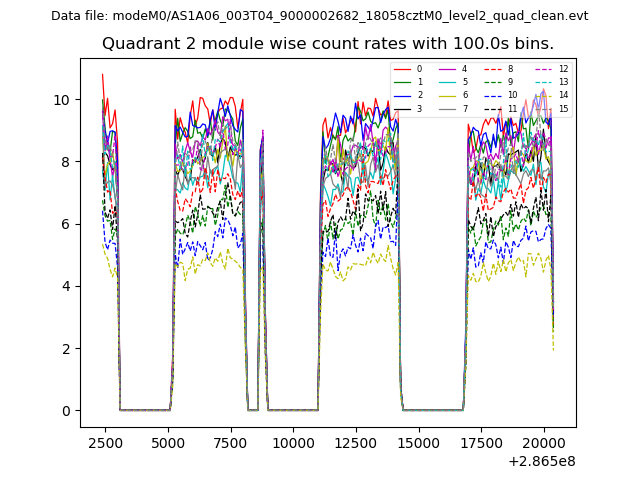
| Module-wise count rates for Quadrant B Data is divided into 100 sec bins |
 |
 |
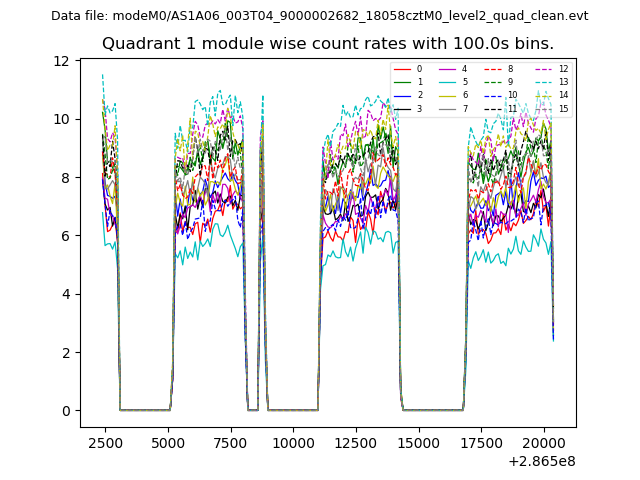
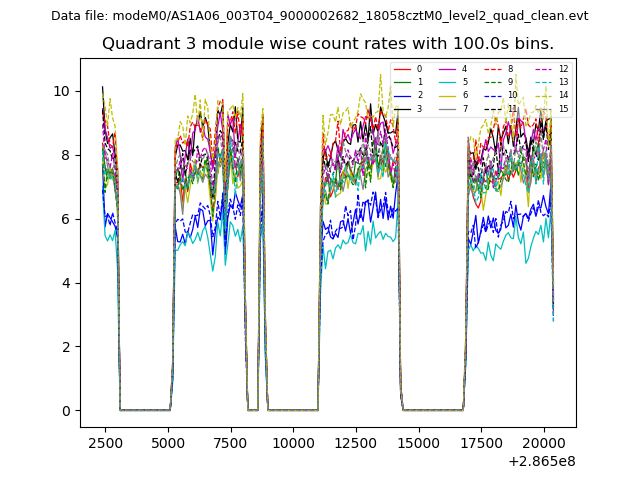
| Module-wise count rates for Quadrant C Data is divided into 100 sec bins |
 |
 |
| Module-wise count rates for Quadrant D Data is divided into 100 sec bins |
 |
 |
| Parameter | Plot |
|---|---|
| CZT HV Monitor | 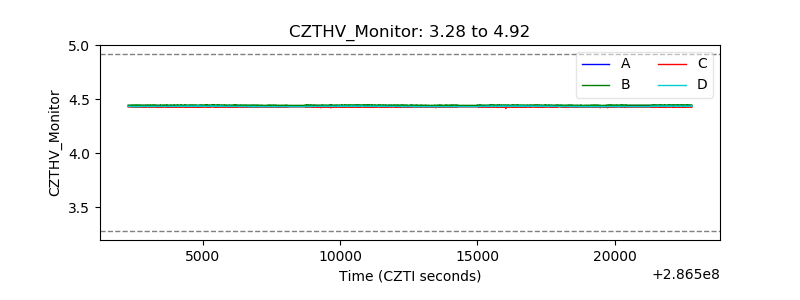 |
| D_VDD |  |
| Temperature 1 | 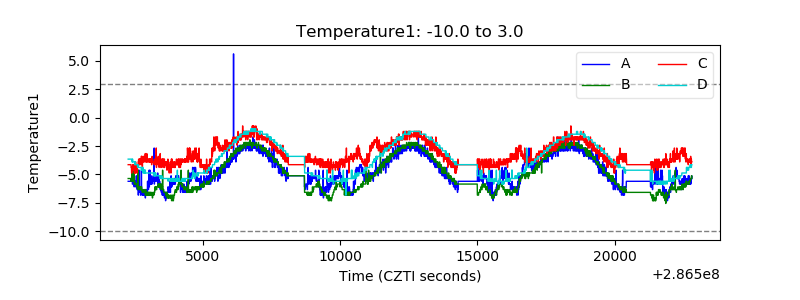 |
| Veto HV Monitor |  |
| Veto LLD | 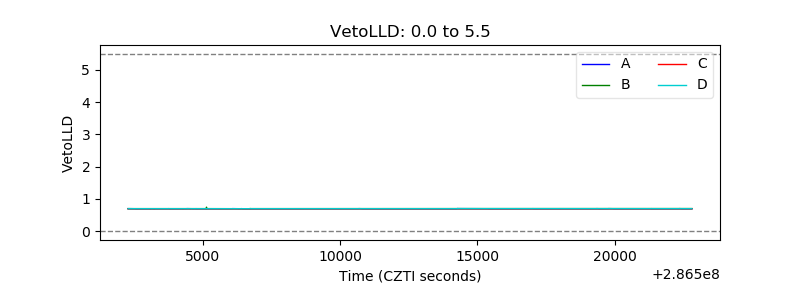 |
| Alpha Counter | 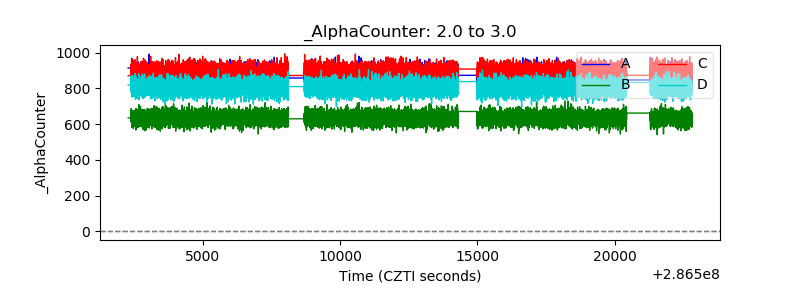 |
| _CPM_Rate | 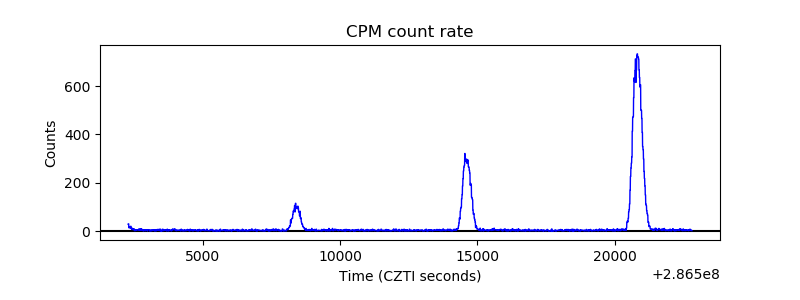 |
| CZT Counter | 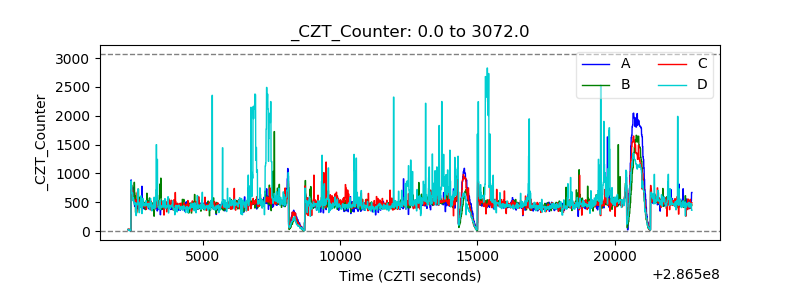 |
| +2.5 Volts monitor |  |
| +5 Volts monitor |  |
| _ROLL_ROT | 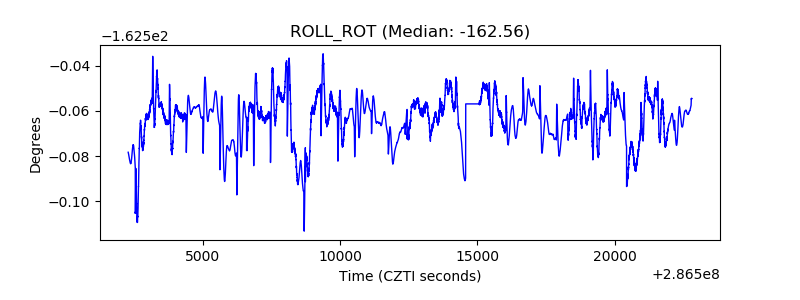 |
| _Roll_DEC | 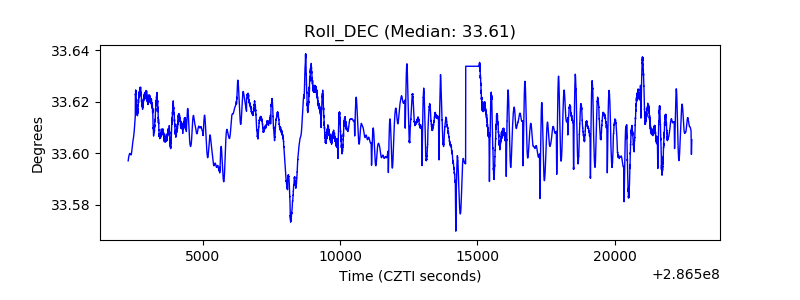 |
| _Roll_RA | 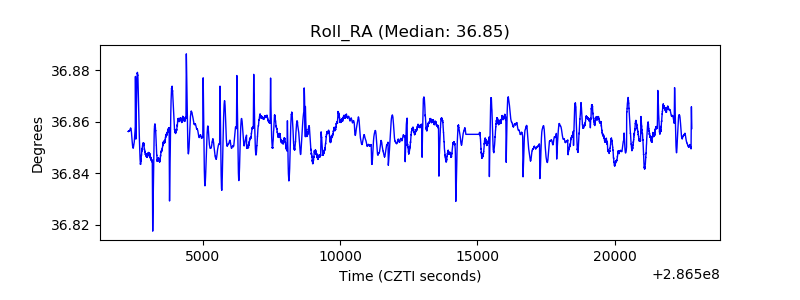 |
| Veto Counter | 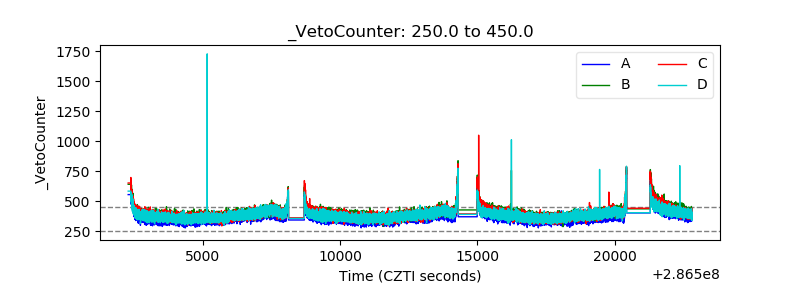 |