| Param | Original file | Final file |
|---|---|---|
| Filename | modeM0/AS1A06_003T04_9000002682_18061cztM0_level2.evt | modeM0/AS1A06_003T04_9000002682_18061cztM0_level2_quad_clean.evt |
| Size (bytes) | 472,677,120 | 90,316,800 |
| Size | 450.8 MB | 86.1 MB |
| Events in quadrant A | 3,294,151 | 586,706 |
| Events in quadrant B | 3,345,702 | 590,697 |
| Events in quadrant C | 3,223,504 | 556,559 |
| Events in quadrant D | 4,011,935 | 549,324 |
| Mode SS | |||
|---|---|---|---|
| Quadrant | BADHDUFLAG | Total packets | Discarded packets |
| A | 0 | 134 | 0 |
| B | 0 | 134 | 0 |
| C | 0 | 134 | 0 |
| D | 0 | 134 | 0 |
| Mode M0 | |||
|---|---|---|---|
| Quadrant | BADHDUFLAG | Total packets | Discarded packets |
| A | 0 | 13889 | 2 |
| B | 0 | 14034 | 2 |
| C | 0 | 13632 | 2 |
| D | 0 | 16118 | 2 |
| Mode M9 | |||
|---|---|---|---|
| Quadrant | BADHDUFLAG | Total packets | Discarded packets |
| A | 0 | 13 | 0 |
| B | 0 | 14 | 0 |
| C | 0 | 14 | 0 |
| D | 0 | 14 | 0 |
| Quadrant | Total seconds | Saturated seconds | Saturation percentage |
|---|---|---|---|
| A | 6469 | 37 | 0.571959% |
| B | 6469 | 48 | 0.742000% |
| C | 6469 | 48 | 0.742000% |
| D | 6469 | 91 | 1.406709% |
Noise dominated data is calculated using 1-second bins in cleaned event files. If a bin has >2000 counts, and if more than 50% of those come from <1% of pixels, then it is considered to be noise-dominated and hence unusable.
| Quadrant | # 1 sec bins | Bins with >0 counts | Bins with >2000 counts | High rate bins dominated by noise | Noise dominated (total time) | Noise dominated (detector-on time) | Marked lightcurve |
|---|---|---|---|---|---|---|---|
| A | 7634 | 6470 | 5 | 5 | 0.07% | 0.08% | 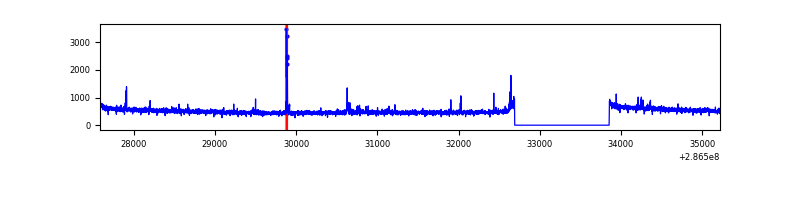 |
| B | 7634 | 6470 | 6 | 6 | 0.08% | 0.09% | 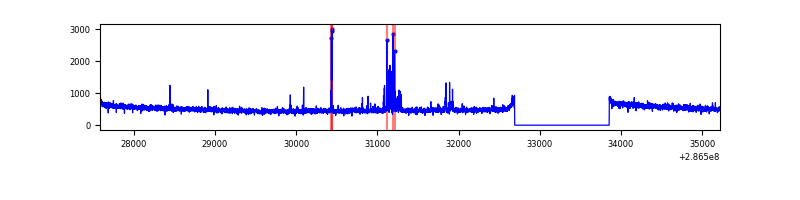 |
| C | 7634 | 6470 | 0 | 0 | 0.00% | 0.00% | 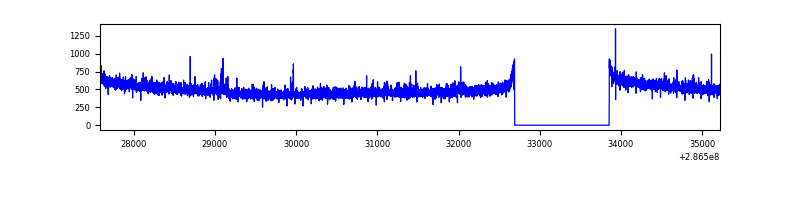 |
| D | 7634 | 6470 | 69 | 69 | 0.90% | 1.07% | 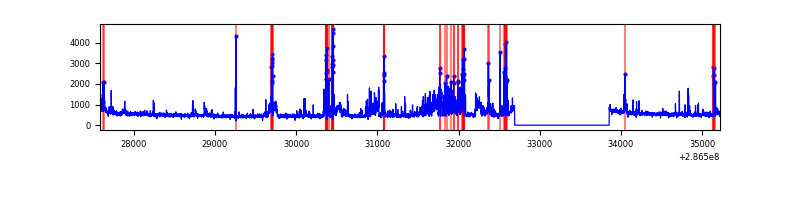 |
Top three noisy pixels from each quadrant. If the there are fewer than three noisy pixels in the level2.evt file, extra rows are filled as -1
| Pixel properties | Quadrant properties | ||||||
|---|---|---|---|---|---|---|---|
| Quadrant | DetID | PixID | Counts | Sigma | Mean | Median | Sigma |
| A | 15 | 174 | 52346 | 303.43 | 835 | 820 | 169.8 |
| A | 4 | 2 | 24765 | 141.01 | 835 | 820 | 169.8 |
| A | 14 | 111 | 9746 | 52.56 | 835 | 820 | 169.8 |
| B | 0 | 197 | 55114 | 342.23 | 829 | 809 | 158.7 |
| B | 3 | 64 | 19966 | 120.73 | 829 | 809 | 158.7 |
| B | 12 | 111 | 18461 | 111.24 | 829 | 809 | 158.7 |
| C | 14 | 238 | 125026 | 681.28 | 785 | 792 | 182.4 |
| C | 3 | 233 | 22108 | 116.89 | 785 | 792 | 182.4 |
| C | 9 | 160 | 9556 | 48.06 | 785 | 792 | 182.4 |
| D | 11 | 176 | 459654 | 2353.36 | 801 | 780 | 195.0 |
| D | 5 | 222 | 310966 | 1590.81 | 801 | 780 | 195.0 |
| D | 15 | 145 | 48356 | 244.0 | 801 | 780 | 195.0 |
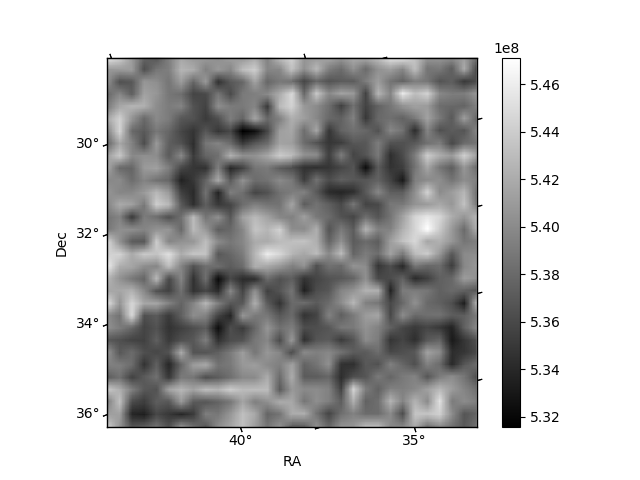
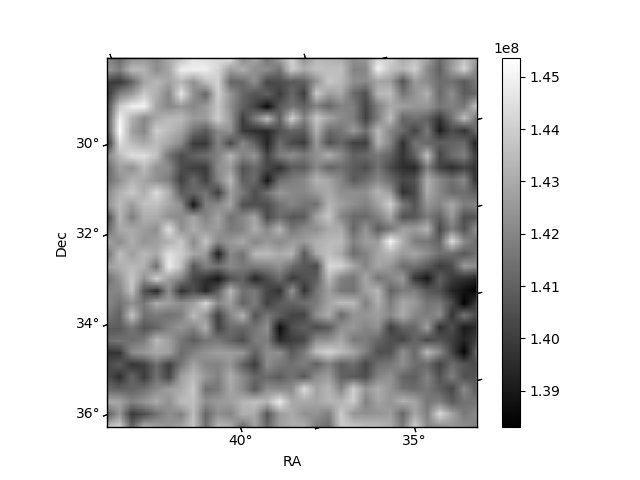
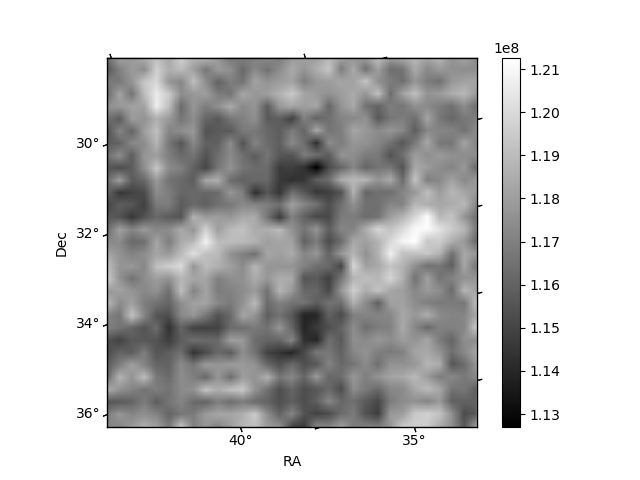
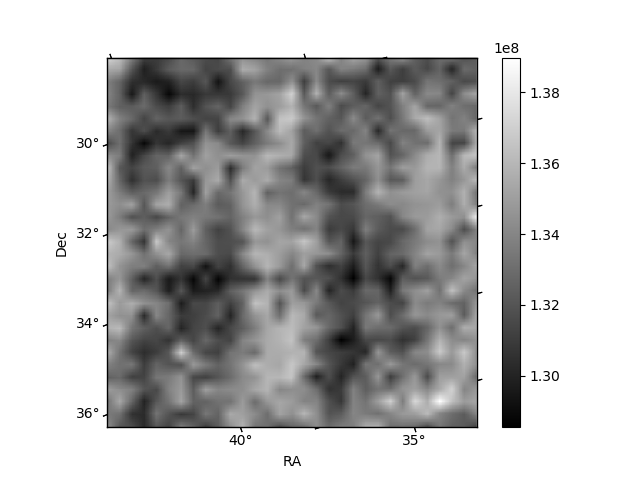
Histogram calculated using DETX and DETY for each event in the final _common_clean file
| Quadrant A | 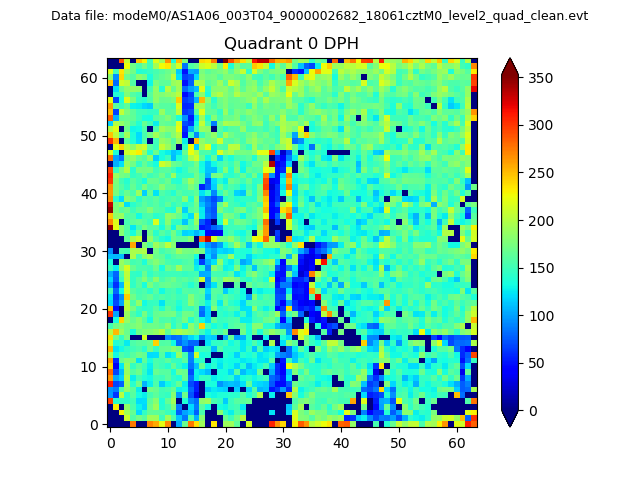 |
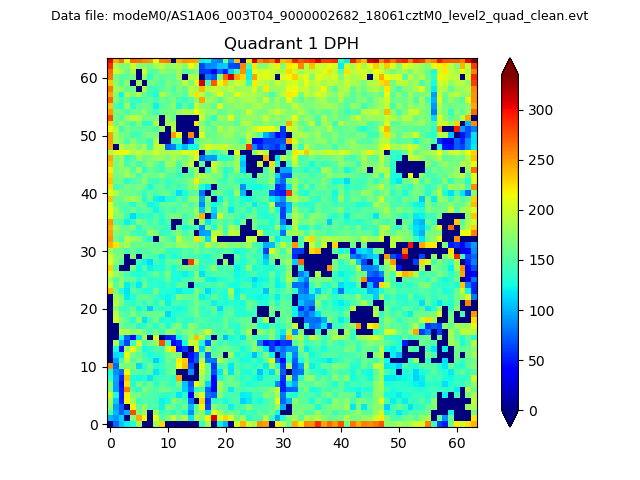 |
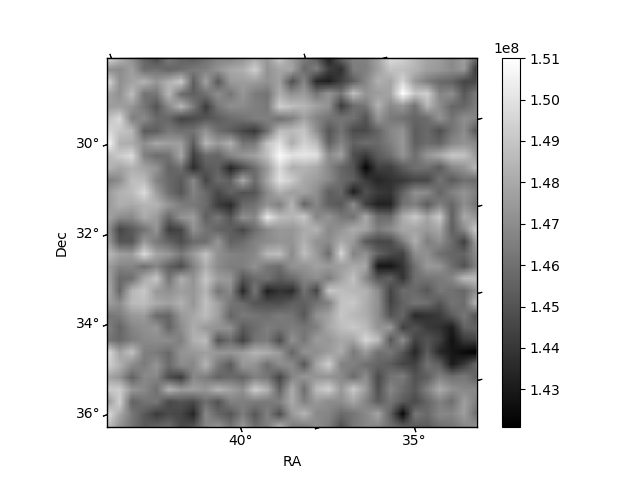
Quadrant B |
|---|---|---|---|
| Quadrant D | 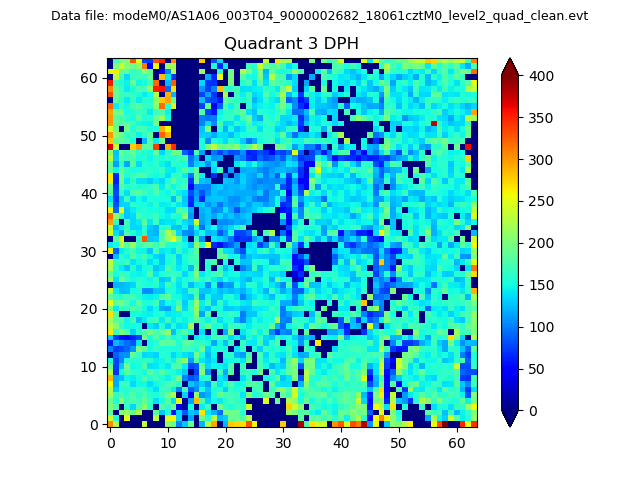 |
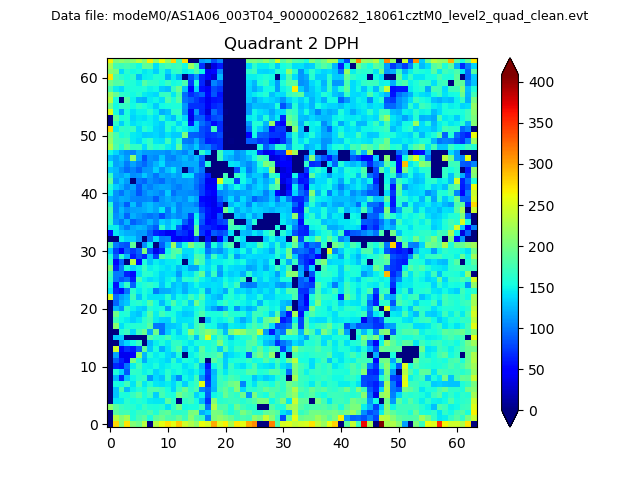 |
Quadrant C |
| Plot type | Count rate plots | Images |
|---|---|---|
| Comparison with Poisson distribution Blue bars denote a histogram of data divided into 1 sec bins. Red curve is a Poisson curve with rate = median count rate of data. |
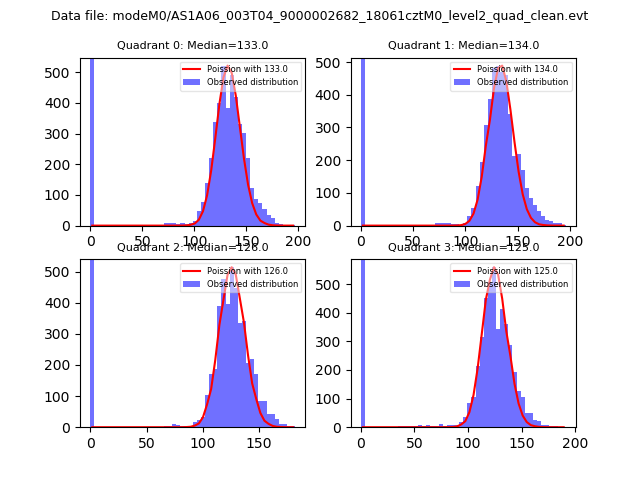 |
 |
| Quadrant-wise count rates Data is divided into 100 sec bins |
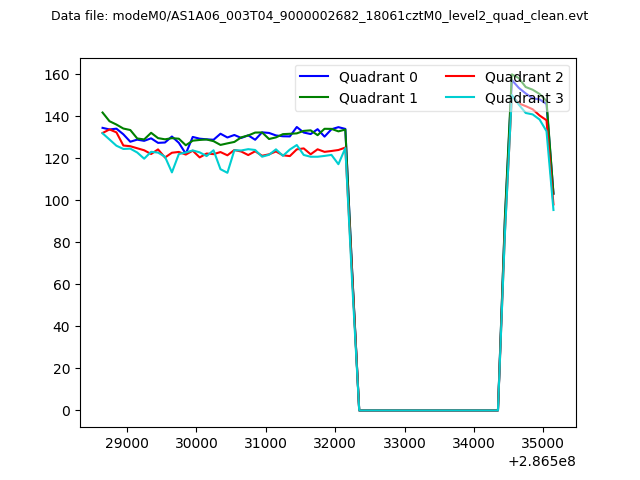 |
|
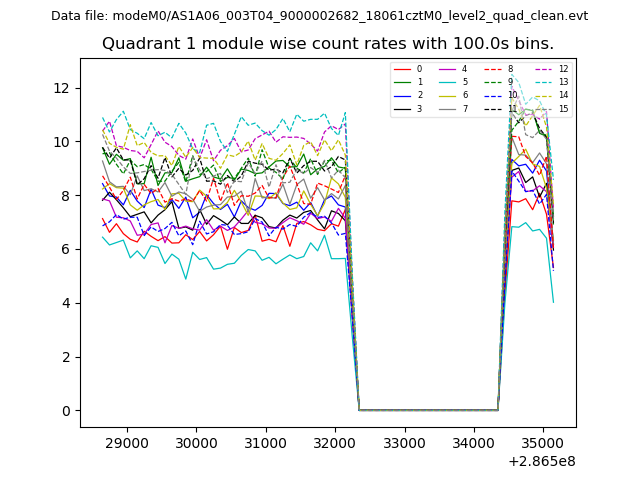
| Module-wise count rates for Quadrant A Data is divided into 100 sec bins |
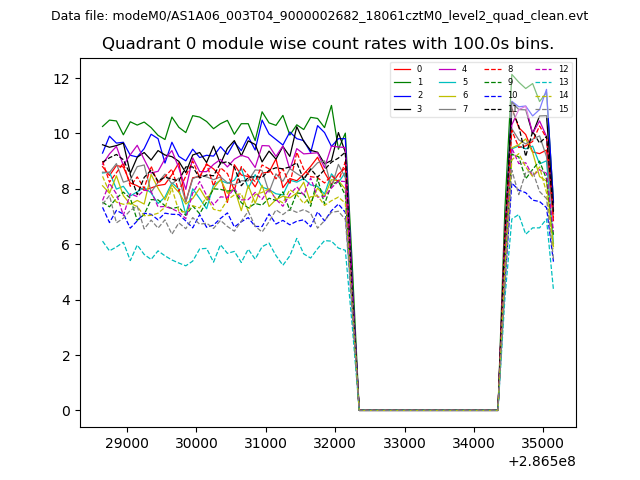 |
 |
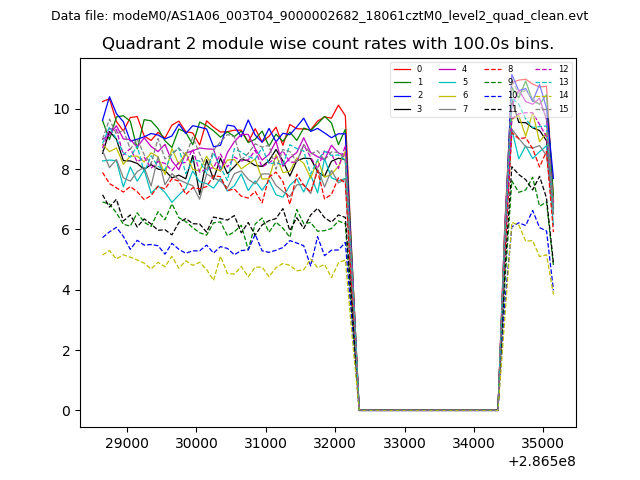
| Module-wise count rates for Quadrant B Data is divided into 100 sec bins |
 |
 |
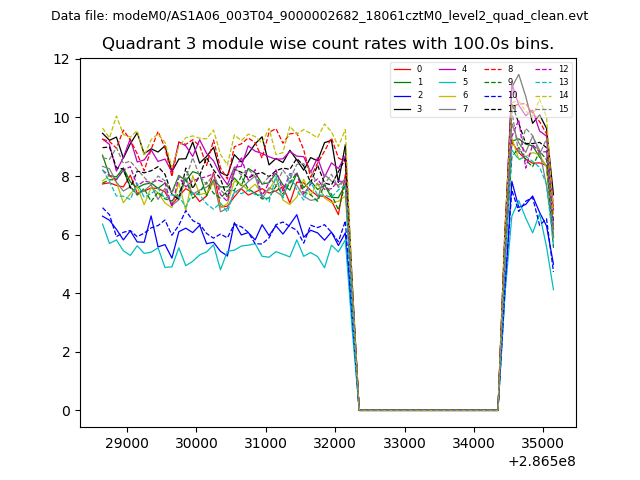
| Module-wise count rates for Quadrant C Data is divided into 100 sec bins |
 |
 |
| Module-wise count rates for Quadrant D Data is divided into 100 sec bins |
 |
 |
| Parameter | Plot |
|---|---|
| CZT HV Monitor | 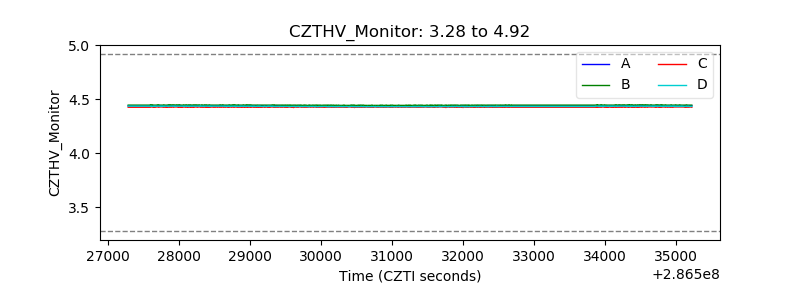 |
| D_VDD | 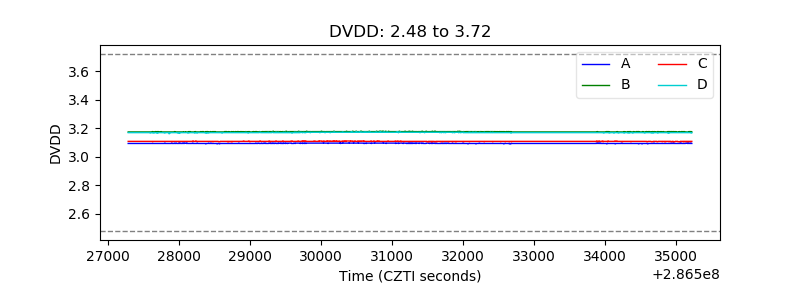 |
| Temperature 1 | 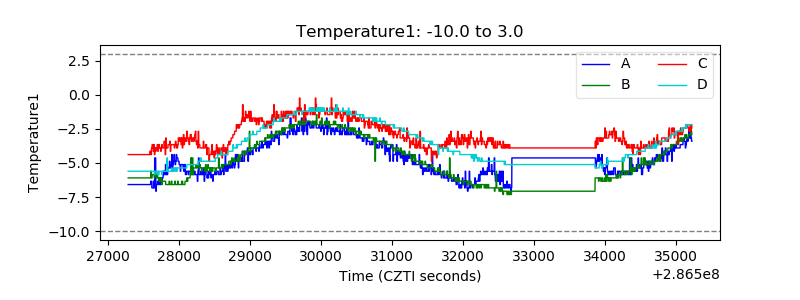 |
| Veto HV Monitor | 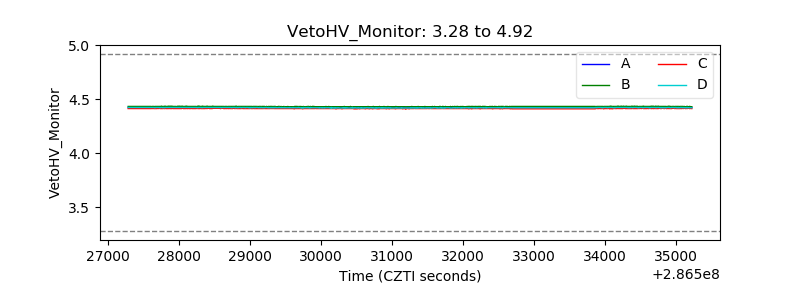 |
| Veto LLD | 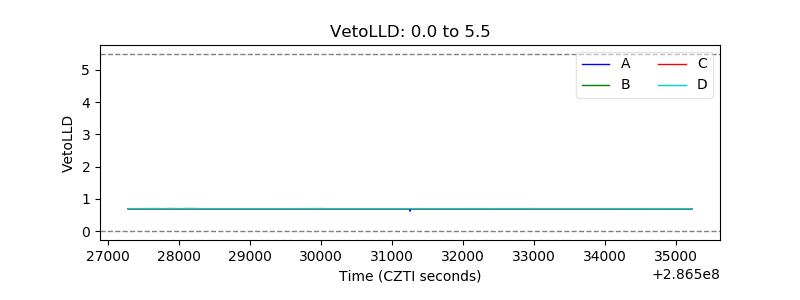 |
| Alpha Counter | 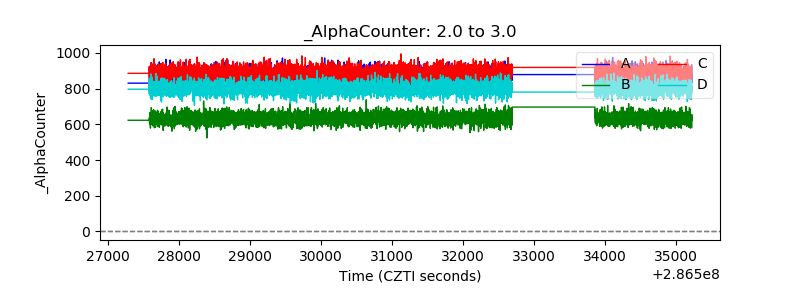 |
| _CPM_Rate | 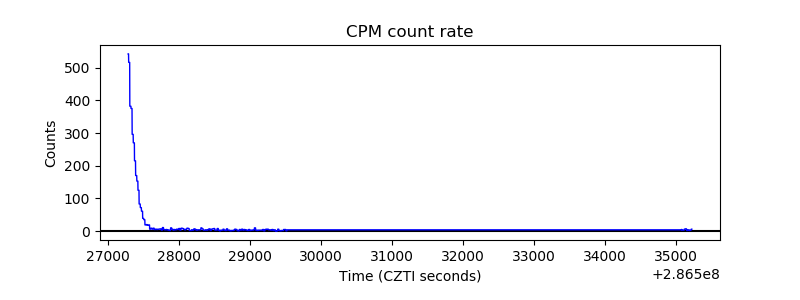 |
| CZT Counter | 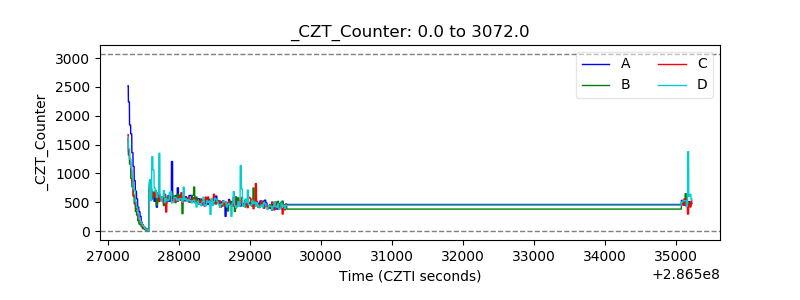 |
| +2.5 Volts monitor |  |
| +5 Volts monitor |  |
| _ROLL_ROT | 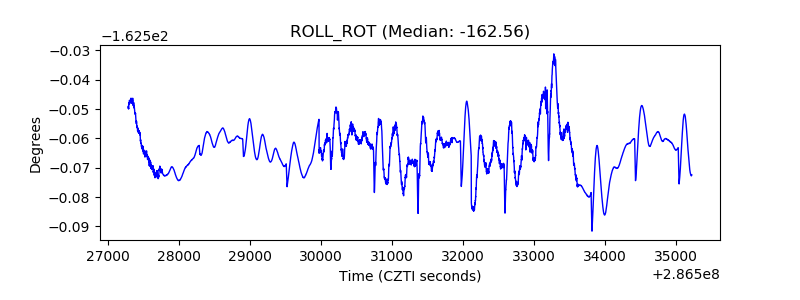 |
| _Roll_DEC | 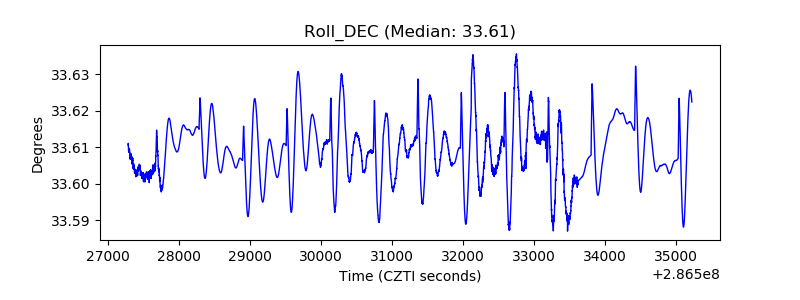 |
| _Roll_RA | 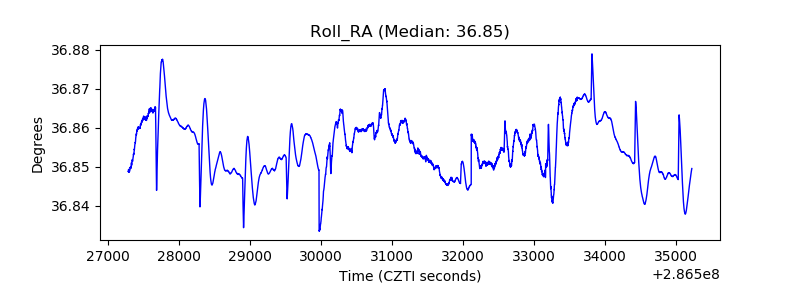 |
| Veto Counter | 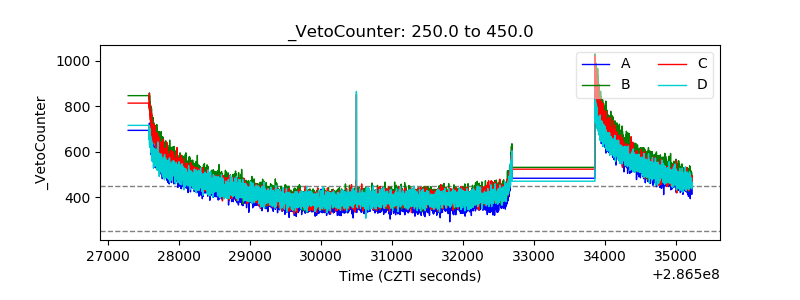 |