| Param | Original file | Final file |
|---|---|---|
| Filename | modeM0/AS1A06_003T04_9000002682_18062cztM0_level2.evt | modeM0/AS1A06_003T04_9000002682_18062cztM0_level2_quad_clean.evt |
| Size (bytes) | 473,757,120 | 103,821,120 |
| Size | 451.8 MB | 99.0 MB |
| Events in quadrant A | 3,566,175 | 694,835 |
| Events in quadrant B | 3,388,993 | 702,289 |
| Events in quadrant C | 3,262,439 | 651,039 |
| Events in quadrant D | 3,697,821 | 651,862 |
| Mode SS | |||
|---|---|---|---|
| Quadrant | BADHDUFLAG | Total packets | Discarded packets |
| A | 0 | 130 | 0 |
| B | 0 | 130 | 0 |
| C | 0 | 130 | 0 |
| D | 0 | 130 | 0 |
| Mode M0 | |||
|---|---|---|---|
| Quadrant | BADHDUFLAG | Total packets | Discarded packets |
| A | 0 | 14690 | 2 |
| B | 0 | 14105 | 2 |
| C | 0 | 13701 | 2 |
| D | 0 | 15044 | 2 |
| Mode M9 | |||
|---|---|---|---|
| Quadrant | BADHDUFLAG | Total packets | Discarded packets |
| A | 0 | 17 | 0 |
| B | 0 | 18 | 0 |
| C | 0 | 18 | 0 |
| D | 0 | 18 | 0 |
| Quadrant | Total seconds | Saturated seconds | Saturation percentage |
|---|---|---|---|
| A | 6366 | 131 | 2.057807% |
| B | 6366 | 100 | 1.570845% |
| C | 6365 | 101 | 1.586803% |
| D | 6365 | 117 | 1.838178% |
Noise dominated data is calculated using 1-second bins in cleaned event files. If a bin has >2000 counts, and if more than 50% of those come from <1% of pixels, then it is considered to be noise-dominated and hence unusable.
| Quadrant | # 1 sec bins | Bins with >0 counts | Bins with >2000 counts | High rate bins dominated by noise | Noise dominated (total time) | Noise dominated (detector-on time) | Marked lightcurve |
|---|---|---|---|---|---|---|---|
| A | 7581 | 6366 | 15 | 15 | 0.20% | 0.24% | 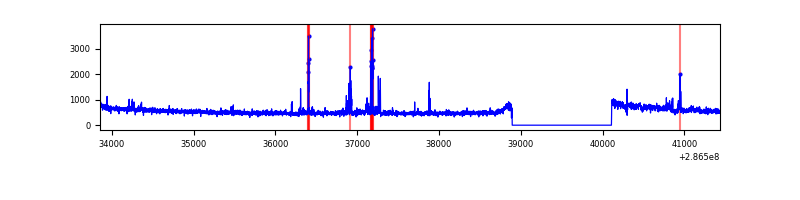 |
| B | 7581 | 6366 | 3 | 3 | 0.04% | 0.05% | 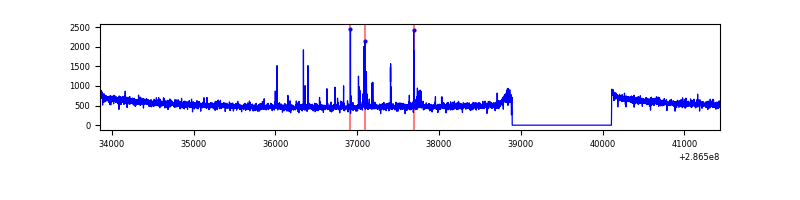 |
| C | 7580 | 6366 | 1 | 1 | 0.01% | 0.02% | 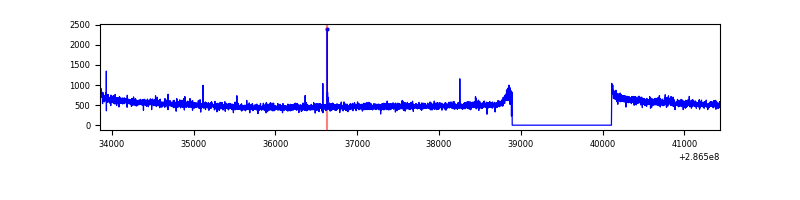 |
| D | 7580 | 6365 | 44 | 44 | 0.58% | 0.69% | 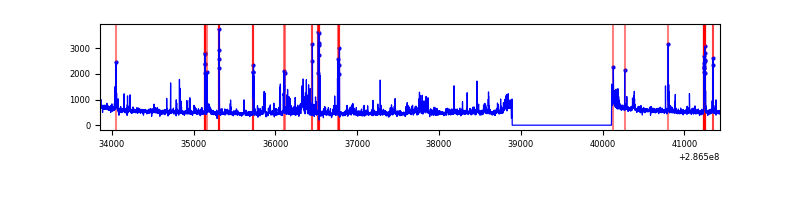 |
Top three noisy pixels from each quadrant. If the there are fewer than three noisy pixels in the level2.evt file, extra rows are filled as -1
| Pixel properties | Quadrant properties | ||||||
|---|---|---|---|---|---|---|---|
| Quadrant | DetID | PixID | Counts | Sigma | Mean | Median | Sigma |
| A | 15 | 174 | 145340 | 843.21 | 856 | 841 | 171.4 |
| A | 14 | 111 | 122761 | 711.45 | 856 | 841 | 171.4 |
| A | 4 | 2 | 8284 | 43.43 | 856 | 841 | 171.4 |
| B | 0 | 197 | 27367 | 165.88 | 846 | 826 | 160.0 |
| B | 12 | 111 | 18220 | 108.71 | 846 | 826 | 160.0 |
| B | 0 | 230 | 16094 | 95.42 | 846 | 826 | 160.0 |
| C | 14 | 238 | 127514 | 687.87 | 797 | 801 | 184.2 |
| C | 3 | 233 | 15306 | 78.74 | 797 | 801 | 184.2 |
| C | 13 | 61 | 5600 | 26.05 | 797 | 801 | 184.2 |
| D | 11 | 176 | 303676 | 1521.13 | 822 | 799 | 199.1 |
| D | 5 | 222 | 101938 | 507.95 | 822 | 799 | 199.1 |
| D | 7 | 238 | 60892 | 301.8 | 822 | 799 | 199.1 |
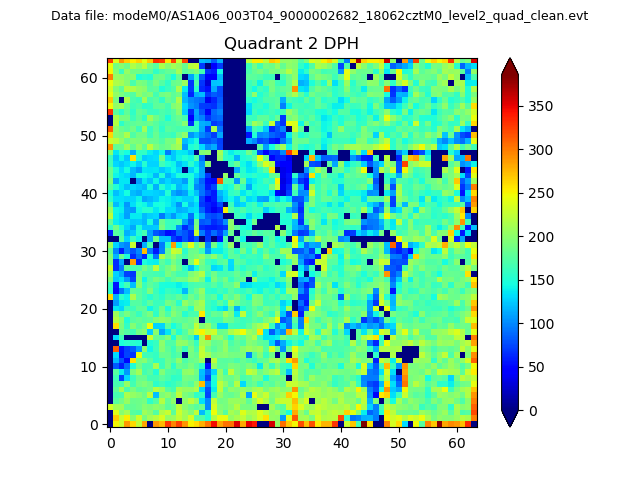
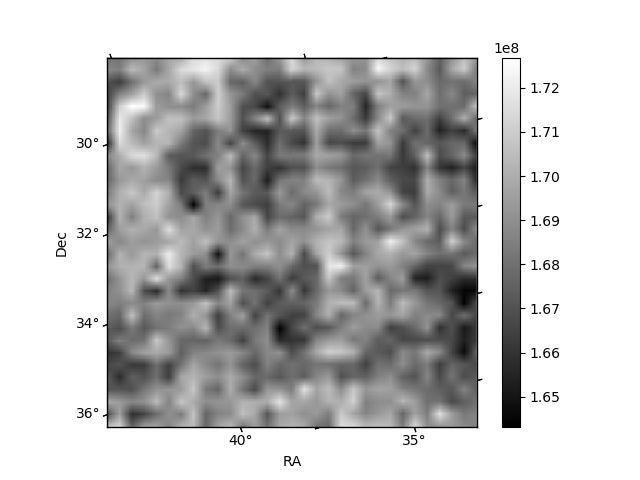
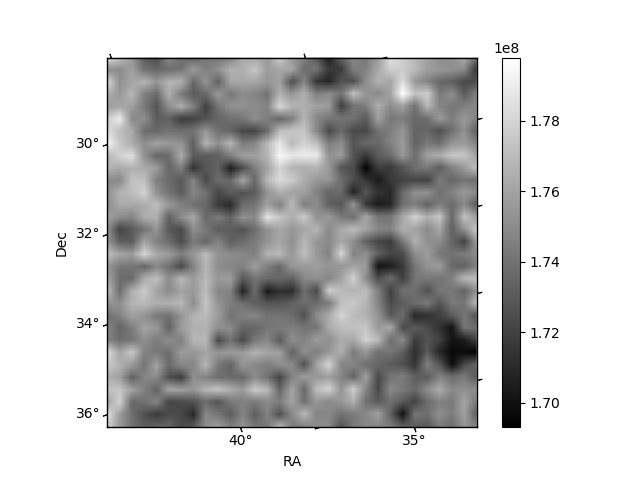
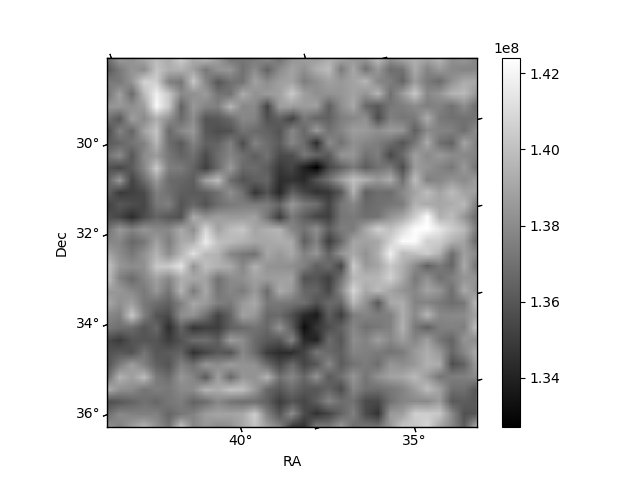
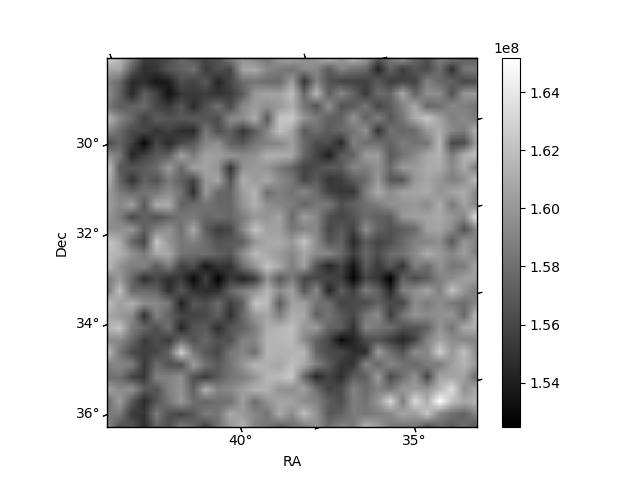
Histogram calculated using DETX and DETY for each event in the final _common_clean file
| Quadrant A | 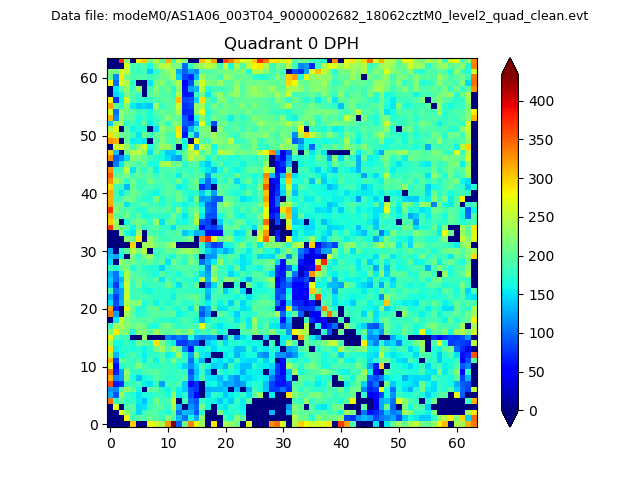 |
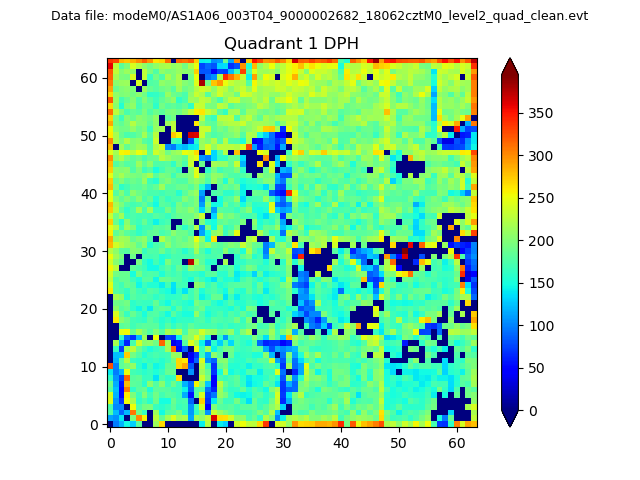 |
Quadrant B |
|---|---|---|---|
| Quadrant D | 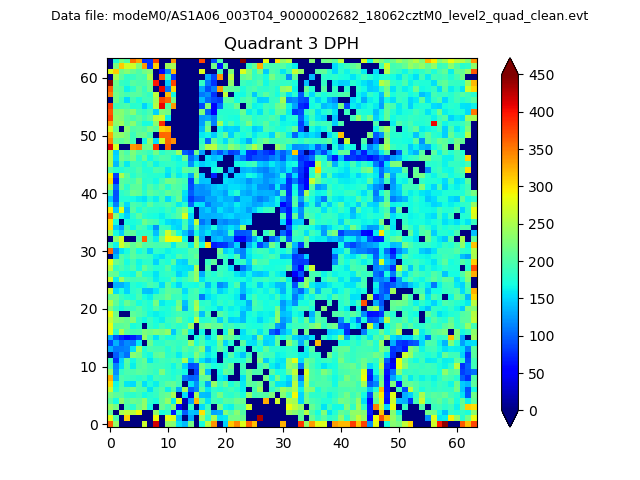 |
 |
Quadrant C |
| Plot type | Count rate plots | Images |
|---|---|---|
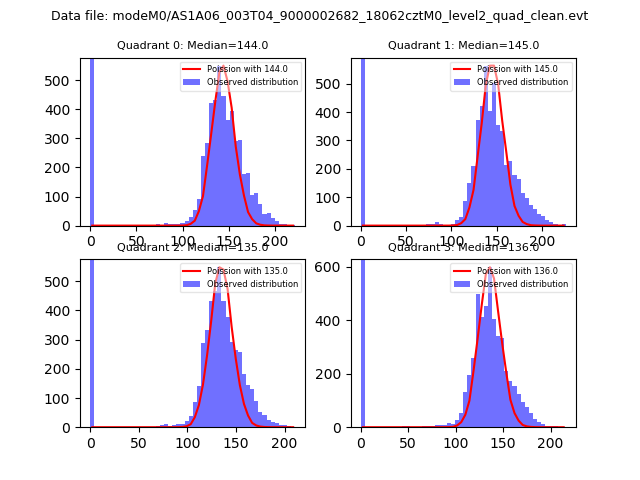
| Comparison with Poisson distribution Blue bars denote a histogram of data divided into 1 sec bins. Red curve is a Poisson curve with rate = median count rate of data. |
 |
 |
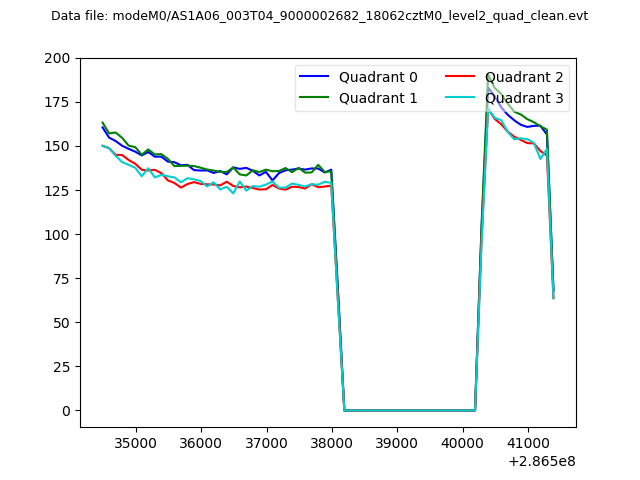
| Quadrant-wise count rates Data is divided into 100 sec bins |
 |
|
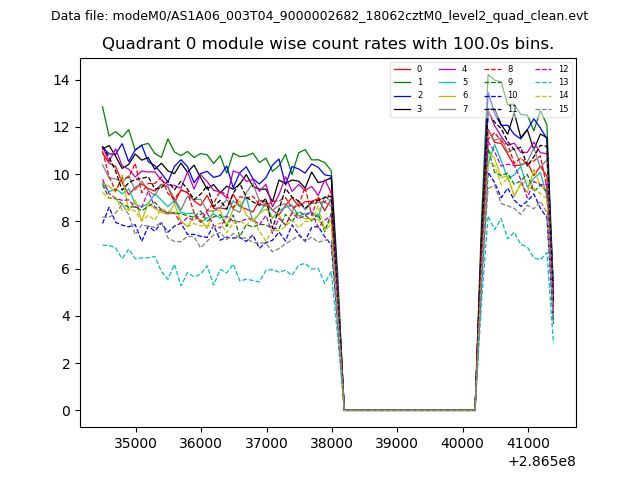
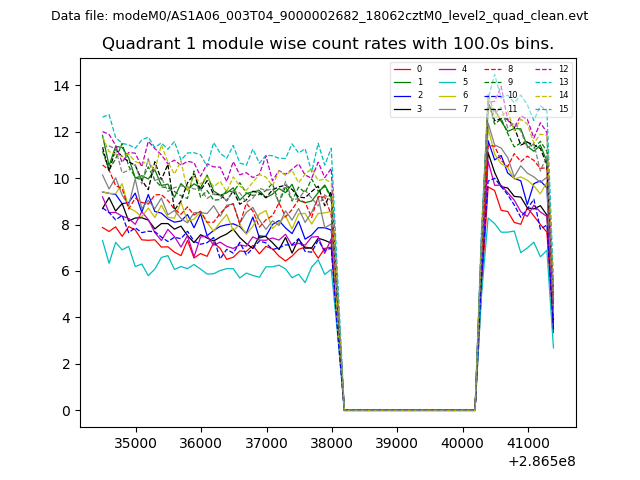
| Module-wise count rates for Quadrant A Data is divided into 100 sec bins |
 |
 |
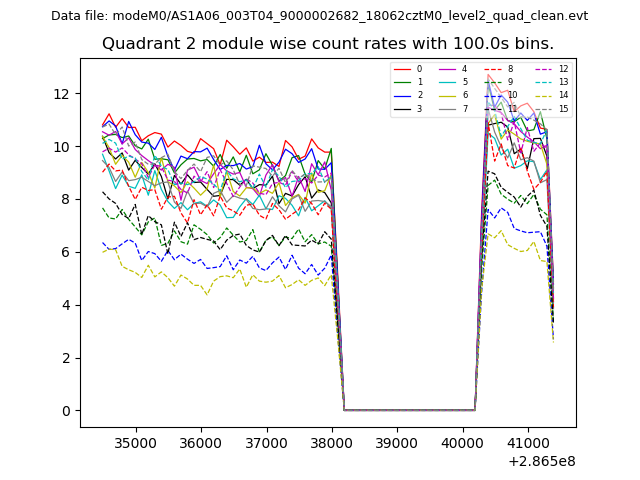
| Module-wise count rates for Quadrant B Data is divided into 100 sec bins |
 |
 |
| Module-wise count rates for Quadrant C Data is divided into 100 sec bins |
 |
 |
| Module-wise count rates for Quadrant D Data is divided into 100 sec bins |
 |
 |
| Parameter | Plot |
|---|---|
| CZT HV Monitor | 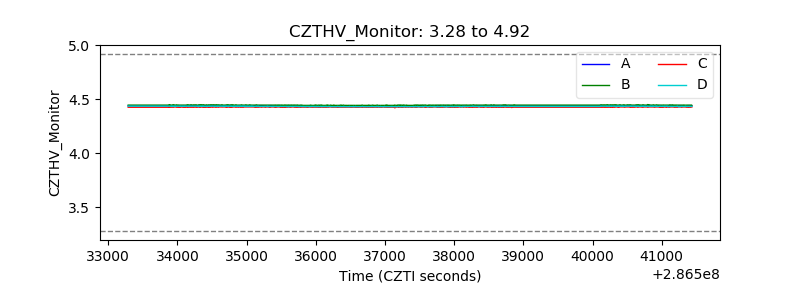 |
| D_VDD | 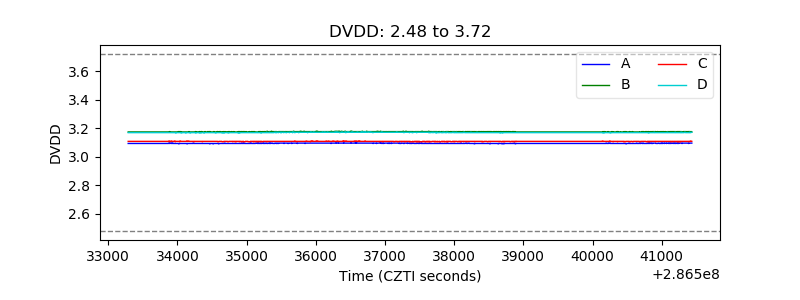 |
| Temperature 1 | 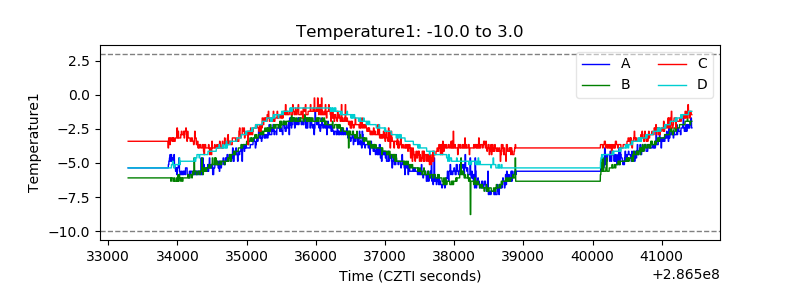 |
| Veto HV Monitor | 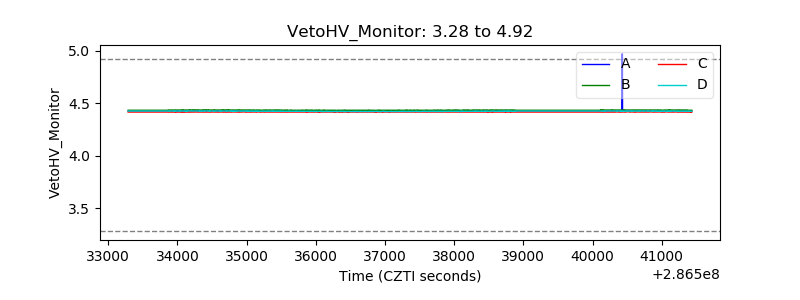 |
| Veto LLD | 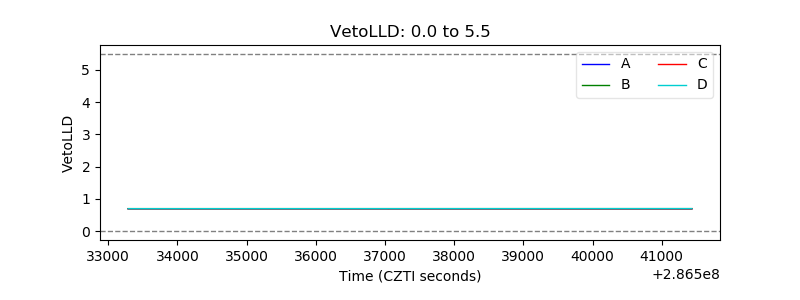 |
| Alpha Counter | 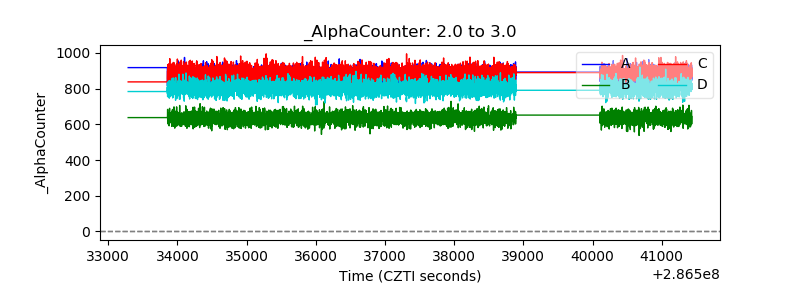 |
| _CPM_Rate | 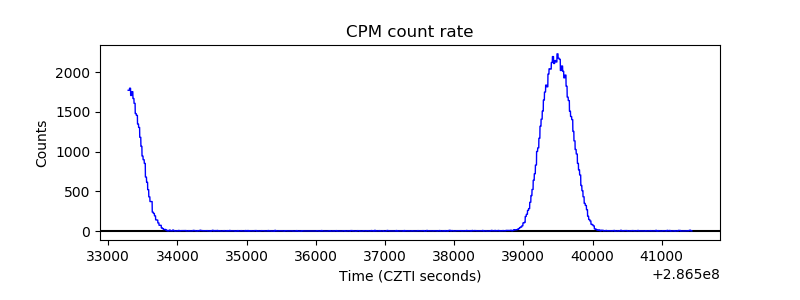 |
| CZT Counter | 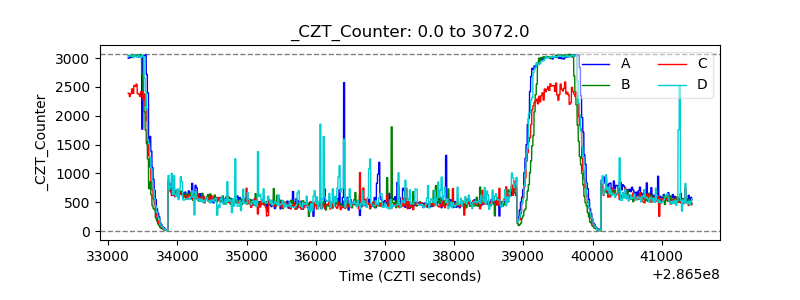 |
| +2.5 Volts monitor |  |
| +5 Volts monitor |  |
| _ROLL_ROT | 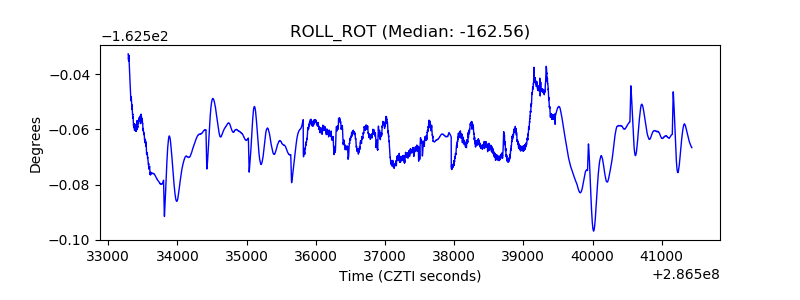 |
| _Roll_DEC | 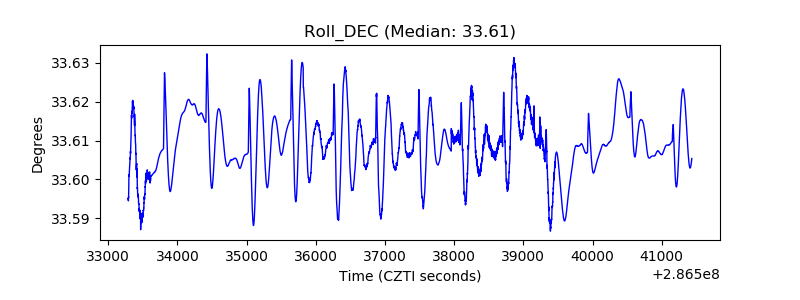 |
| _Roll_RA | 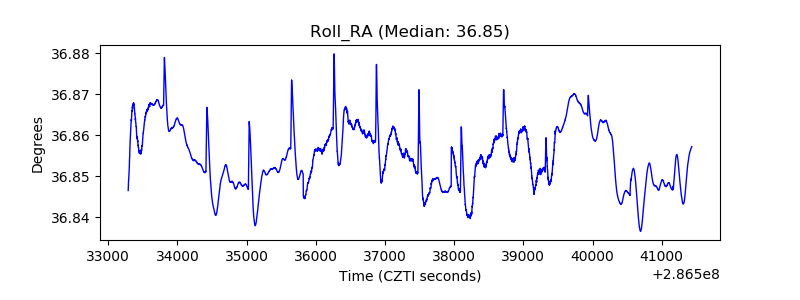 |
| Veto Counter | 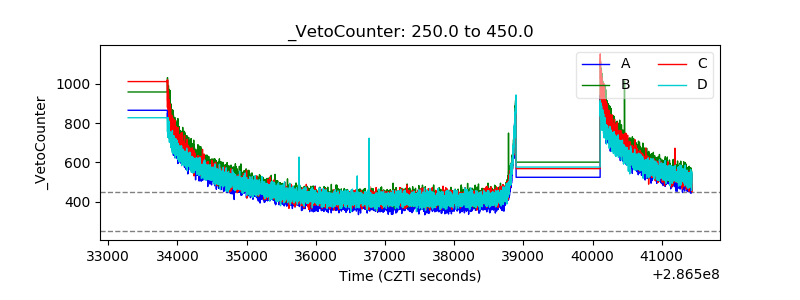 |