| Param | Original file | Final file |
|---|---|---|
| Filename | modeM0/AS1A06_003T04_9000002682_18063cztM0_level2.evt | modeM0/AS1A06_003T04_9000002682_18063cztM0_level2_quad_clean.evt |
| Size (bytes) | 494,625,600 | 111,885,120 |
| Size | 471.7 MB | 106.7 MB |
| Events in quadrant A | 4,025,254 | 735,904 |
| Events in quadrant B | 3,347,481 | 780,194 |
| Events in quadrant C | 3,306,471 | 715,824 |
| Events in quadrant D | 3,877,015 | 721,146 |
| Mode SS | |||
|---|---|---|---|
| Quadrant | BADHDUFLAG | Total packets | Discarded packets |
| A | 0 | 126 | 0 |
| B | 0 | 126 | 0 |
| C | 0 | 126 | 0 |
| D | 0 | 126 | 0 |
| Mode M0 | |||
|---|---|---|---|
| Quadrant | BADHDUFLAG | Total packets | Discarded packets |
| A | 0 | 15986 | 2 |
| B | 0 | 13816 | 2 |
| C | 0 | 13658 | 2 |
| D | 0 | 15499 | 2 |
| Mode M9 | |||
|---|---|---|---|
| Quadrant | BADHDUFLAG | Total packets | Discarded packets |
| A | 0 | 17 | 0 |
| B | 0 | 18 | 0 |
| C | 0 | 18 | 0 |
| D | 0 | 18 | 0 |
| Quadrant | Total seconds | Saturated seconds | Saturation percentage |
|---|---|---|---|
| A | 6238 | 937 | 15.020840% |
| B | 6238 | 87 | 1.394678% |
| C | 6238 | 115 | 1.843540% |
| D | 6238 | 97 | 1.554986% |
Noise dominated data is calculated using 1-second bins in cleaned event files. If a bin has >2000 counts, and if more than 50% of those come from <1% of pixels, then it is considered to be noise-dominated and hence unusable.
| Quadrant | # 1 sec bins | Bins with >0 counts | Bins with >2000 counts | High rate bins dominated by noise | Noise dominated (total time) | Noise dominated (detector-on time) | Marked lightcurve |
|---|---|---|---|---|---|---|---|
| A | 7543 | 6239 | 41 | 41 | 0.54% | 0.66% |  |
| B | 7543 | 6239 | 5 | 5 | 0.07% | 0.08% | 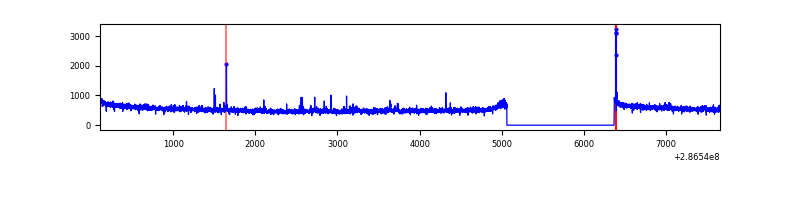 |
| C | 7543 | 6239 | 1 | 1 | 0.01% | 0.02% | 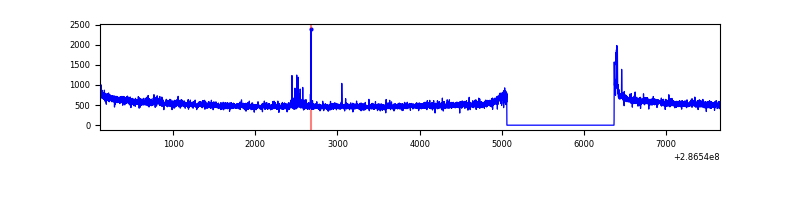 |
| D | 7543 | 6239 | 40 | 40 | 0.53% | 0.64% | 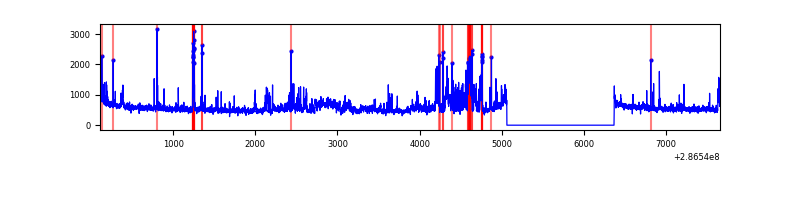 |
Top three noisy pixels from each quadrant. If the there are fewer than three noisy pixels in the level2.evt file, extra rows are filled as -1
| Pixel properties | Quadrant properties | ||||||
|---|---|---|---|---|---|---|---|
| Quadrant | DetID | PixID | Counts | Sigma | Mean | Median | Sigma |
| A | 14 | 111 | 662325 | 4091.43 | 819 | 806 | 161.7 |
| A | 15 | 174 | 192542 | 1185.87 | 819 | 806 | 161.7 |
| A | 4 | 2 | 22717 | 135.52 | 819 | 806 | 161.7 |
| B | 3 | 64 | 18482 | 111.45 | 840 | 821 | 158.5 |
| B | 12 | 111 | 17578 | 105.75 | 840 | 821 | 158.5 |
| B | 11 | 111 | 15714 | 93.98 | 840 | 821 | 158.5 |
| C | 14 | 238 | 126443 | 693.98 | 788 | 794 | 181.1 |
| C | 3 | 233 | 63602 | 346.9 | 788 | 794 | 181.1 |
| C | 9 | 54 | 24453 | 130.67 | 788 | 794 | 181.1 |
| D | 11 | 176 | 561824 | 2820.57 | 819 | 795 | 198.9 |
| D | 7 | 238 | 126609 | 632.53 | 819 | 795 | 198.9 |
| D | 9 | 64 | 24683 | 120.09 | 819 | 795 | 198.9 |
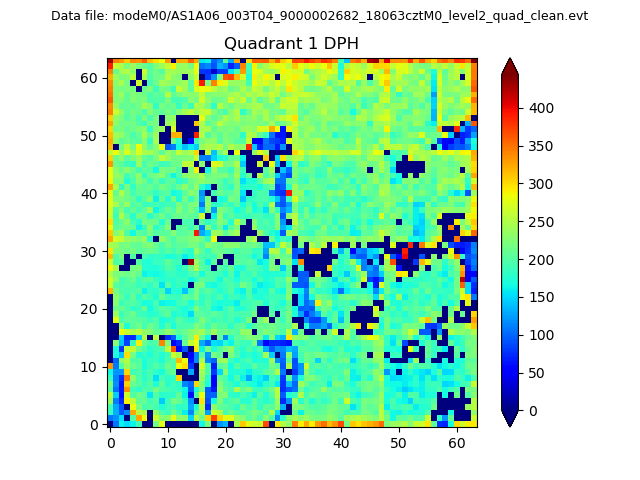
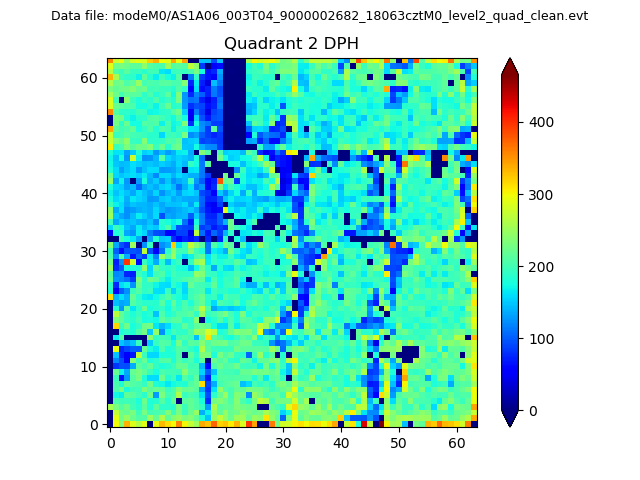
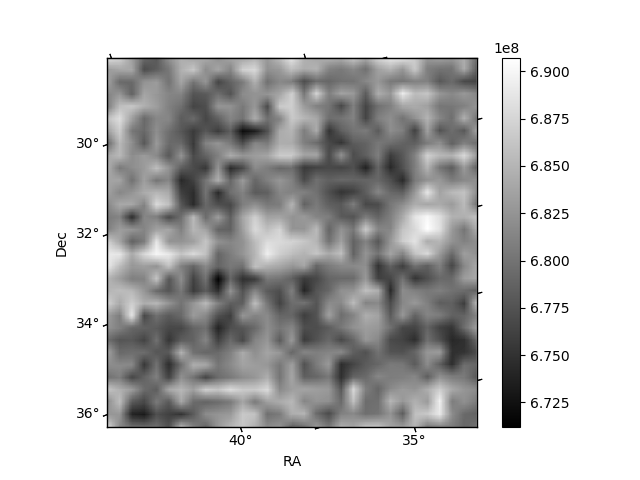
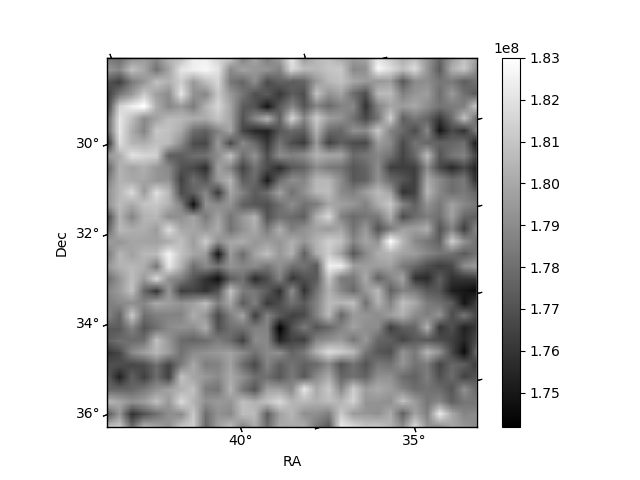
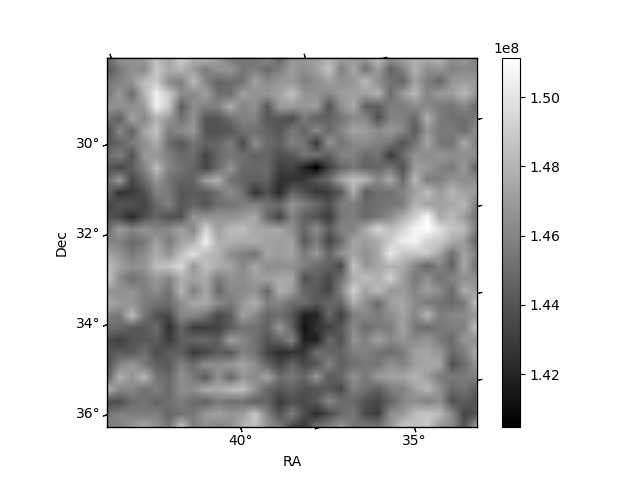
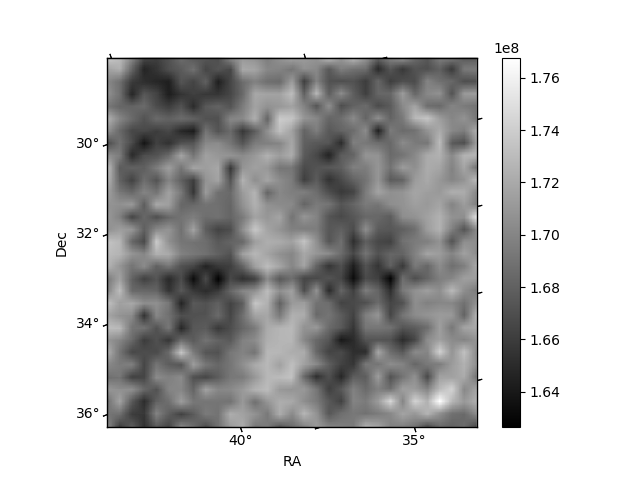
Histogram calculated using DETX and DETY for each event in the final _common_clean file
| Quadrant A | 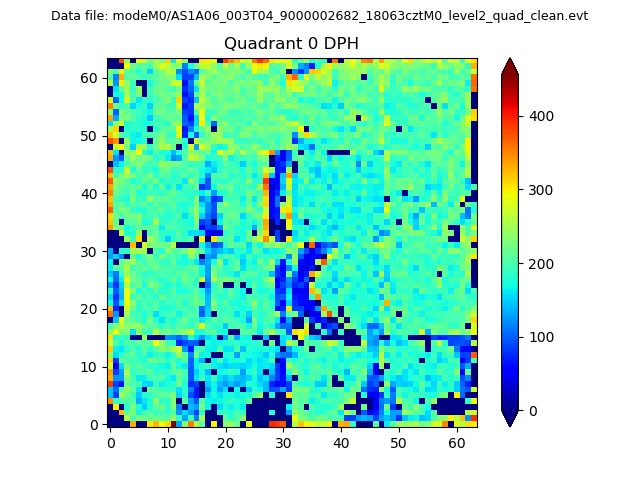 |
 |
Quadrant B |
|---|---|---|---|
| Quadrant D | 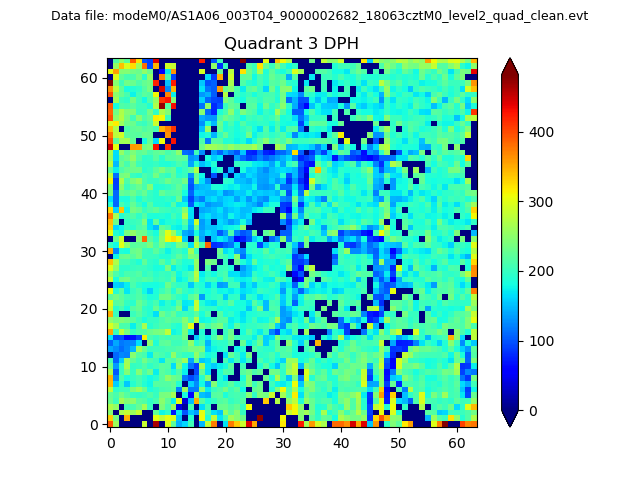 |
 |
Quadrant C |
| Plot type | Count rate plots | Images |
|---|---|---|
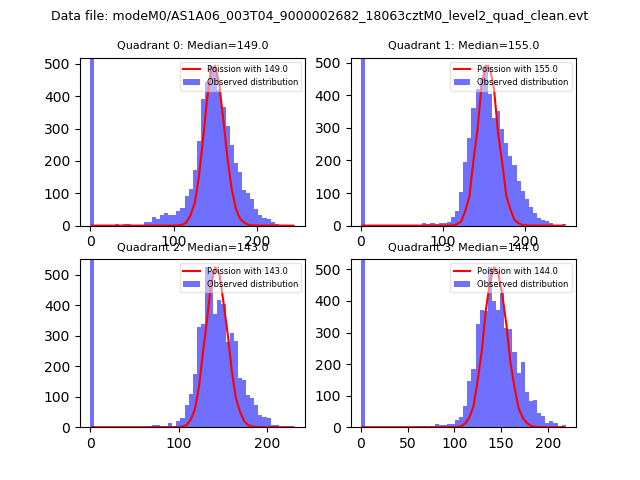
| Comparison with Poisson distribution Blue bars denote a histogram of data divided into 1 sec bins. Red curve is a Poisson curve with rate = median count rate of data. |
 |
 |
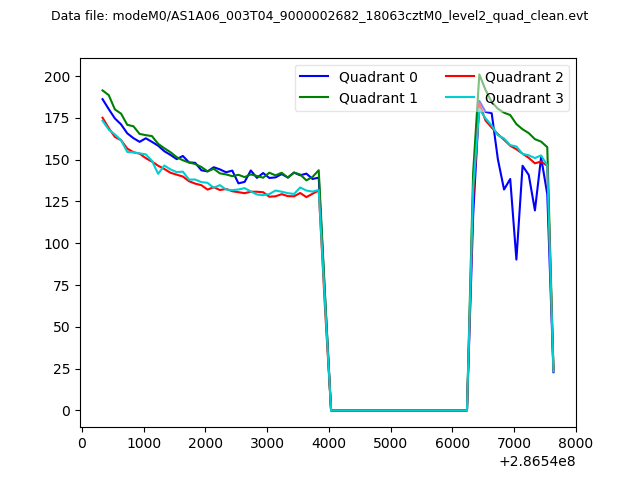
| Quadrant-wise count rates Data is divided into 100 sec bins |
 |
|
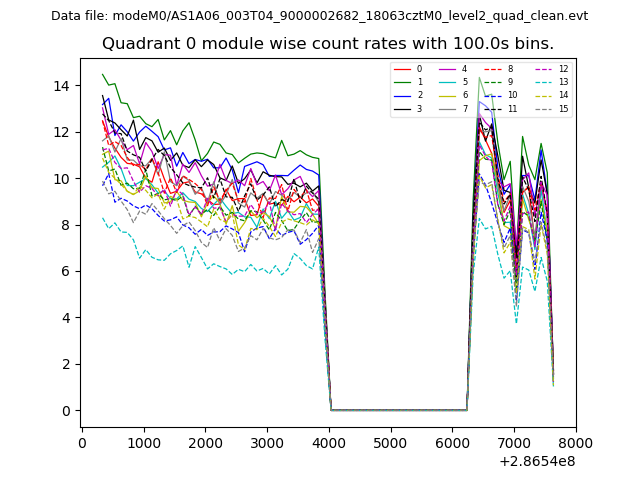
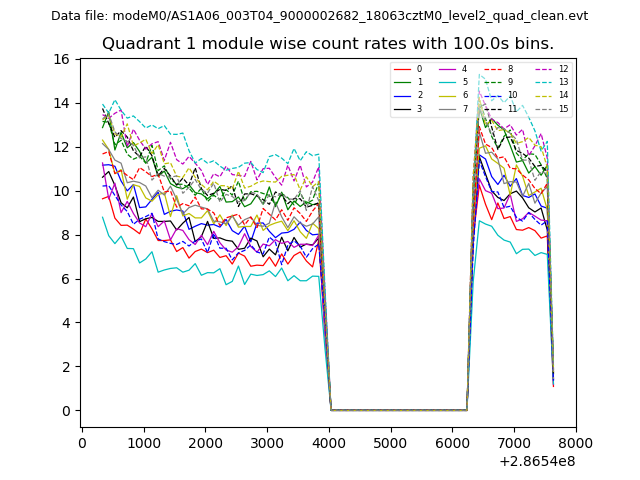
| Module-wise count rates for Quadrant A Data is divided into 100 sec bins |
 |
 |
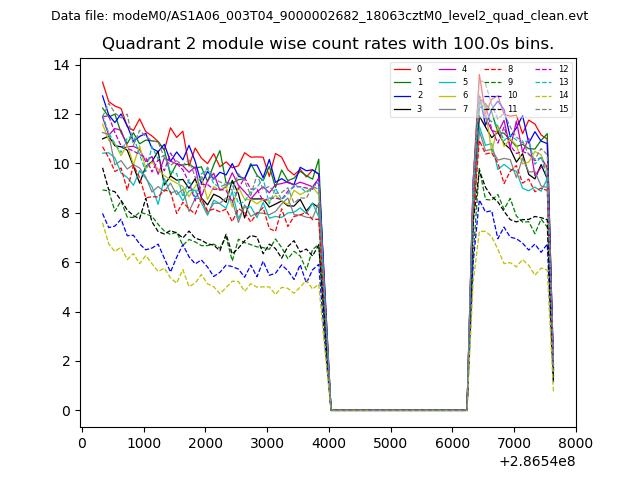
| Module-wise count rates for Quadrant B Data is divided into 100 sec bins |
 |
 |
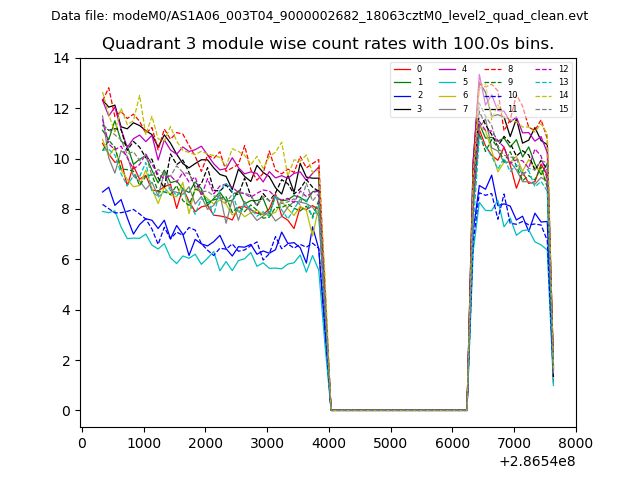
| Module-wise count rates for Quadrant C Data is divided into 100 sec bins |
 |
 |
| Module-wise count rates for Quadrant D Data is divided into 100 sec bins |
 |
 |
| Parameter | Plot |
|---|---|
| CZT HV Monitor | 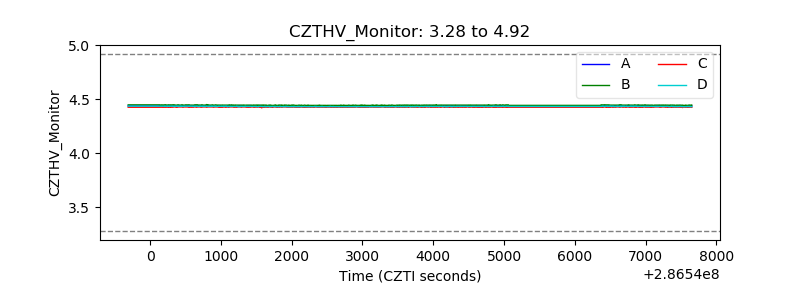 |
| D_VDD |  |
| Temperature 1 | 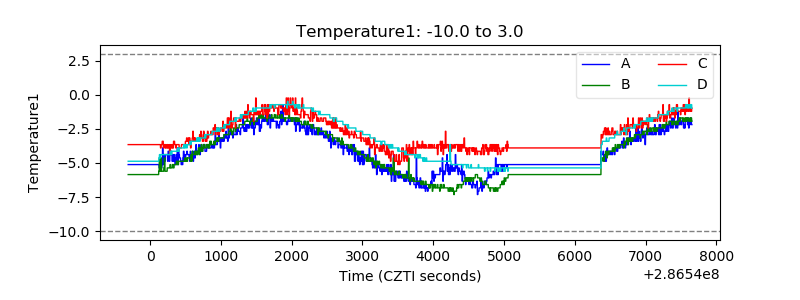 |
| Veto HV Monitor | 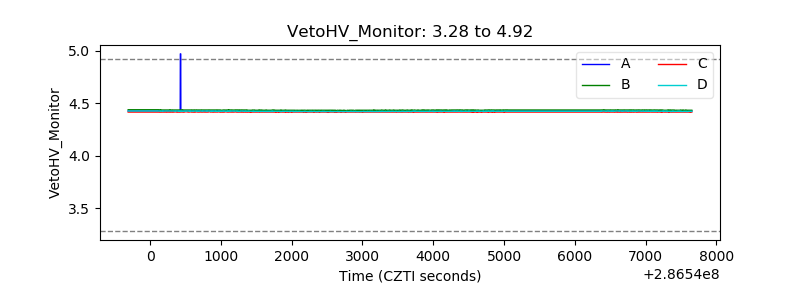 |
| Veto LLD | 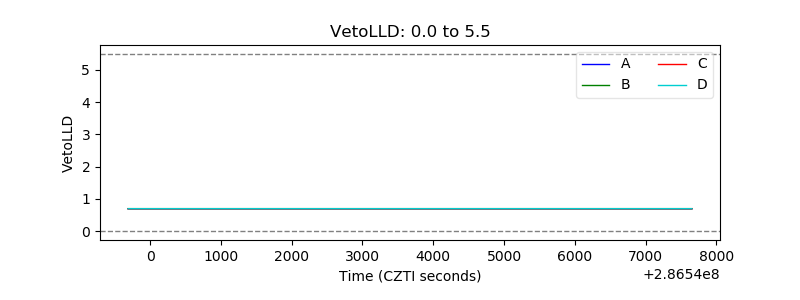 |
| Alpha Counter | 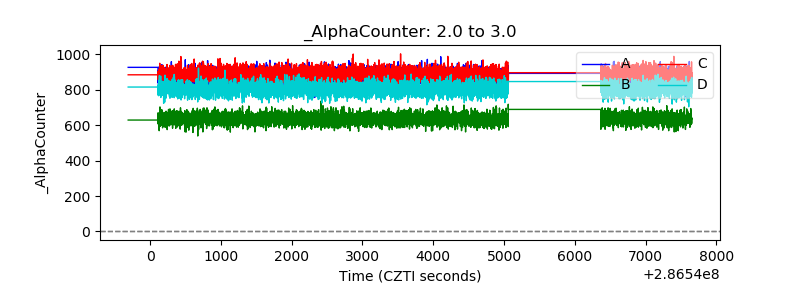 |
| _CPM_Rate | 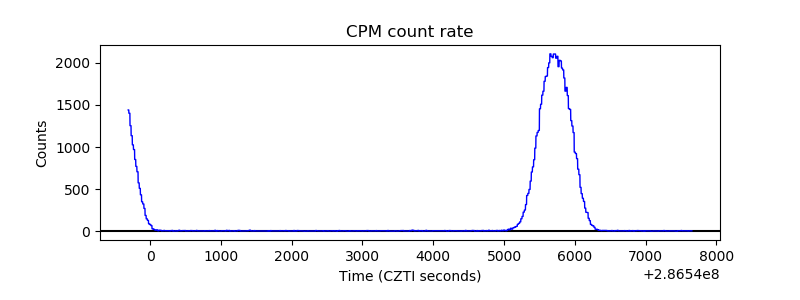 |
| CZT Counter | 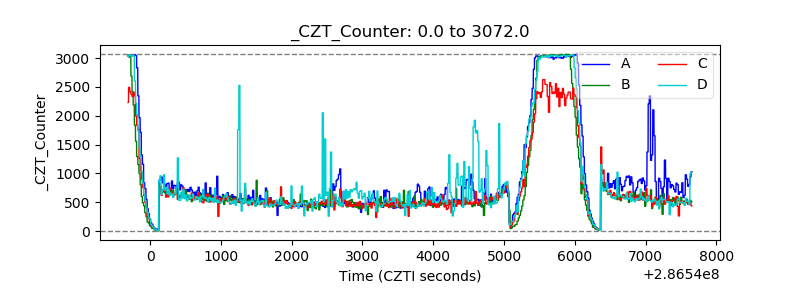 |
| +2.5 Volts monitor | 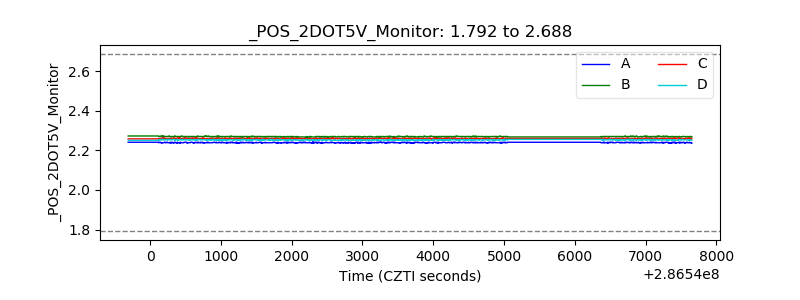 |
| +5 Volts monitor |  |
| _ROLL_ROT | 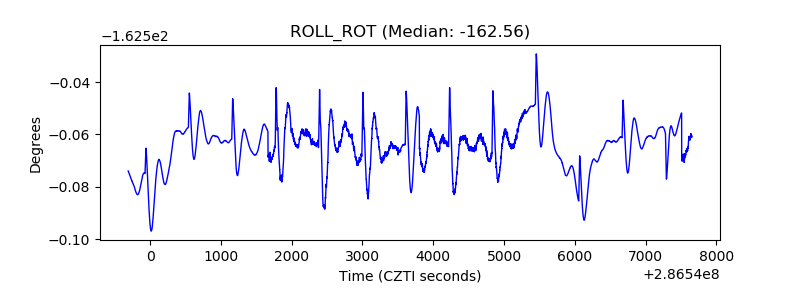 |
| _Roll_DEC | 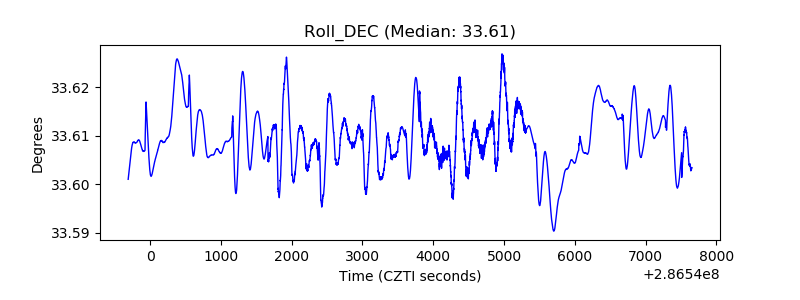 |
| _Roll_RA | 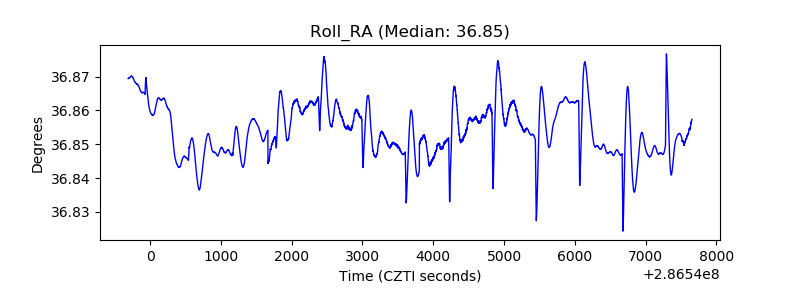 |
| Veto Counter | 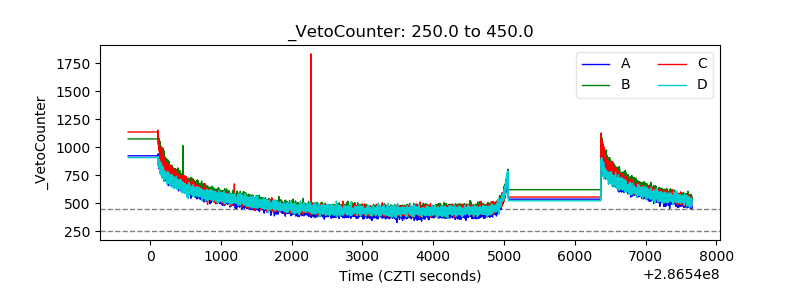 |