| Param | Original file | Final file |
|---|---|---|
| Filename | modeM0/AS1A06_003T04_9000002682_18064cztM0_level2.evt | modeM0/AS1A06_003T04_9000002682_18064cztM0_level2_quad_clean.evt |
| Size (bytes) | 525,700,800 | 111,021,120 |
| Size | 501.3 MB | 105.9 MB |
| Events in quadrant A | 5,047,721 | 689,936 |
| Events in quadrant B | 3,453,902 | 780,497 |
| Events in quadrant C | 3,375,285 | 719,119 |
| Events in quadrant D | 3,606,829 | 724,475 |
| Mode SS | |||
|---|---|---|---|
| Quadrant | BADHDUFLAG | Total packets | Discarded packets |
| A | 0 | 130 | 0 |
| B | 0 | 130 | 0 |
| C | 0 | 130 | 0 |
| D | 0 | 130 | 0 |
| Mode M0 | |||
|---|---|---|---|
| Quadrant | BADHDUFLAG | Total packets | Discarded packets |
| A | 0 | 19449 | 2 |
| B | 0 | 14182 | 2 |
| C | 0 | 13851 | 3 |
| D | 0 | 14804 | 2 |
| Mode M9 | |||
|---|---|---|---|
| Quadrant | BADHDUFLAG | Total packets | Discarded packets |
| A | 0 | 13 | 0 |
| B | 0 | 13 | 0 |
| C | 0 | 13 | 0 |
| D | 0 | 13 | 0 |
| Quadrant | Total seconds | Saturated seconds | Saturation percentage |
|---|---|---|---|
| A | 6417 | 2469 | 38.475923% |
| B | 6418 | 121 | 1.885323% |
| C | 6417 | 150 | 2.337541% |
| D | 6417 | 126 | 1.963534% |
Noise dominated data is calculated using 1-second bins in cleaned event files. If a bin has >2000 counts, and if more than 50% of those come from <1% of pixels, then it is considered to be noise-dominated and hence unusable.
| Quadrant | # 1 sec bins | Bins with >0 counts | Bins with >2000 counts | High rate bins dominated by noise | Noise dominated (total time) | Noise dominated (detector-on time) | Marked lightcurve |
|---|---|---|---|---|---|---|---|
| A | 7712 | 6417 | 40 | 40 | 0.52% | 0.62% | 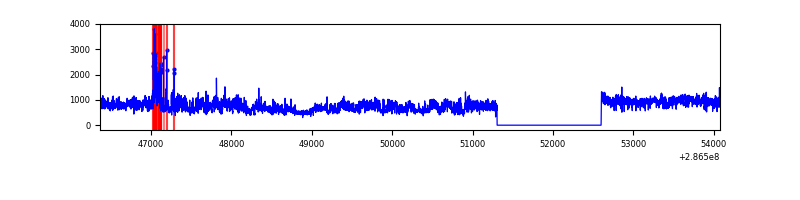 |
| B | 7713 | 6419 | 11 | 11 | 0.14% | 0.17% | 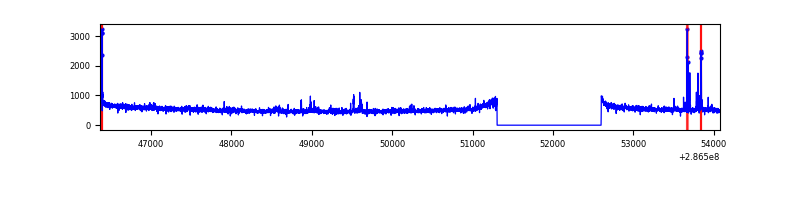 |
| C | 7712 | 6418 | 1 | 1 | 0.01% | 0.02% | 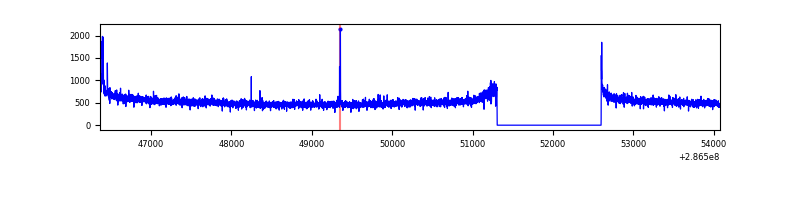 |
| D | 7712 | 6418 | 32 | 32 | 0.41% | 0.50% | 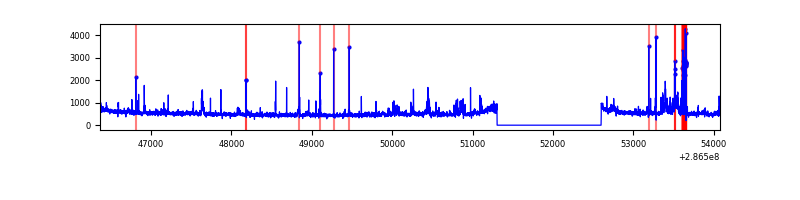 |
Top three noisy pixels from each quadrant. If the there are fewer than three noisy pixels in the level2.evt file, extra rows are filled as -1
| Pixel properties | Quadrant properties | ||||||
|---|---|---|---|---|---|---|---|
| Quadrant | DetID | PixID | Counts | Sigma | Mean | Median | Sigma |
| A | 14 | 111 | 1856045 | 11985.73 | 781 | 767 | 154.8 |
| A | 15 | 174 | 183694 | 1181.77 | 781 | 767 | 154.8 |
| A | 4 | 2 | 8665 | 51.02 | 781 | 767 | 154.8 |
| B | 5 | 172 | 57503 | 353.92 | 853 | 835 | 160.1 |
| B | 3 | 64 | 20446 | 122.48 | 853 | 835 | 160.1 |
| B | 12 | 111 | 17620 | 104.83 | 853 | 835 | 160.1 |
| C | 14 | 238 | 128454 | 688.92 | 806 | 811 | 185.3 |
| C | 3 | 233 | 55281 | 293.99 | 806 | 811 | 185.3 |
| C | 9 | 54 | 24470 | 127.69 | 806 | 811 | 185.3 |
| D | 11 | 176 | 151612 | 743.39 | 838 | 816 | 202.8 |
| D | 10 | 70 | 107657 | 526.7 | 838 | 816 | 202.8 |
| D | 7 | 238 | 92943 | 454.17 | 838 | 816 | 202.8 |
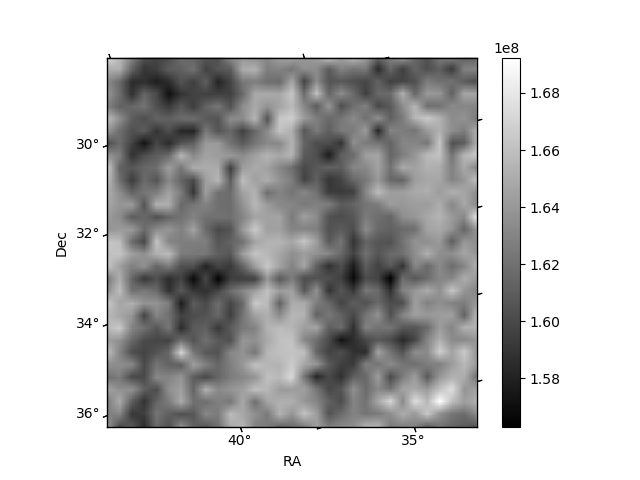
Histogram calculated using DETX and DETY for each event in the final _common_clean file
| Quadrant A | 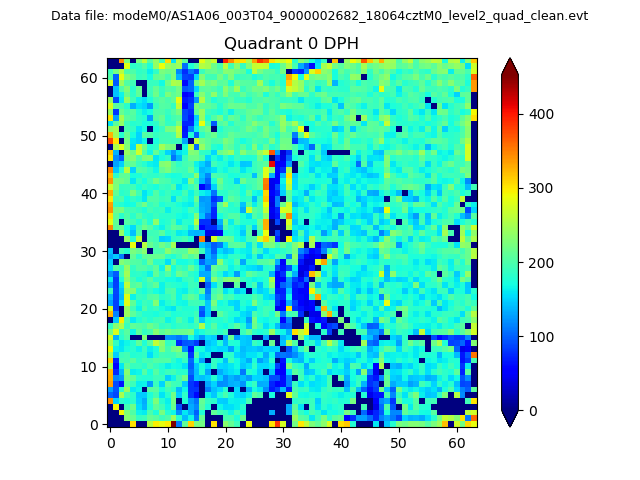 |
 |
Quadrant B |
|---|---|---|---|
| Quadrant D | 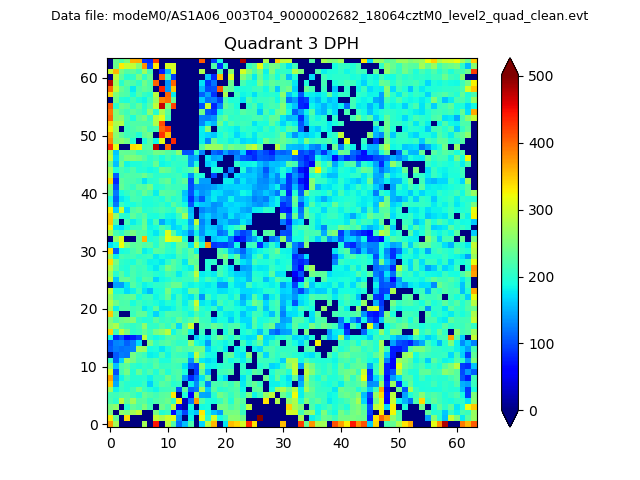 |
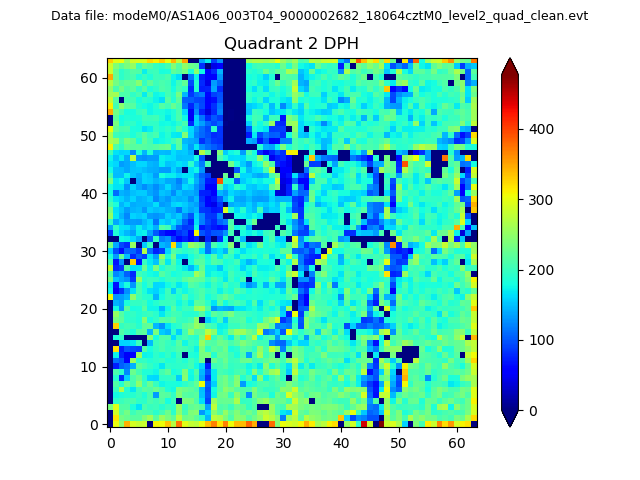 |
Quadrant C |
| Plot type | Count rate plots | Images |
|---|---|---|
| Comparison with Poisson distribution Blue bars denote a histogram of data divided into 1 sec bins. Red curve is a Poisson curve with rate = median count rate of data. |
 |
 |
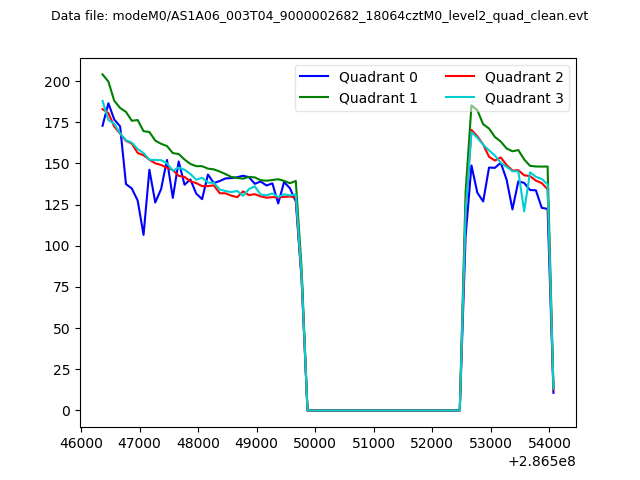
| Quadrant-wise count rates Data is divided into 100 sec bins |
 |
|
| Module-wise count rates for Quadrant A Data is divided into 100 sec bins |
 |
 |
| Module-wise count rates for Quadrant B Data is divided into 100 sec bins |
 |
 |
| Module-wise count rates for Quadrant C Data is divided into 100 sec bins |
 |
 |
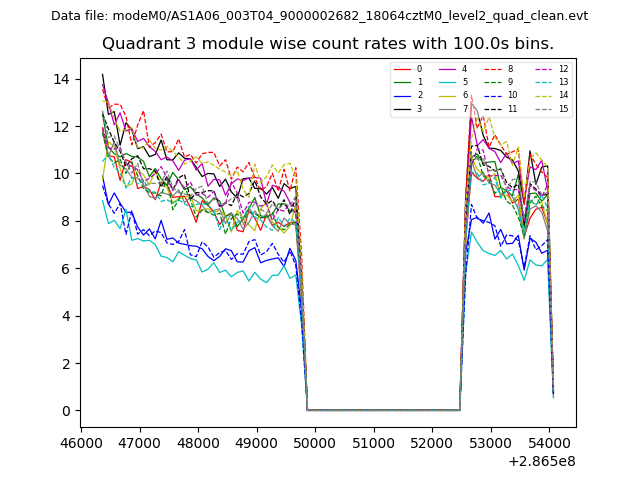
| Module-wise count rates for Quadrant D Data is divided into 100 sec bins |
 |
 |
| Parameter | Plot |
|---|---|
| CZT HV Monitor |  |
| D_VDD |  |
| Temperature 1 | 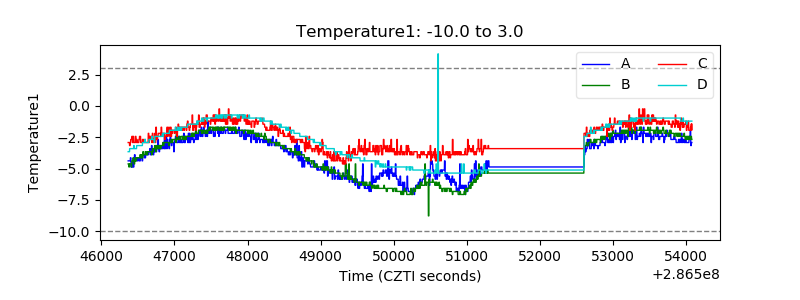 |
| Veto HV Monitor | 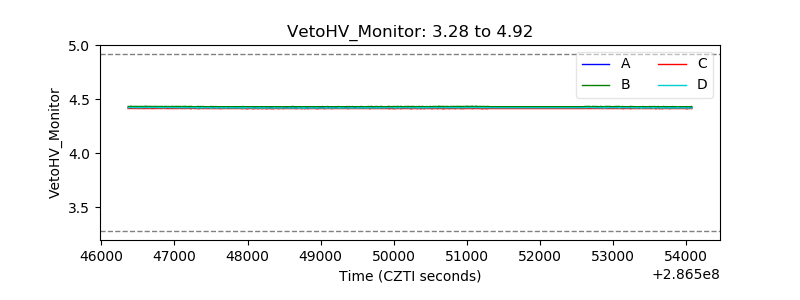 |
| Veto LLD | 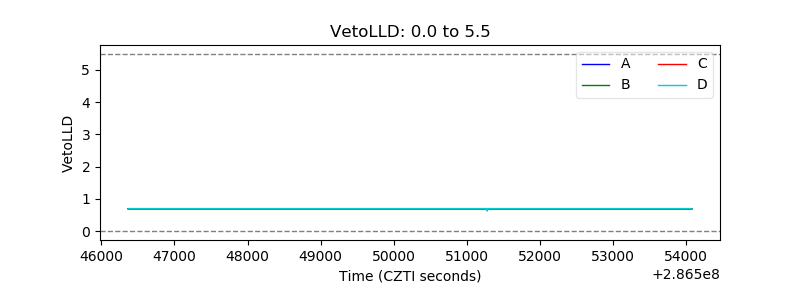 |
| Alpha Counter | 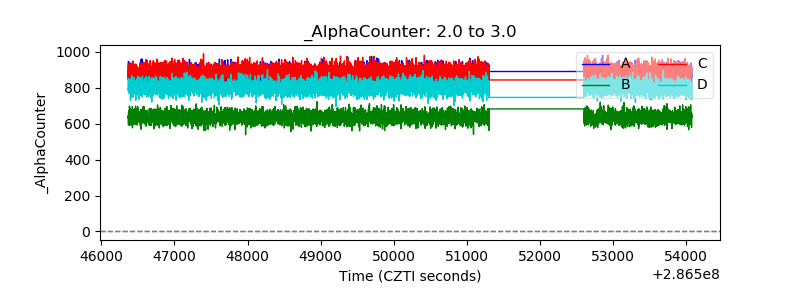 |
| _CPM_Rate | 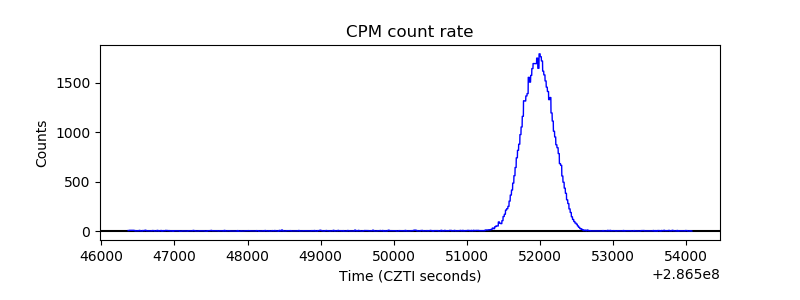 |
| CZT Counter | 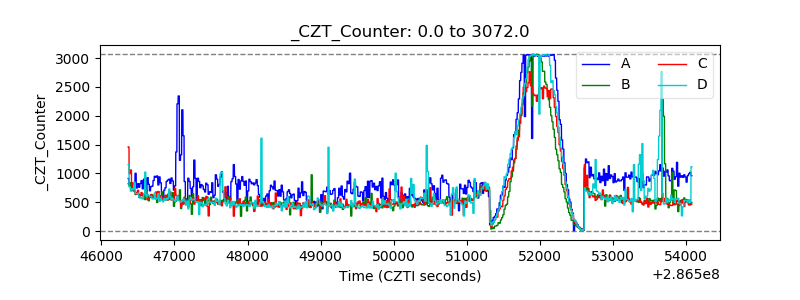 |
| +2.5 Volts monitor |  |
| +5 Volts monitor |  |
| _ROLL_ROT | 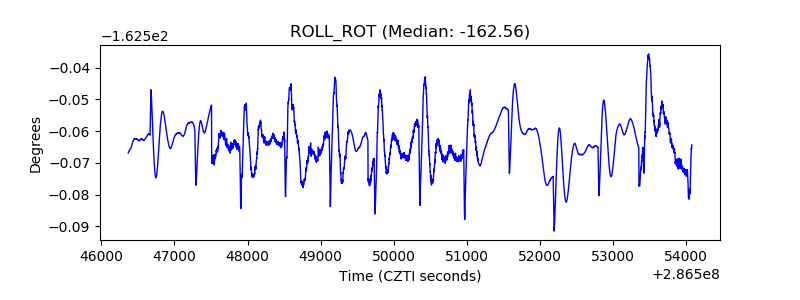 |
| _Roll_DEC | 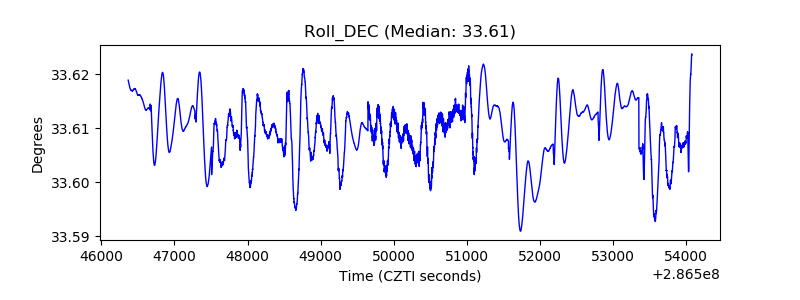 |
| _Roll_RA | 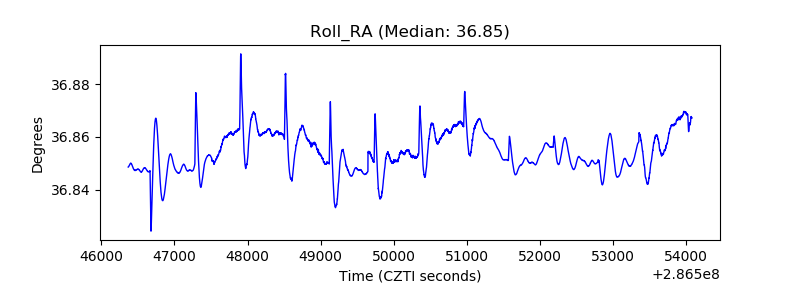 |
| Veto Counter | 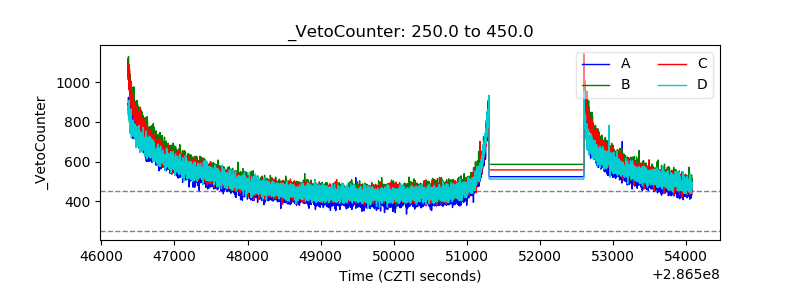 |