| Param | Original file | Final file |
|---|---|---|
| Filename | modeM0/AS1A06_003T04_9000002682_18067cztM0_level2.evt | modeM0/AS1A06_003T04_9000002682_18067cztM0_level2_quad_clean.evt |
| Size (bytes) | 485,824,320 | 97,450,560 |
| Size | 463.3 MB | 92.9 MB |
| Events in quadrant A | 4,205,305 | 619,019 |
| Events in quadrant B | 3,358,162 | 635,227 |
| Events in quadrant C | 3,331,992 | 603,845 |
| Events in quadrant D | 3,343,350 | 606,555 |
| Mode SS | |||
|---|---|---|---|
| Quadrant | BADHDUFLAG | Total packets | Discarded packets |
| A | 0 | 142 | 0 |
| B | 0 | 142 | 0 |
| C | 0 | 142 | 0 |
| D | 0 | 142 | 0 |
| Mode M0 | |||
|---|---|---|---|
| Quadrant | BADHDUFLAG | Total packets | Discarded packets |
| A | 0 | 17015 | 3 |
| B | 0 | 14417 | 2 |
| C | 0 | 14368 | 2 |
| D | 0 | 14679 | 2 |
| Mode M9 | |||
|---|---|---|---|
| Quadrant | BADHDUFLAG | Total packets | Discarded packets |
| A | 0 | 10 | 0 |
| B | 0 | 11 | 0 |
| C | 0 | 11 | 0 |
| D | 0 | 11 | 0 |
| Quadrant | Total seconds | Saturated seconds | Saturation percentage |
|---|---|---|---|
| A | 6982 | 372 | 5.327986% |
| B | 6982 | 27 | 0.386709% |
| C | 6982 | 61 | 0.873675% |
| D | 6982 | 19 | 0.272128% |
Noise dominated data is calculated using 1-second bins in cleaned event files. If a bin has >2000 counts, and if more than 50% of those come from <1% of pixels, then it is considered to be noise-dominated and hence unusable.
| Quadrant | # 1 sec bins | Bins with >0 counts | Bins with >2000 counts | High rate bins dominated by noise | Noise dominated (total time) | Noise dominated (detector-on time) | Marked lightcurve |
|---|---|---|---|---|---|---|---|
| A | 7677 | 6983 | 25 | 25 | 0.33% | 0.36% | 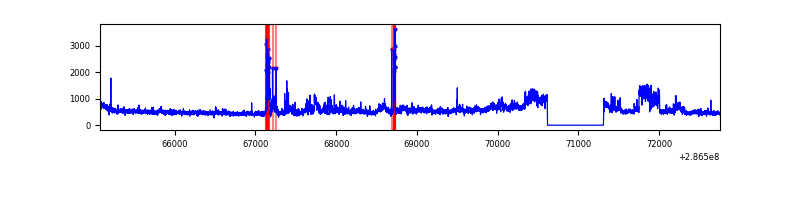 |
| B | 7677 | 6983 | 0 | 0 | 0.00% | 0.00% | 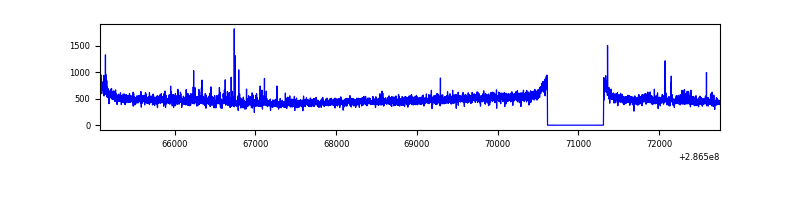 |
| C | 7677 | 6983 | 0 | 0 | 0.00% | 0.00% | 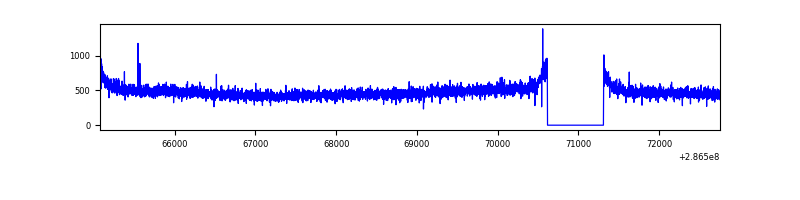 |
| D | 7677 | 6983 | 10 | 10 | 0.13% | 0.14% | 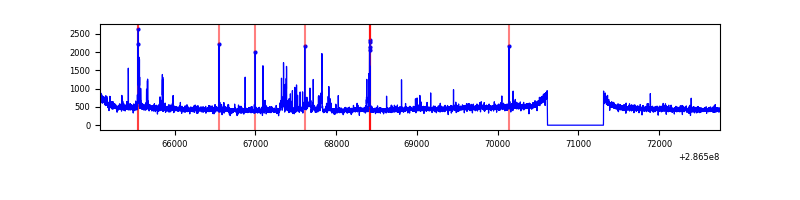 |
Top three noisy pixels from each quadrant. If the there are fewer than three noisy pixels in the level2.evt file, extra rows are filled as -1
| Pixel properties | Quadrant properties | ||||||
|---|---|---|---|---|---|---|---|
| Quadrant | DetID | PixID | Counts | Sigma | Mean | Median | Sigma |
| A | 14 | 111 | 796731 | 4705.96 | 834 | 814 | 169.1 |
| A | 15 | 174 | 190051 | 1118.89 | 834 | 814 | 169.1 |
| A | 4 | 2 | 13142 | 72.89 | 834 | 814 | 169.1 |
| B | 0 | 197 | 26857 | 160.22 | 843 | 821 | 162.5 |
| B | 12 | 111 | 18686 | 109.94 | 843 | 821 | 162.5 |
| B | 11 | 111 | 16220 | 94.76 | 843 | 821 | 162.5 |
| C | 14 | 238 | 125457 | 661.98 | 807 | 813 | 188.3 |
| C | 3 | 233 | 45177 | 235.62 | 807 | 813 | 188.3 |
| C | 9 | 160 | 6513 | 30.27 | 807 | 813 | 188.3 |
| D | 11 | 176 | 86002 | 425.26 | 827 | 805 | 200.3 |
| D | 10 | 70 | 34646 | 168.92 | 827 | 805 | 200.3 |
| D | 2 | 234 | 28532 | 138.4 | 827 | 805 | 200.3 |
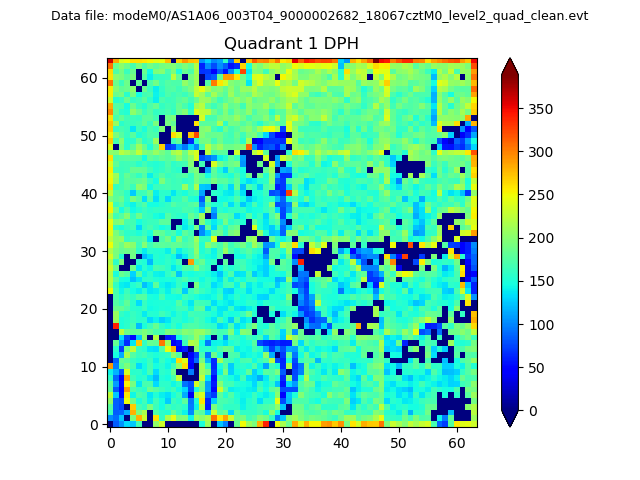
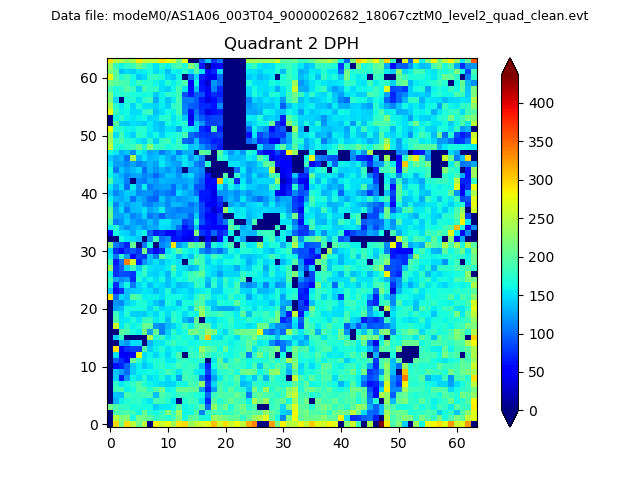
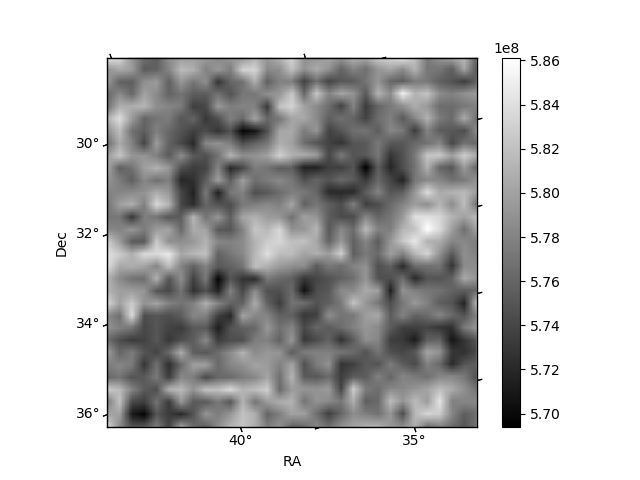
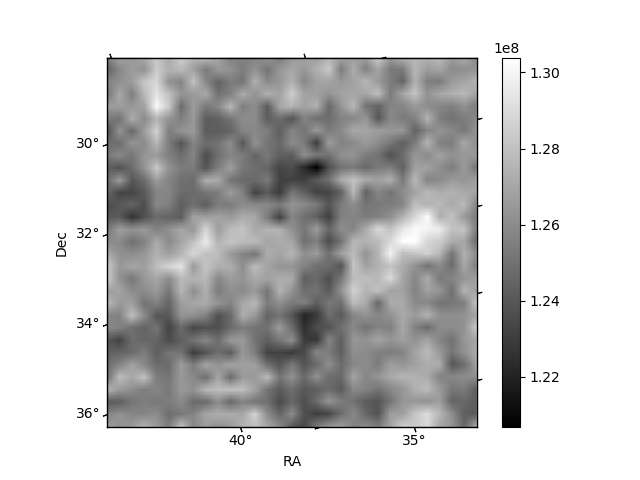
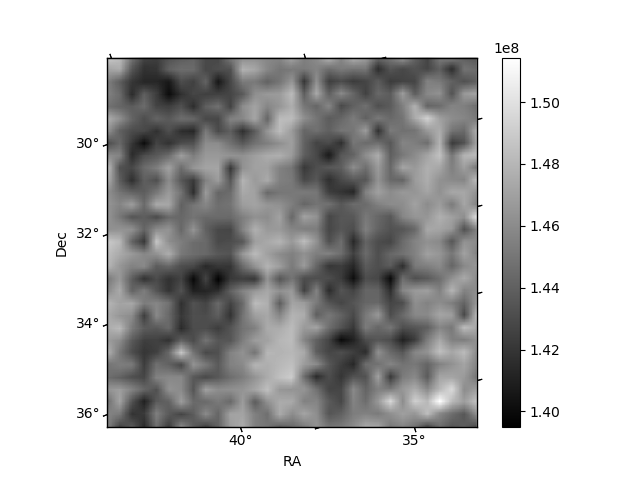
Histogram calculated using DETX and DETY for each event in the final _common_clean file
| Quadrant A |  |
 |
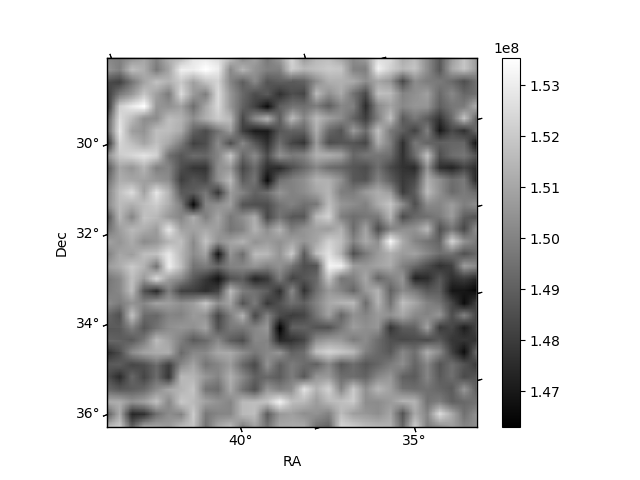
Quadrant B |
|---|---|---|---|
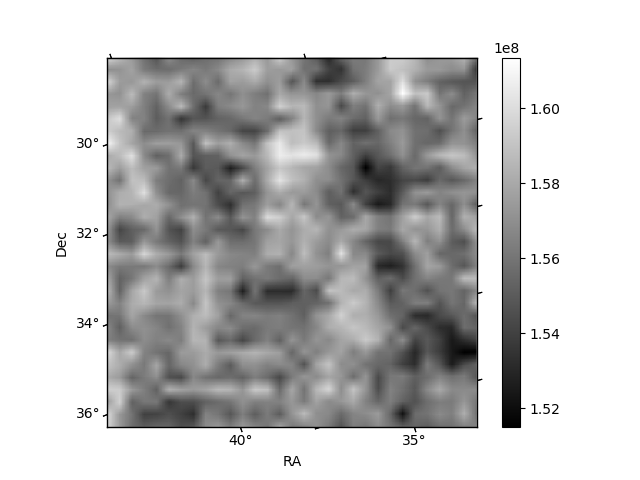
| Quadrant D | 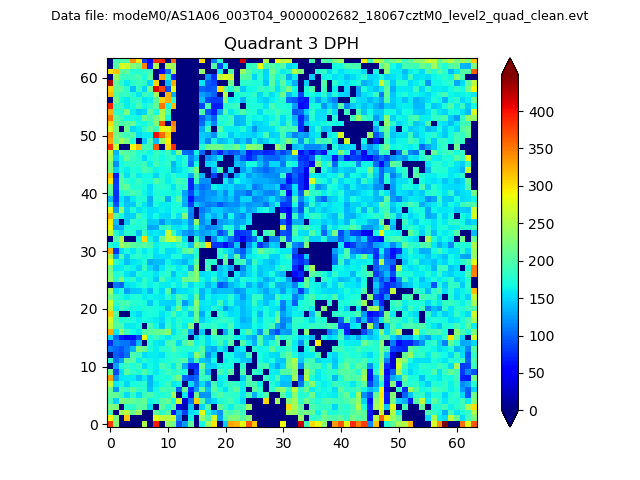 |
 |
Quadrant C |
| Plot type | Count rate plots | Images |
|---|---|---|
| Comparison with Poisson distribution Blue bars denote a histogram of data divided into 1 sec bins. Red curve is a Poisson curve with rate = median count rate of data. |
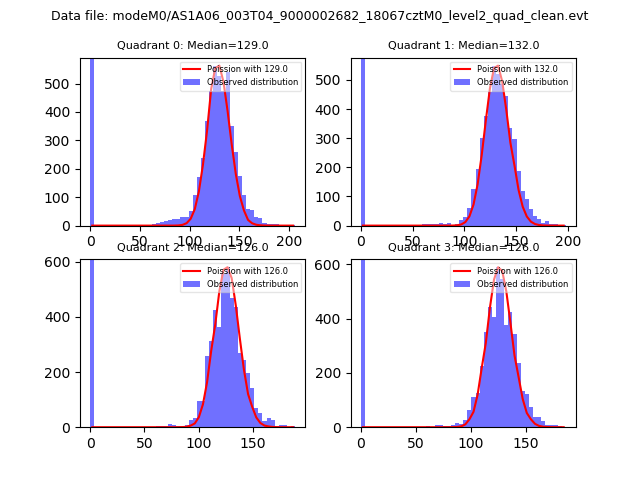 |
 |
| Quadrant-wise count rates Data is divided into 100 sec bins |
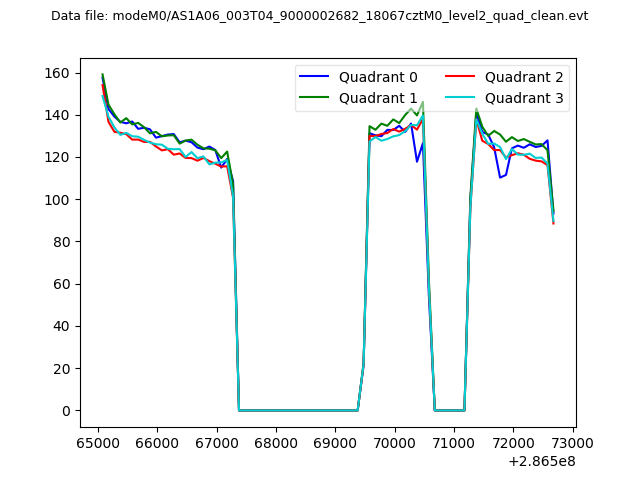 |
|
| Module-wise count rates for Quadrant A Data is divided into 100 sec bins |
 |
 |
| Module-wise count rates for Quadrant B Data is divided into 100 sec bins |
 |
 |
| Module-wise count rates for Quadrant C Data is divided into 100 sec bins |
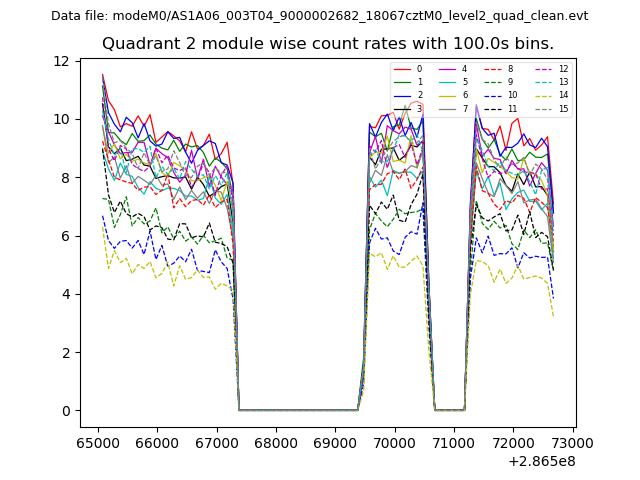 |
 |
| Module-wise count rates for Quadrant D Data is divided into 100 sec bins |
 |
 |
| Parameter | Plot |
|---|---|
| CZT HV Monitor | 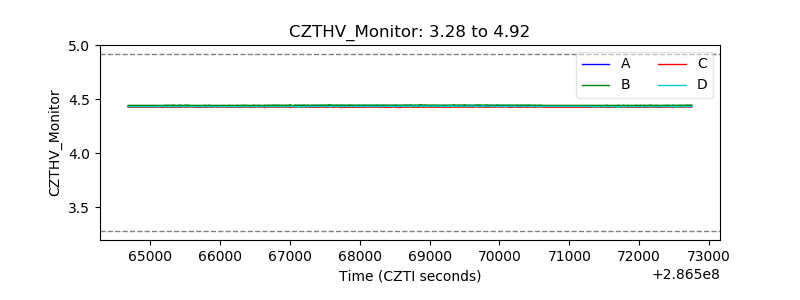 |
| D_VDD | 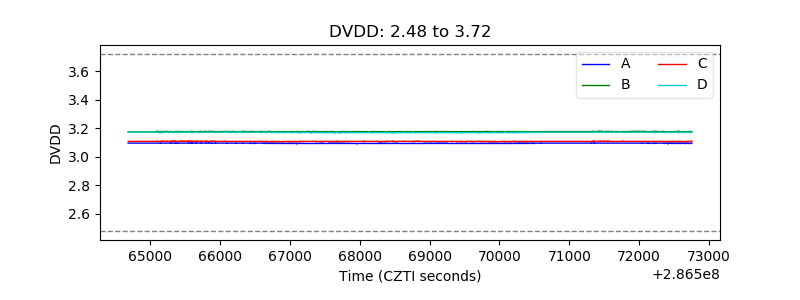 |
| Temperature 1 | 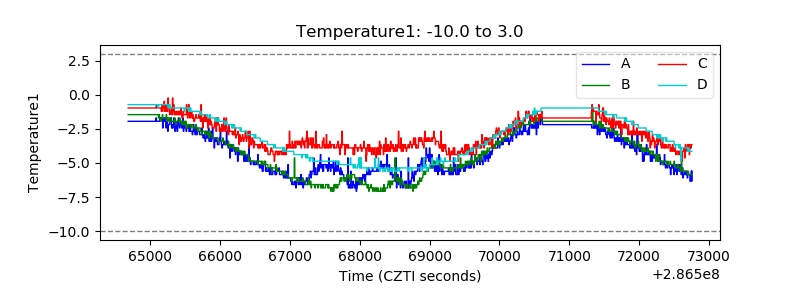 |
| Veto HV Monitor | 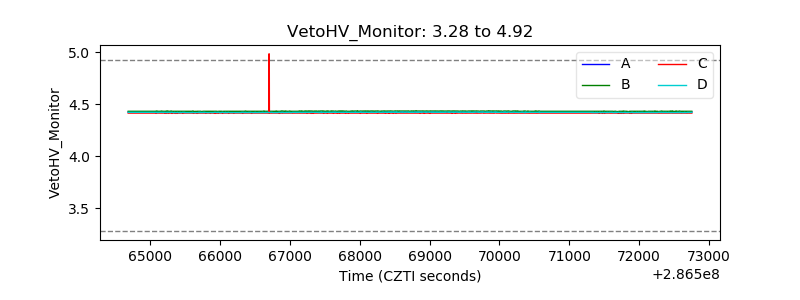 |
| Veto LLD | 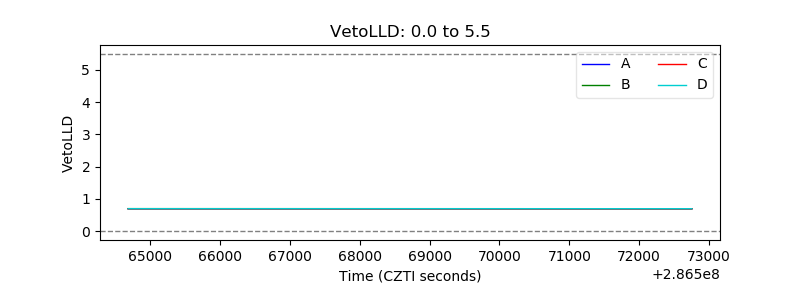 |
| Alpha Counter | 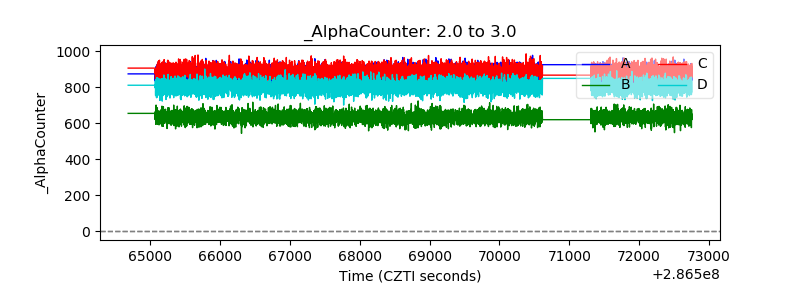 |
| _CPM_Rate | 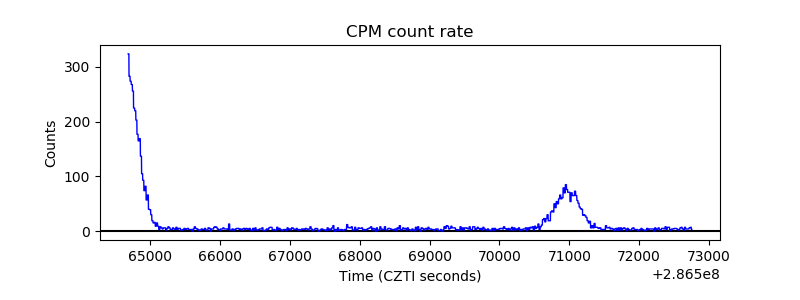 |
| CZT Counter | 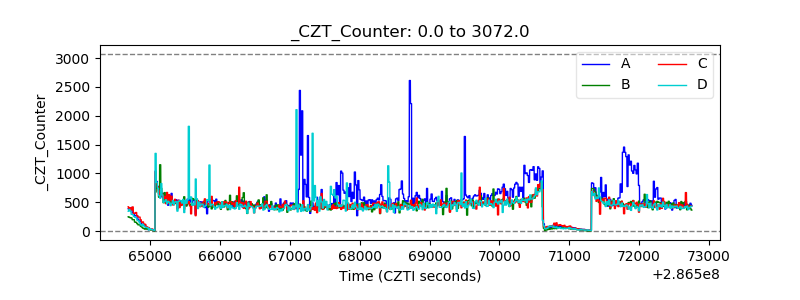 |
| +2.5 Volts monitor |  |
| +5 Volts monitor |  |
| _ROLL_ROT | 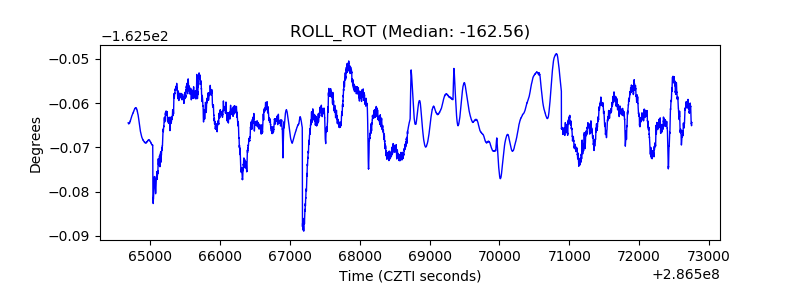 |
| _Roll_DEC | 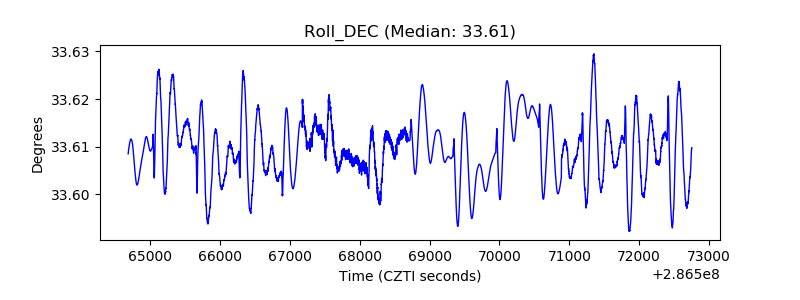 |
| _Roll_RA |  |
| Veto Counter | 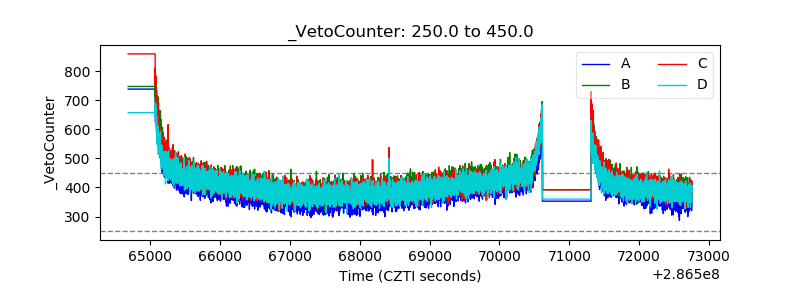 |