| Param | Original file | Final file |
|---|---|---|
| Filename | modeM0/AS1A06_003T04_9000002682_18068cztM0_level2.evt | modeM0/AS1A06_003T04_9000002682_18068cztM0_level2_quad_clean.evt |
| Size (bytes) | 609,592,320 | 99,604,800 |
| Size | 581.4 MB | 95.0 MB |
| Events in quadrant A | 4,517,605 | 645,518 |
| Events in quadrant B | 3,491,432 | 671,587 |
| Events in quadrant C | 3,501,792 | 636,663 |
| Events in quadrant D | 6,452,848 | 551,168 |
| Mode SS | |||
|---|---|---|---|
| Quadrant | BADHDUFLAG | Total packets | Discarded packets |
| A | 0 | 150 | 0 |
| B | 0 | 150 | 0 |
| C | 0 | 150 | 0 |
| D | 0 | 150 | 0 |
| Mode M0 | |||
|---|---|---|---|
| Quadrant | BADHDUFLAG | Total packets | Discarded packets |
| A | 0 | 18367 | 2 |
| B | 0 | 15149 | 2 |
| C | 0 | 15133 | 2 |
| D | 0 | 24269 | 2 |
| Mode M9 | |||
|---|---|---|---|
| Quadrant | BADHDUFLAG | Total packets | Discarded packets |
| A | 0 | 9 | 0 |
| B | 0 | 10 | 0 |
| C | 0 | 10 | 0 |
| D | 0 | 10 | 0 |
| Quadrant | Total seconds | Saturated seconds | Saturation percentage |
|---|---|---|---|
| A | 7337 | 610 | 8.314025% |
| B | 7337 | 53 | 0.722366% |
| C | 7336 | 92 | 1.254089% |
| D | 7336 | 1421 | 19.370229% |
Noise dominated data is calculated using 1-second bins in cleaned event files. If a bin has >2000 counts, and if more than 50% of those come from <1% of pixels, then it is considered to be noise-dominated and hence unusable.
| Quadrant | # 1 sec bins | Bins with >0 counts | Bins with >2000 counts | High rate bins dominated by noise | Noise dominated (total time) | Noise dominated (detector-on time) | Marked lightcurve |
|---|---|---|---|---|---|---|---|
| A | 7652 | 7337 | 3 | 3 | 0.04% | 0.04% | 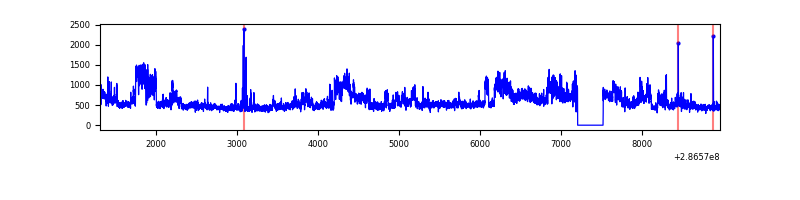 |
| B | 7652 | 7338 | 0 | 0 | 0.00% | 0.00% | 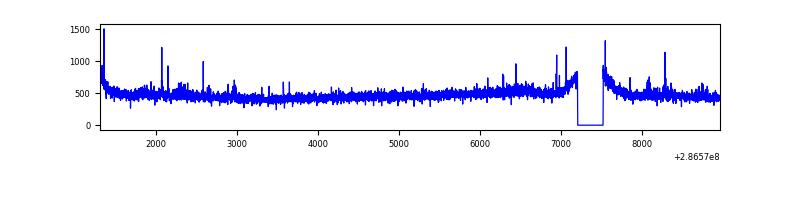 |
| C | 7651 | 7337 | 0 | 0 | 0.00% | 0.00% | 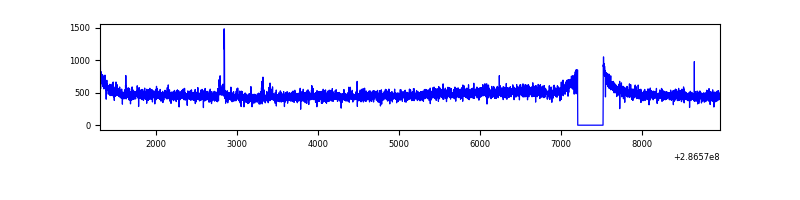 |
| D | 7650 | 7336 | 1213 | 1213 | 15.86% | 16.53% | 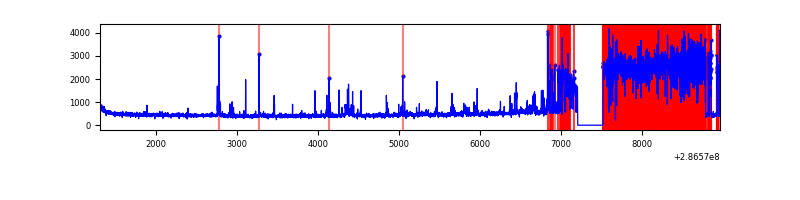 |
Top three noisy pixels from each quadrant. If the there are fewer than three noisy pixels in the level2.evt file, extra rows are filled as -1
| Pixel properties | Quadrant properties | ||||||
|---|---|---|---|---|---|---|---|
| Quadrant | DetID | PixID | Counts | Sigma | Mean | Median | Sigma |
| A | 14 | 111 | 1154440 | 6570.22 | 860 | 840 | 175.6 |
| A | 15 | 174 | 43243 | 241.5 | 860 | 840 | 175.6 |
| A | 4 | 2 | 12638 | 67.19 | 860 | 840 | 175.6 |
| B | 12 | 111 | 19894 | 112.33 | 879 | 856 | 169.5 |
| B | 0 | 197 | 17502 | 98.22 | 879 | 856 | 169.5 |
| B | 11 | 111 | 17194 | 96.4 | 879 | 856 | 169.5 |
| C | 14 | 238 | 132466 | 668.99 | 843 | 848 | 196.7 |
| C | 3 | 233 | 64440 | 323.23 | 843 | 848 | 196.7 |
| C | 9 | 160 | 8769 | 40.26 | 843 | 848 | 196.7 |
| D | 7 | 238 | 3030772 | 15820.93 | 787 | 764 | 191.5 |
| D | 5 | 222 | 253377 | 1319.0 | 787 | 764 | 191.5 |
| D | 11 | 176 | 76741 | 396.7 | 787 | 764 | 191.5 |
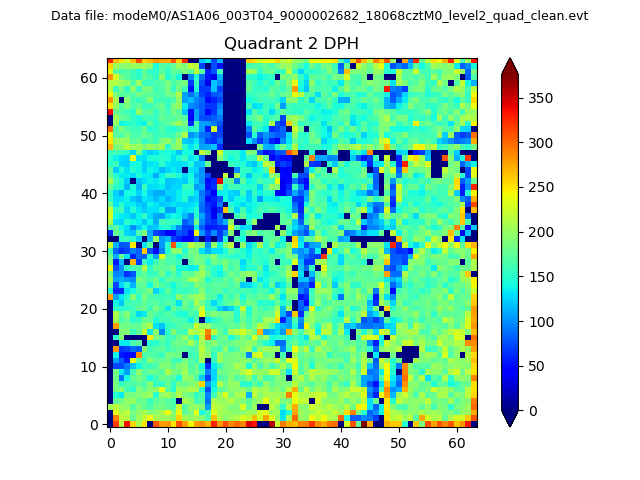
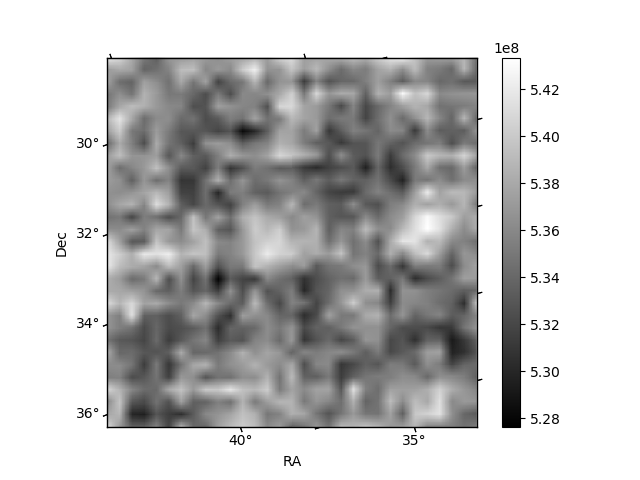
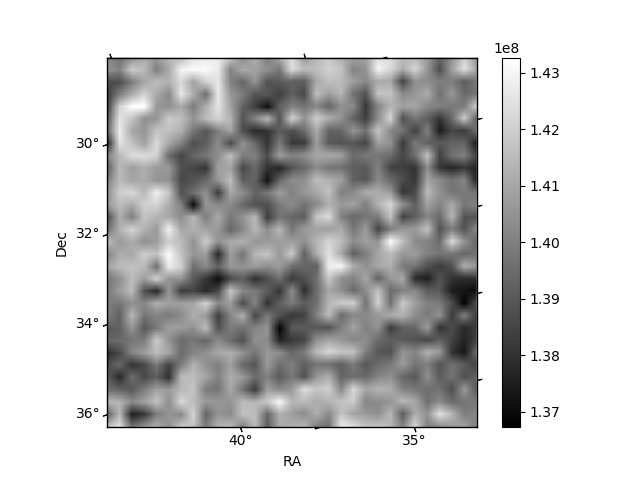
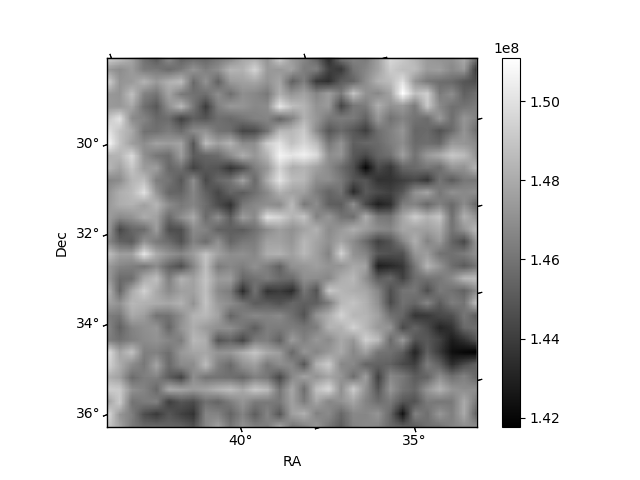
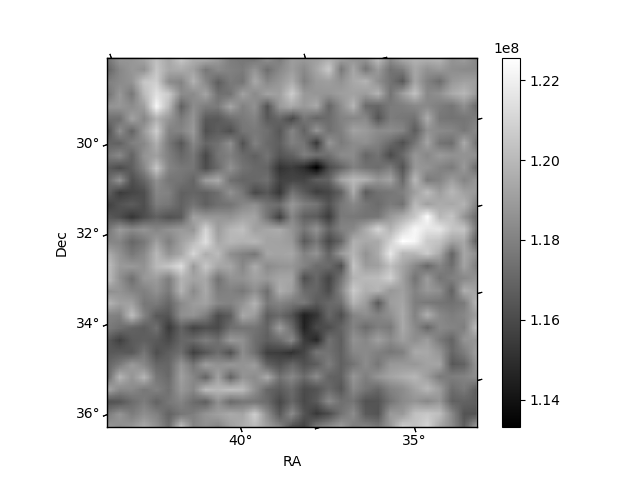
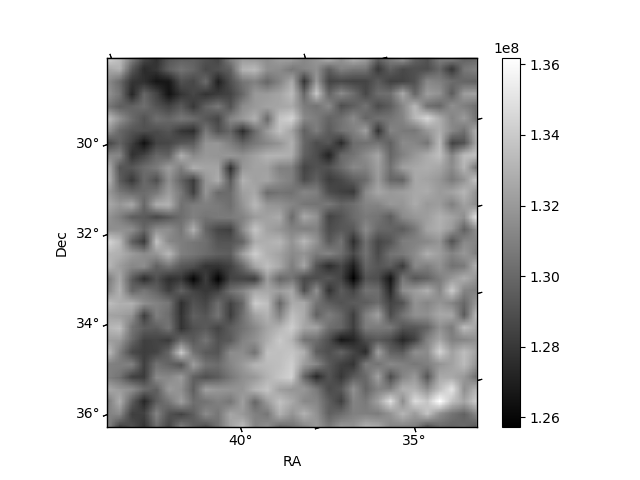
Histogram calculated using DETX and DETY for each event in the final _common_clean file
| Quadrant A | 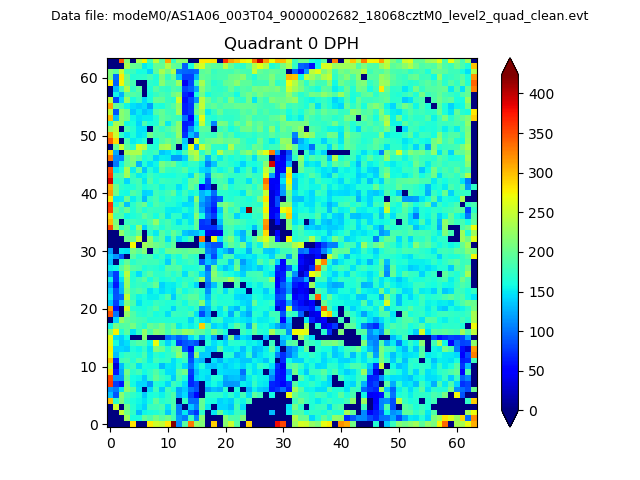 |
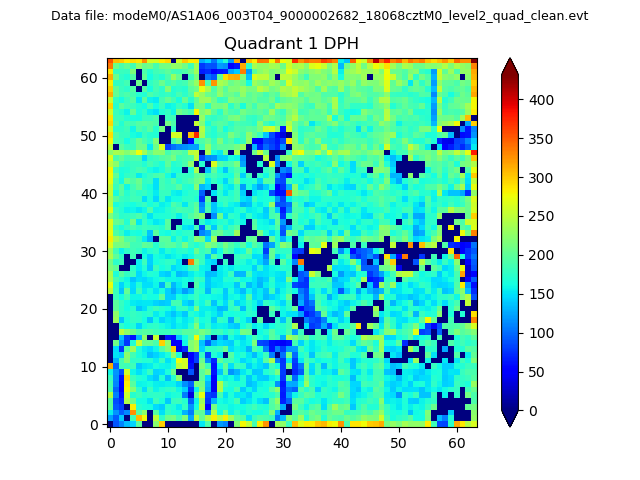 |
Quadrant B |
|---|---|---|---|
| Quadrant D | 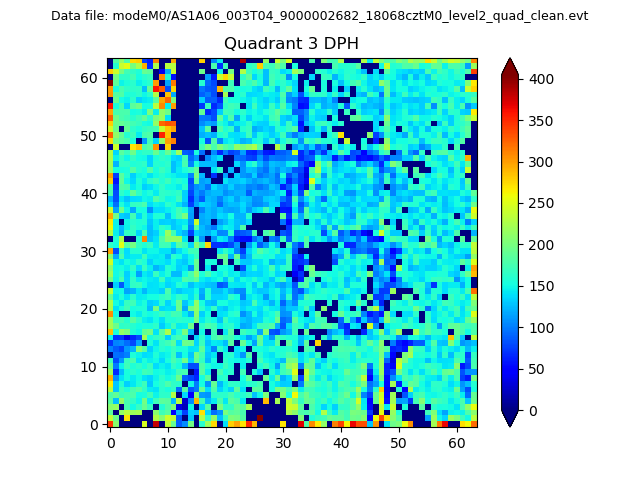 |
 |
Quadrant C |
| Plot type | Count rate plots | Images |
|---|---|---|
| Comparison with Poisson distribution Blue bars denote a histogram of data divided into 1 sec bins. Red curve is a Poisson curve with rate = median count rate of data. |
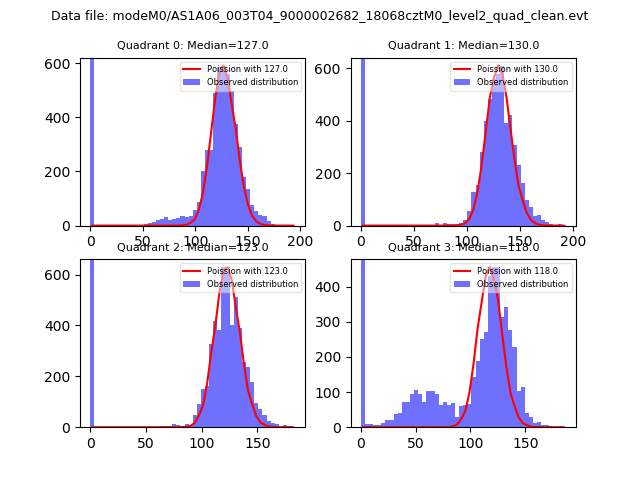 |
 |
| Quadrant-wise count rates Data is divided into 100 sec bins |
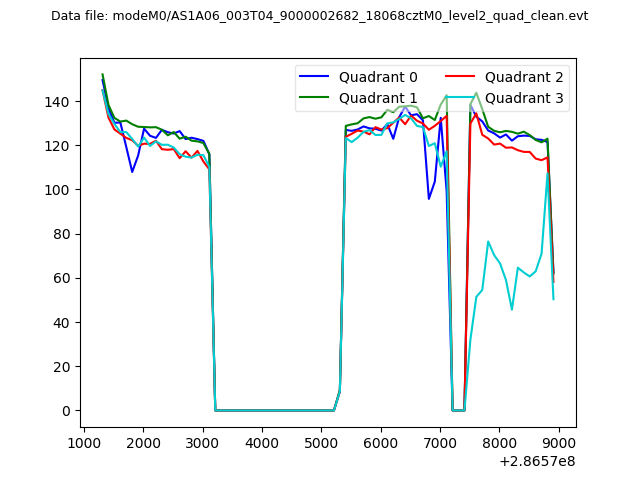 |
|
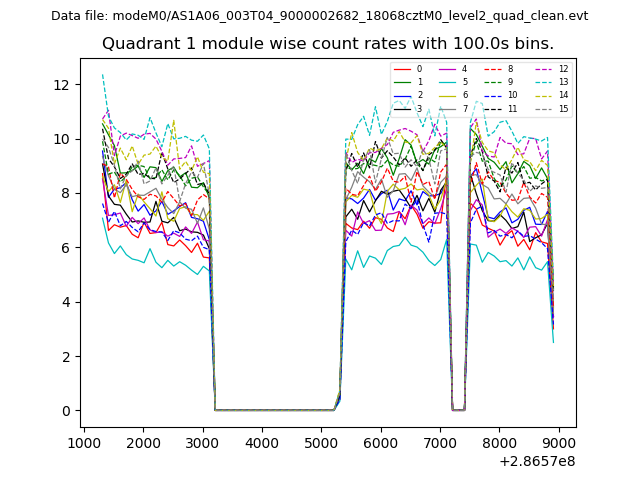
| Module-wise count rates for Quadrant A Data is divided into 100 sec bins |
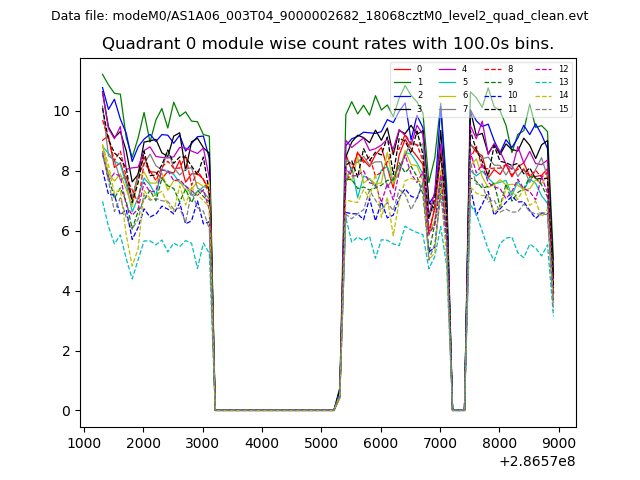 |
 |
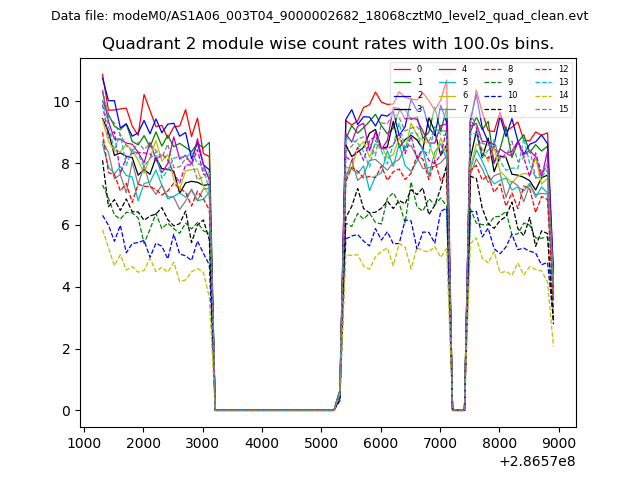
| Module-wise count rates for Quadrant B Data is divided into 100 sec bins |
 |
 |
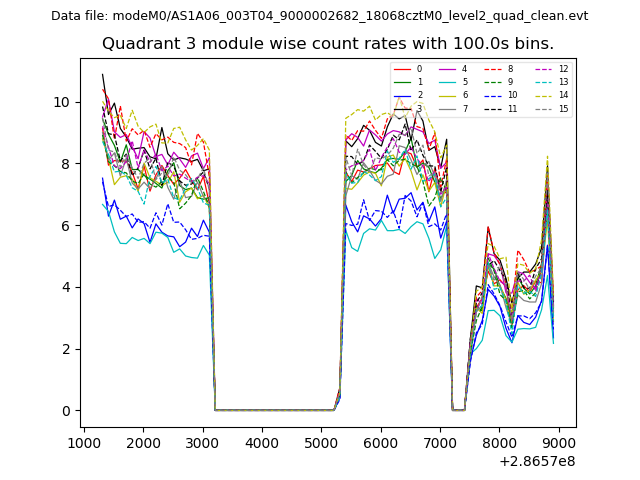
| Module-wise count rates for Quadrant C Data is divided into 100 sec bins |
 |
 |
| Module-wise count rates for Quadrant D Data is divided into 100 sec bins |
 |
 |
| Parameter | Plot |
|---|---|
| CZT HV Monitor | 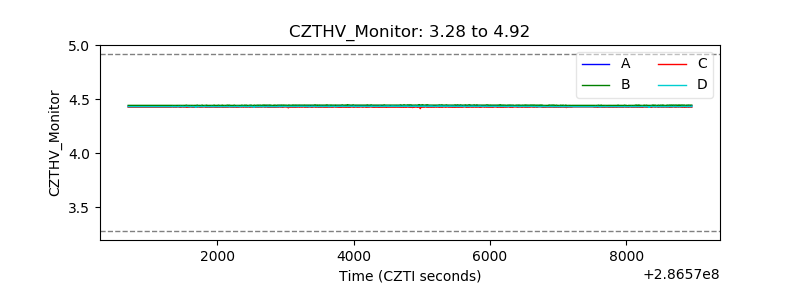 |
| D_VDD |  |
| Temperature 1 | 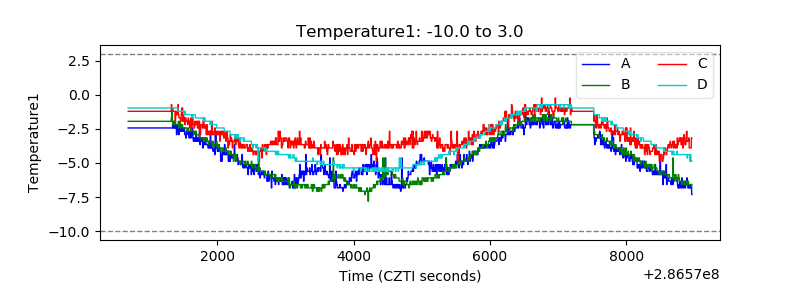 |
| Veto HV Monitor | 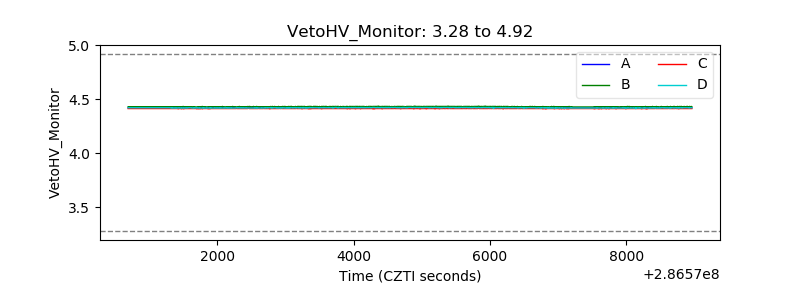 |
| Veto LLD | 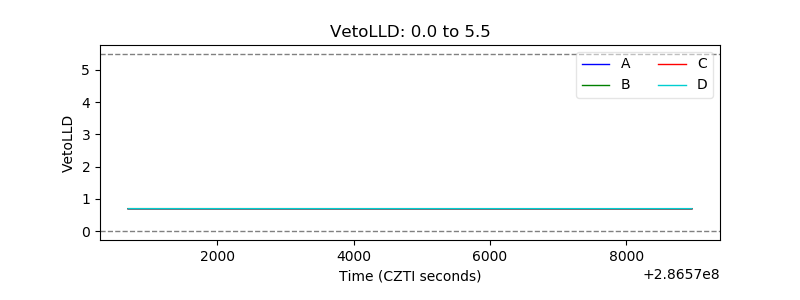 |
| Alpha Counter | 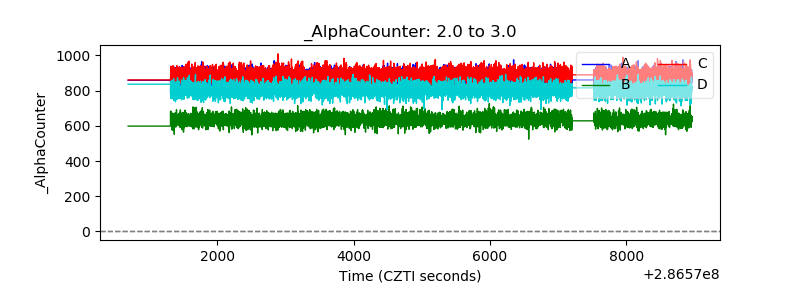 |
| _CPM_Rate | 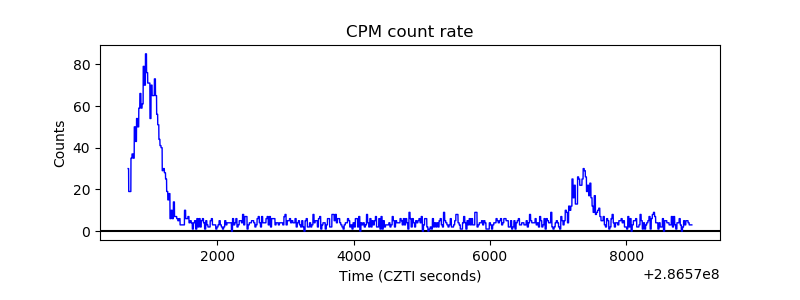 |
| CZT Counter | 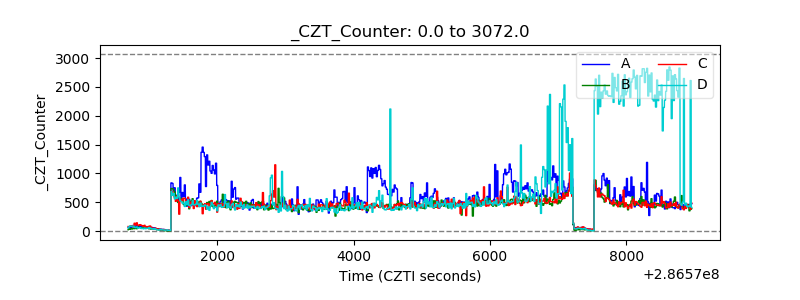 |
| +2.5 Volts monitor |  |
| +5 Volts monitor |  |
| _ROLL_ROT |  |
| _Roll_DEC | 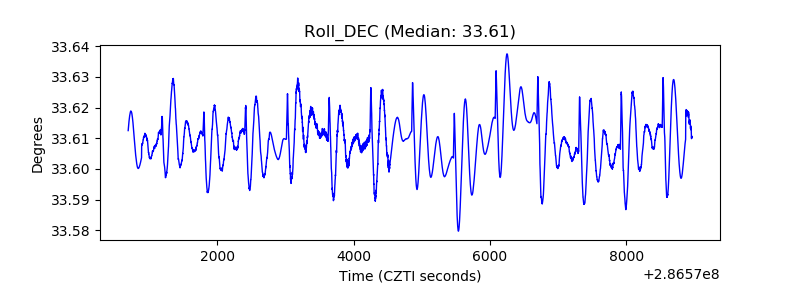 |
| _Roll_RA | 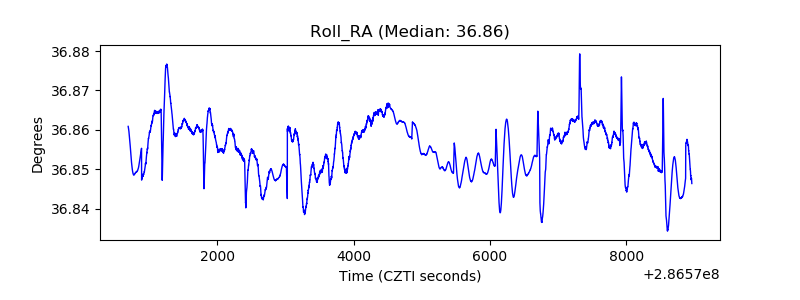 |
| Veto Counter | 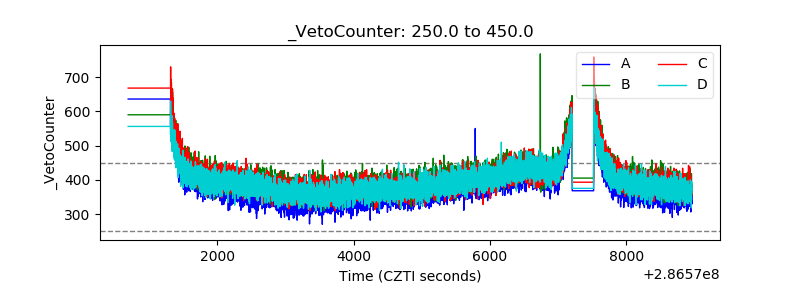 |