| Param | Original file | Final file |
|---|---|---|
| Filename | modeM0/AS1A06_003T04_9000002682_18069cztM0_level2.evt | modeM0/AS1A06_003T04_9000002682_18069cztM0_level2_quad_clean.evt |
| Size (bytes) | 752,325,120 | 102,064,320 |
| Size | 717.5 MB | 97.3 MB |
| Events in quadrant A | 4,618,978 | 674,691 |
| Events in quadrant B | 3,861,301 | 701,411 |
| Events in quadrant C | 3,869,997 | 663,893 |
| Events in quadrant D | 9,889,972 | 491,468 |
| Mode SS | |||
|---|---|---|---|
| Quadrant | BADHDUFLAG | Total packets | Discarded packets |
| A | 0 | 164 | 0 |
| B | 0 | 164 | 0 |
| C | 0 | 164 | 0 |
| D | 0 | 164 | 0 |
| Mode M0 | |||
|---|---|---|---|
| Quadrant | BADHDUFLAG | Total packets | Discarded packets |
| A | 0 | 19033 | 2 |
| B | 0 | 16742 | 2 |
| C | 0 | 16742 | 2 |
| D | 0 | 34867 | 2 |
| Mode M9 | |||
|---|---|---|---|
| Quadrant | BADHDUFLAG | Total packets | Discarded packets |
| A | 0 | 6 | 0 |
| B | 0 | 6 | 0 |
| C | 0 | 6 | 0 |
| D | 0 | 6 | 0 |
| Quadrant | Total seconds | Saturated seconds | Saturation percentage |
|---|---|---|---|
| A | 8025 | 494 | 6.155763% |
| B | 8025 | 157 | 1.956386% |
| C | 8026 | 163 | 2.030900% |
| D | 8026 | 2889 | 35.995515% |
Noise dominated data is calculated using 1-second bins in cleaned event files. If a bin has >2000 counts, and if more than 50% of those come from <1% of pixels, then it is considered to be noise-dominated and hence unusable.
| Quadrant | # 1 sec bins | Bins with >0 counts | Bins with >2000 counts | High rate bins dominated by noise | Noise dominated (total time) | Noise dominated (detector-on time) | Marked lightcurve |
|---|---|---|---|---|---|---|---|
| A | 8590 | 8026 | 19 | 19 | 0.22% | 0.24% | 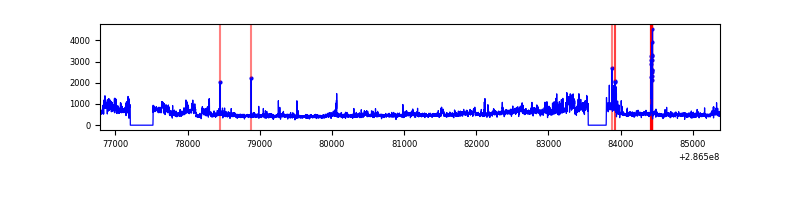 |
| B | 8590 | 8027 | 1 | 1 | 0.01% | 0.01% |  |
| C | 8591 | 8028 | 0 | 0 | 0.00% | 0.00% | 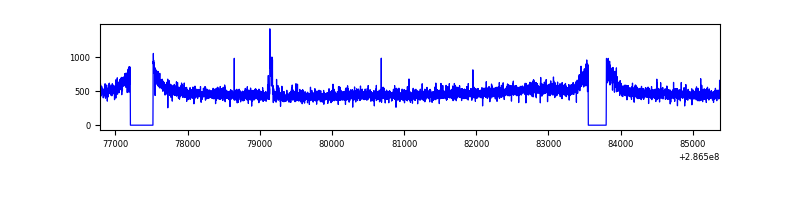 |
| D | 8591 | 8028 | 2546 | 2546 | 29.64% | 31.71% | 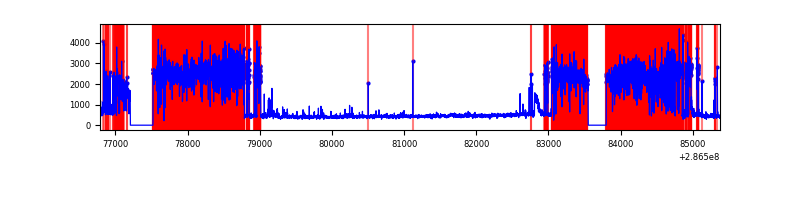 |
Top three noisy pixels from each quadrant. If the there are fewer than three noisy pixels in the level2.evt file, extra rows are filled as -1
| Pixel properties | Quadrant properties | ||||||
|---|---|---|---|---|---|---|---|
| Quadrant | DetID | PixID | Counts | Sigma | Mean | Median | Sigma |
| A | 14 | 111 | 774253 | 3944.41 | 958 | 934 | 196.1 |
| A | 4 | 2 | 87877 | 443.46 | 958 | 934 | 196.1 |
| A | 15 | 174 | 74029 | 372.83 | 958 | 934 | 196.1 |
| B | 12 | 111 | 22476 | 113.44 | 974 | 948 | 189.8 |
| B | 0 | 189 | 20233 | 101.62 | 974 | 948 | 189.8 |
| B | 11 | 111 | 19551 | 98.03 | 974 | 948 | 189.8 |
| C | 14 | 238 | 144646 | 650.51 | 938 | 942 | 220.9 |
| C | 3 | 233 | 58707 | 261.49 | 938 | 942 | 220.9 |
| C | 13 | 61 | 6654 | 25.86 | 938 | 942 | 220.9 |
| D | 7 | 238 | 6392490 | 32524.57 | 803 | 779 | 196.5 |
| D | 5 | 222 | 203364 | 1030.86 | 803 | 779 | 196.5 |
| D | 11 | 176 | 91778 | 463.05 | 803 | 779 | 196.5 |
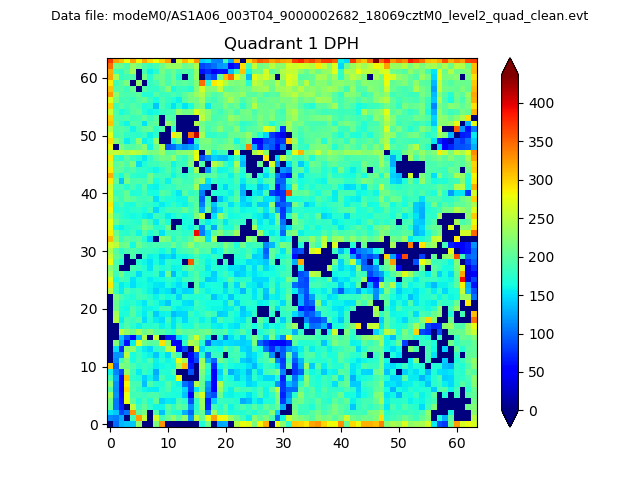
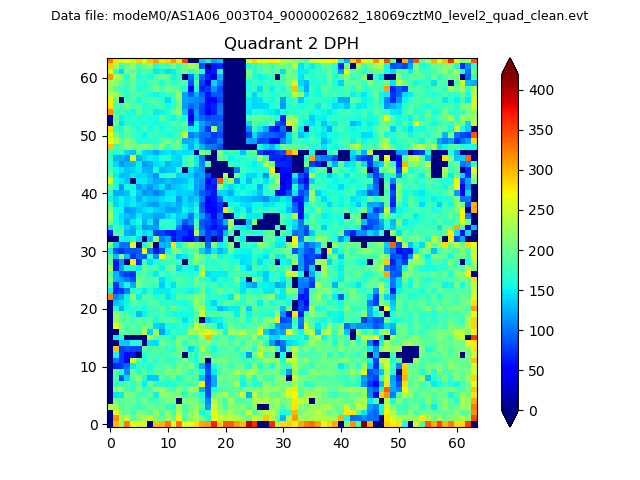
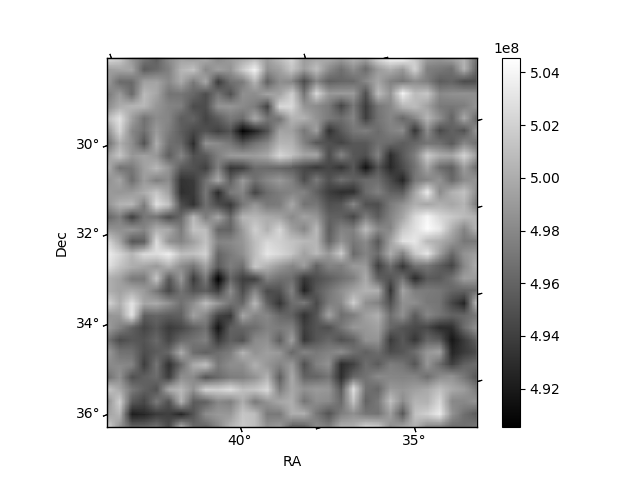
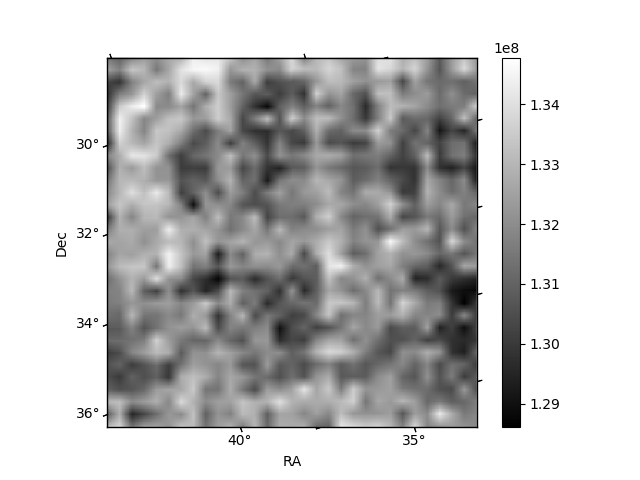
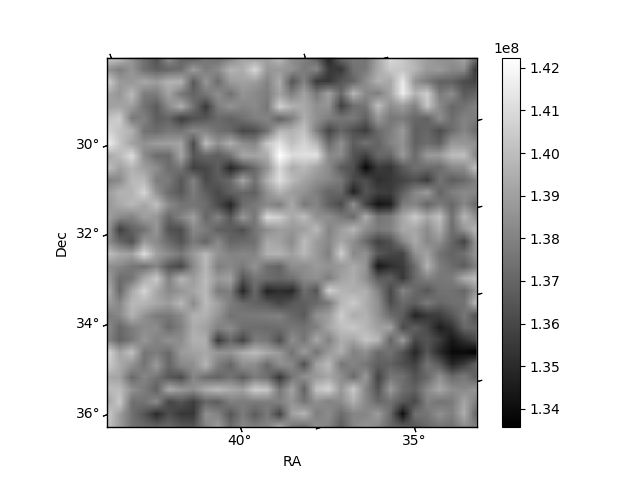
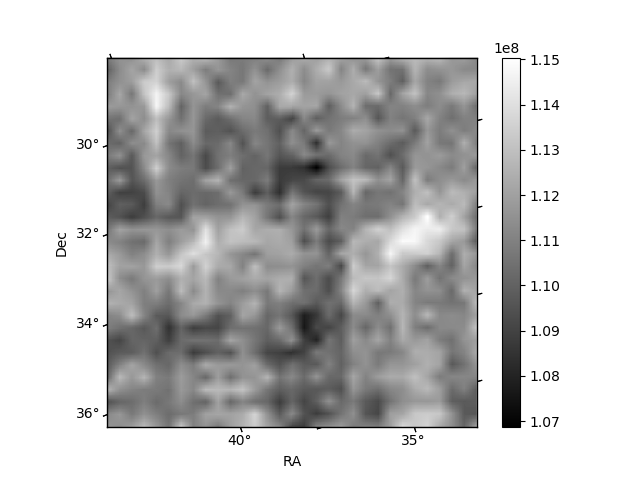
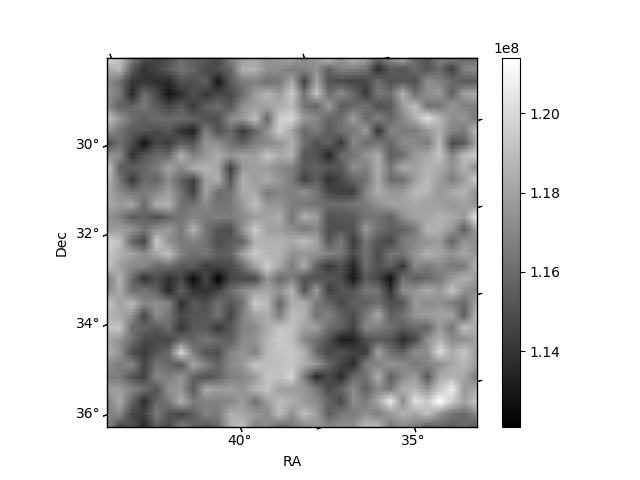
Histogram calculated using DETX and DETY for each event in the final _common_clean file
| Quadrant A | 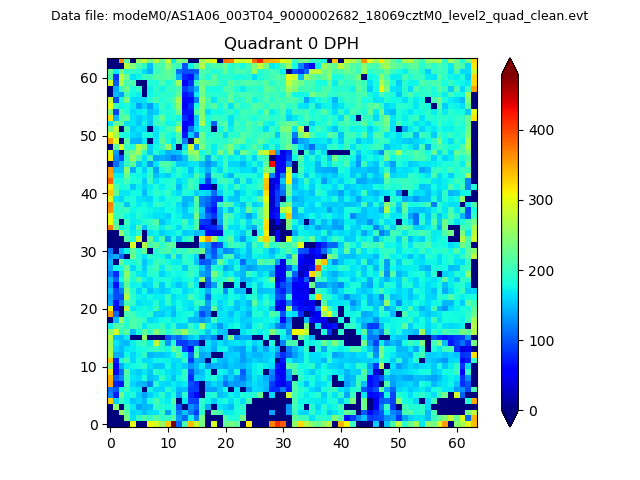 |
 |
Quadrant B |
|---|---|---|---|
| Quadrant D | 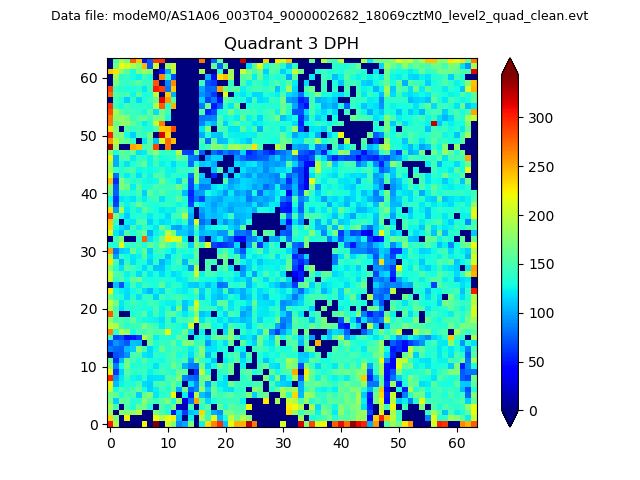 |
 |
Quadrant C |
| Plot type | Count rate plots | Images |
|---|---|---|
| Comparison with Poisson distribution Blue bars denote a histogram of data divided into 1 sec bins. Red curve is a Poisson curve with rate = median count rate of data. |
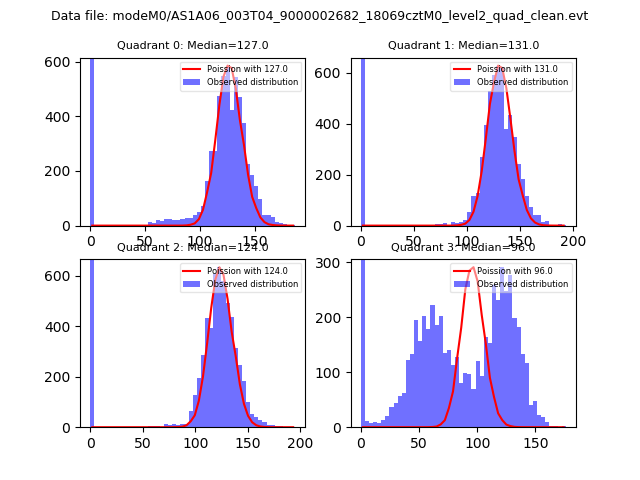 |
 |
| Quadrant-wise count rates Data is divided into 100 sec bins |
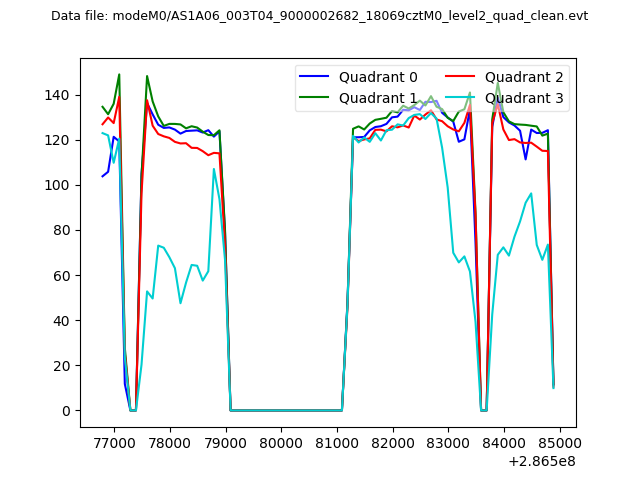 |
|
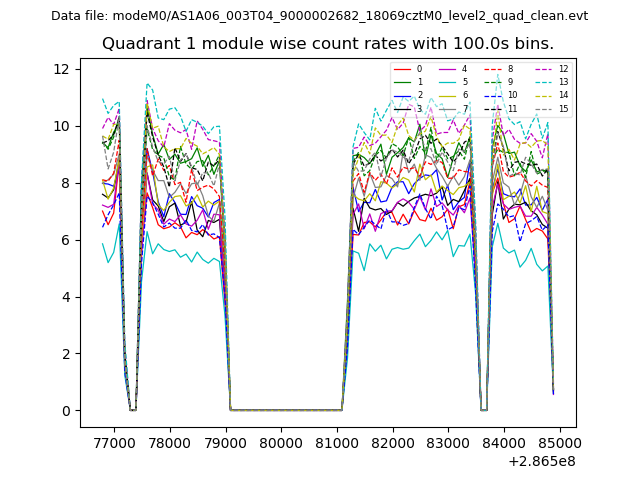
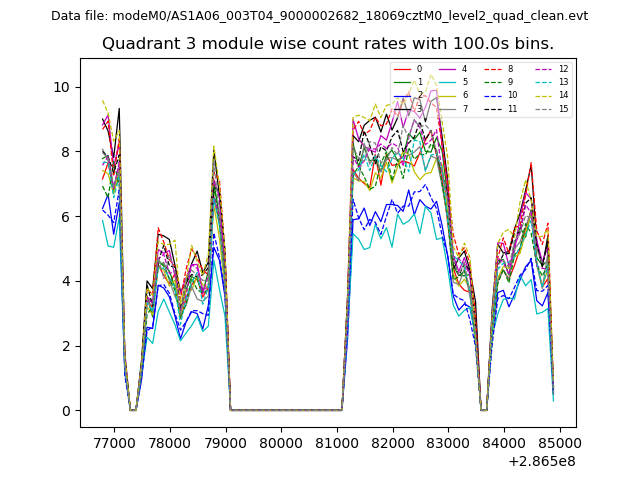
| Module-wise count rates for Quadrant A Data is divided into 100 sec bins |
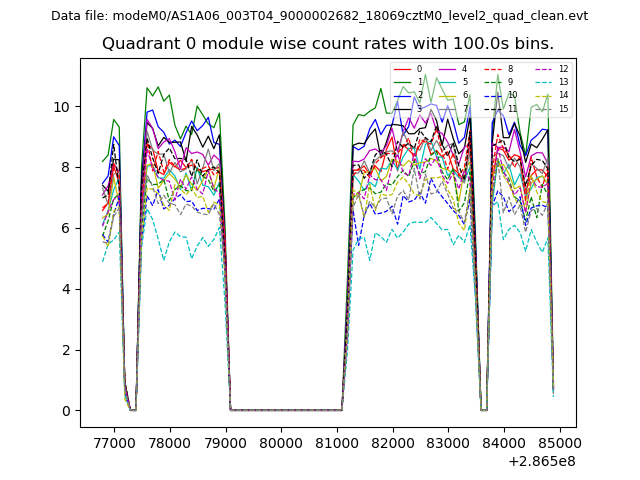 |
 |
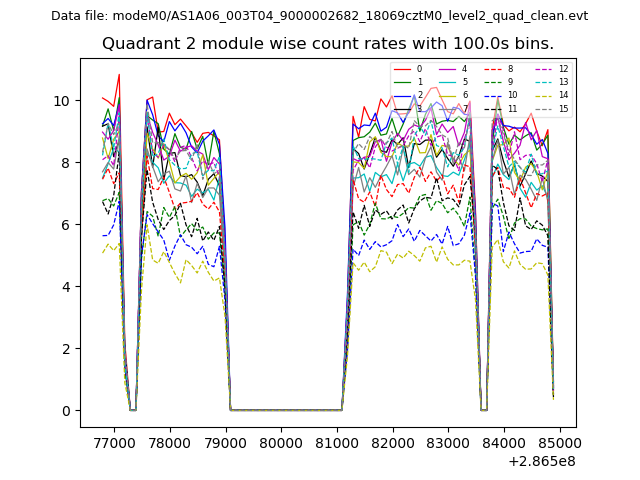
| Module-wise count rates for Quadrant B Data is divided into 100 sec bins |
 |
 |
| Module-wise count rates for Quadrant C Data is divided into 100 sec bins |
 |
 |
| Module-wise count rates for Quadrant D Data is divided into 100 sec bins |
 |
 |
| Parameter | Plot |
|---|---|
| CZT HV Monitor | 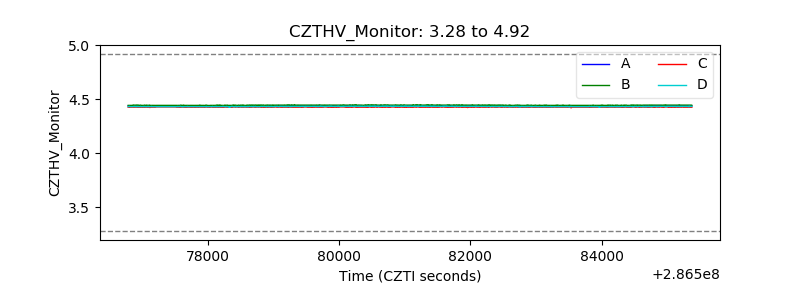 |
| D_VDD |  |
| Temperature 1 | 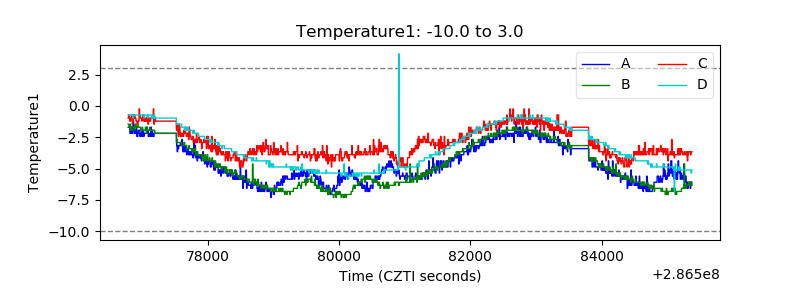 |
| Veto HV Monitor | 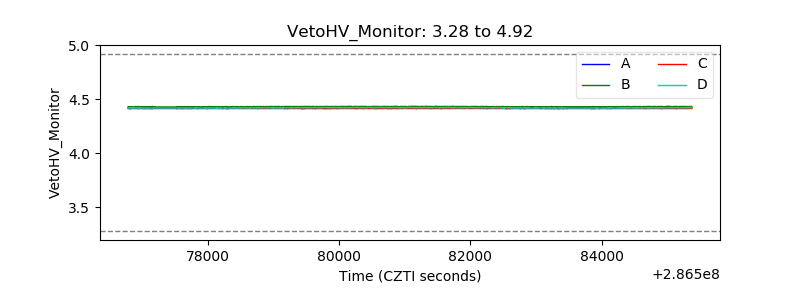 |
| Veto LLD | 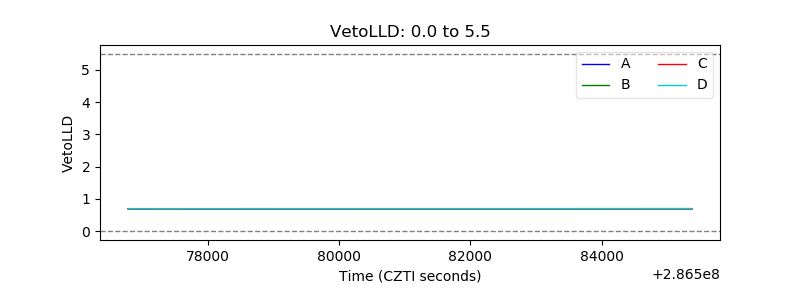 |
| Alpha Counter | 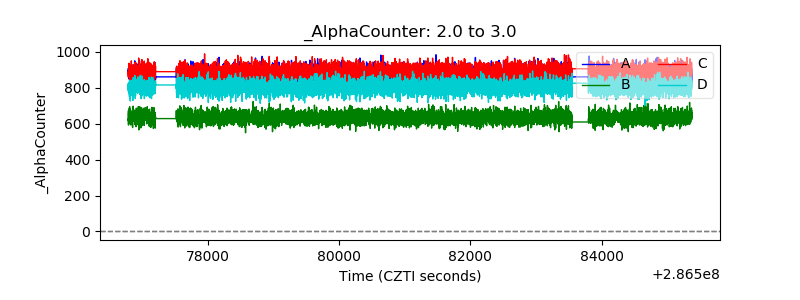 |
| _CPM_Rate | 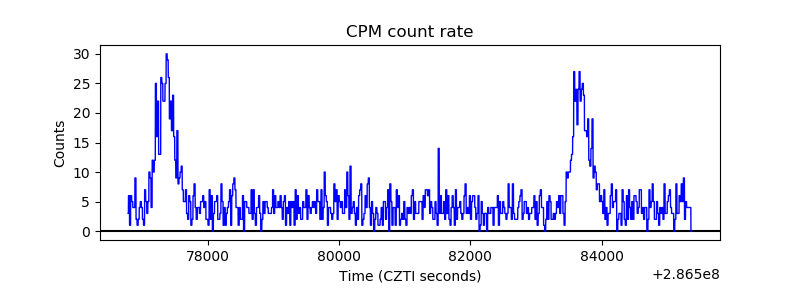 |
| CZT Counter | 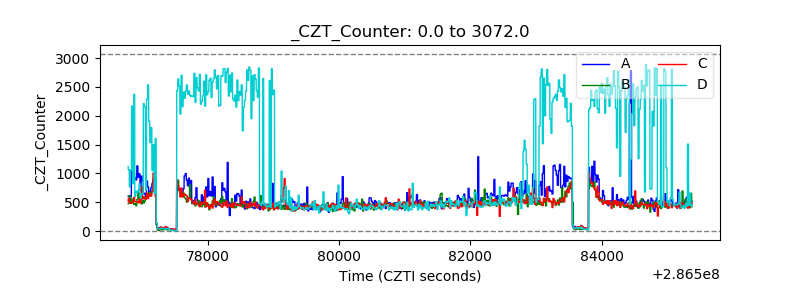 |
| +2.5 Volts monitor |  |
| +5 Volts monitor |  |
| _ROLL_ROT | 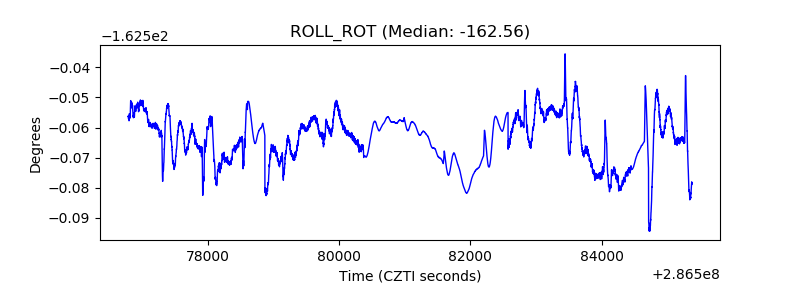 |
| _Roll_DEC | 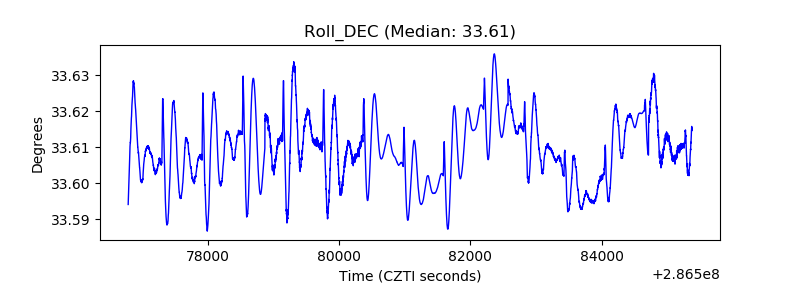 |
| _Roll_RA | 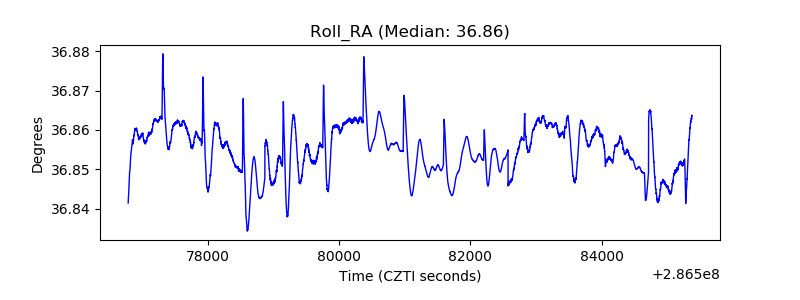 |
| Veto Counter | 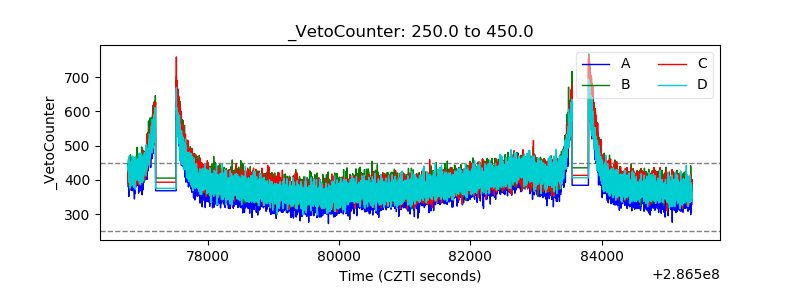 |