| Param | Original file | Final file |
|---|---|---|
| Filename | modeM0/AS1A06_003T04_9000002682_18070cztM0_level2.evt | modeM0/AS1A06_003T04_9000002682_18070cztM0_level2_quad_clean.evt |
| Size (bytes) | 650,897,280 | 81,037,440 |
| Size | 620.7 MB | 77.3 MB |
| Events in quadrant A | 4,712,403 | 512,920 |
| Events in quadrant B | 3,422,658 | 528,299 |
| Events in quadrant C | 3,435,960 | 502,356 |
| Events in quadrant D | 7,642,872 | 397,521 |
| Mode SS | |||
|---|---|---|---|
| Quadrant | BADHDUFLAG | Total packets | Discarded packets |
| A | 0 | 150 | 0 |
| B | 0 | 150 | 0 |
| C | 0 | 150 | 0 |
| D | 0 | 150 | 0 |
| Mode M0 | |||
|---|---|---|---|
| Quadrant | BADHDUFLAG | Total packets | Discarded packets |
| A | 0 | 18703 | 1 |
| B | 0 | 14963 | 1 |
| C | 0 | 14937 | 1 |
| D | 0 | 27696 | 1 |
| Mode M9 | |||
|---|---|---|---|
| Quadrant | BADHDUFLAG | Total packets | Discarded packets |
| A | 0 | 5 | 0 |
| B | 0 | 5 | 0 |
| C | 0 | 5 | 0 |
| D | 0 | 5 | 0 |
| Quadrant | Total seconds | Saturated seconds | Saturation percentage |
|---|---|---|---|
| A | 7350 | 508 | 6.911565% |
| B | 7351 | 54 | 0.734594% |
| C | 7351 | 61 | 0.829819% |
| D | 7351 | 1666 | 22.663583% |
Noise dominated data is calculated using 1-second bins in cleaned event files. If a bin has >2000 counts, and if more than 50% of those come from <1% of pixels, then it is considered to be noise-dominated and hence unusable.
| Quadrant | # 1 sec bins | Bins with >0 counts | Bins with >2000 counts | High rate bins dominated by noise | Noise dominated (total time) | Noise dominated (detector-on time) | Marked lightcurve |
|---|---|---|---|---|---|---|---|
| A | 7825 | 7351 | 65 | 65 | 0.83% | 0.88% | 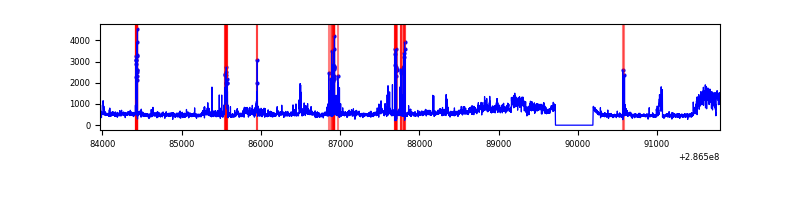 |
| B | 7826 | 7352 | 0 | 0 | 0.00% | 0.00% | 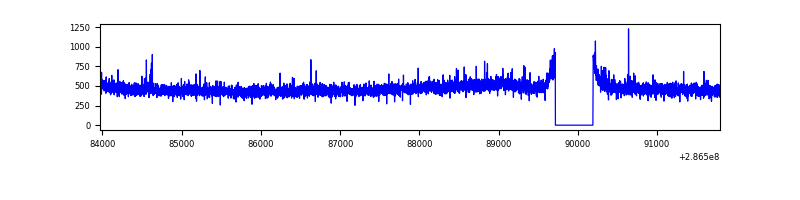 |
| C | 7826 | 7352 | 0 | 0 | 0.00% | 0.00% | 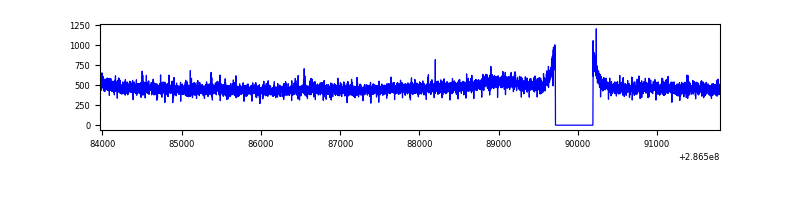 |
| D | 7826 | 7351 | 1522 | 1522 | 19.45% | 20.70% | 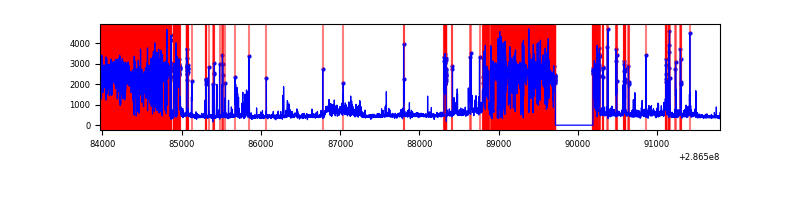 |
Top three noisy pixels from each quadrant. If the there are fewer than three noisy pixels in the level2.evt file, extra rows are filled as -1
| Pixel properties | Quadrant properties | ||||||
|---|---|---|---|---|---|---|---|
| Quadrant | DetID | PixID | Counts | Sigma | Mean | Median | Sigma |
| A | 14 | 111 | 1052874 | 5993.37 | 855 | 837 | 175.5 |
| A | 15 | 174 | 330122 | 1875.91 | 855 | 837 | 175.5 |
| A | 4 | 2 | 43752 | 244.48 | 855 | 837 | 175.5 |
| B | 12 | 111 | 20420 | 116.06 | 868 | 845 | 168.7 |
| B | 11 | 111 | 17889 | 101.05 | 868 | 845 | 168.7 |
| B | 14 | 111 | 14909 | 83.38 | 868 | 845 | 168.7 |
| C | 14 | 238 | 127583 | 641.31 | 836 | 840 | 197.6 |
| C | 3 | 233 | 20314 | 98.54 | 836 | 840 | 197.6 |
| C | 8 | 128 | 13475 | 63.93 | 836 | 840 | 197.6 |
| D | 7 | 238 | 4137461 | 22532.75 | 752 | 731 | 183.6 |
| D | 5 | 222 | 396866 | 2157.75 | 752 | 731 | 183.6 |
| D | 11 | 176 | 154009 | 834.9 | 752 | 731 | 183.6 |
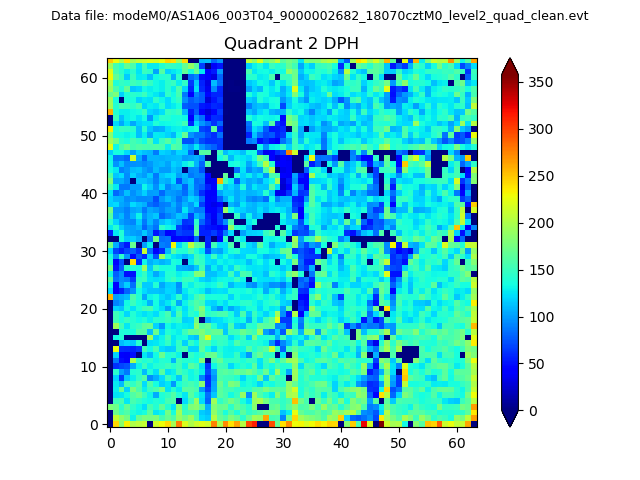
Histogram calculated using DETX and DETY for each event in the final _common_clean file
| Quadrant A | 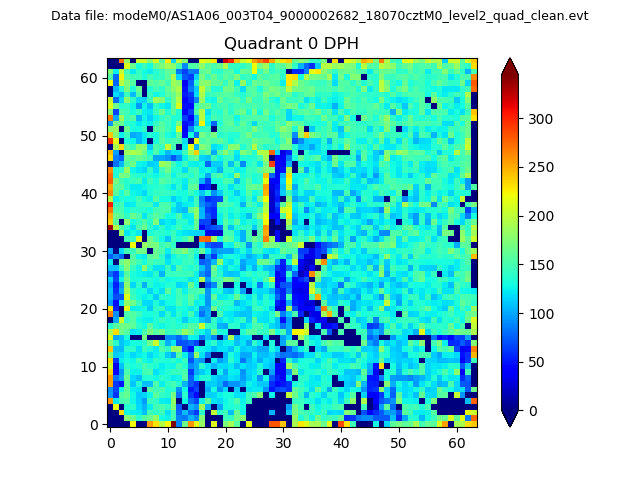 |
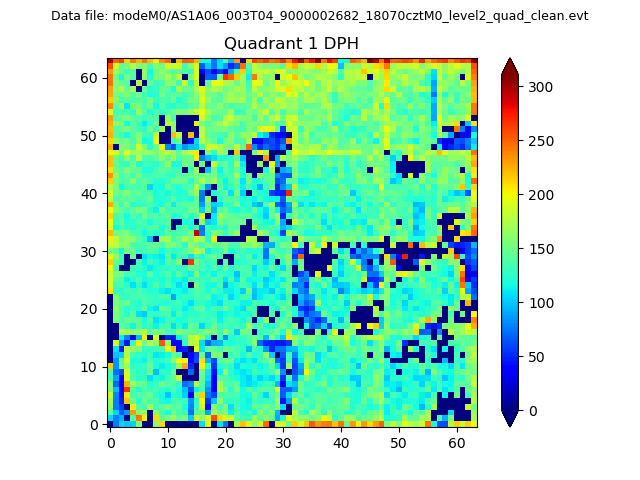 |
Quadrant B |
|---|---|---|---|
| Quadrant D | 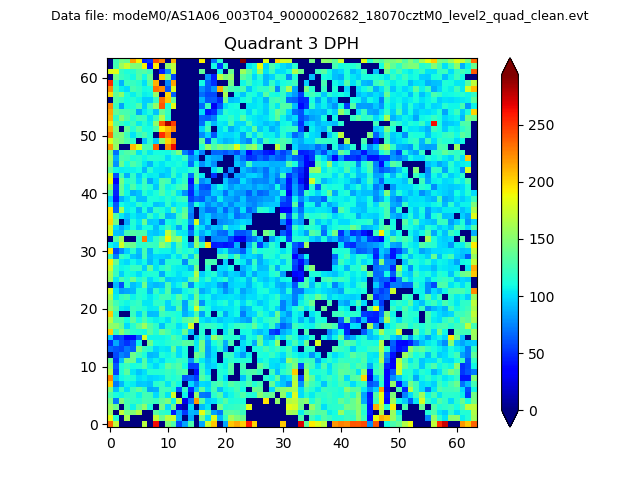 |
 |
Quadrant C |
| Plot type | Count rate plots | Images |
|---|---|---|
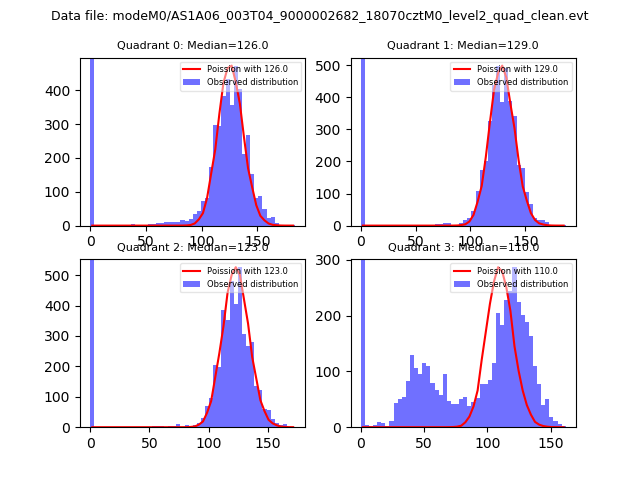
| Comparison with Poisson distribution Blue bars denote a histogram of data divided into 1 sec bins. Red curve is a Poisson curve with rate = median count rate of data. |
 |
 |
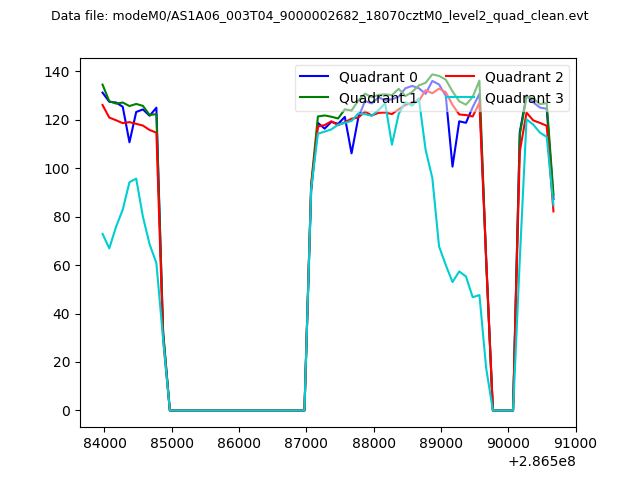
| Quadrant-wise count rates Data is divided into 100 sec bins |
 |
|
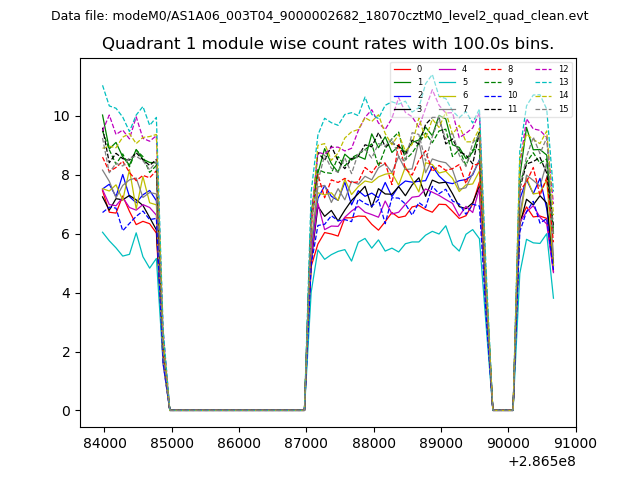
| Module-wise count rates for Quadrant A Data is divided into 100 sec bins |
 |
 |
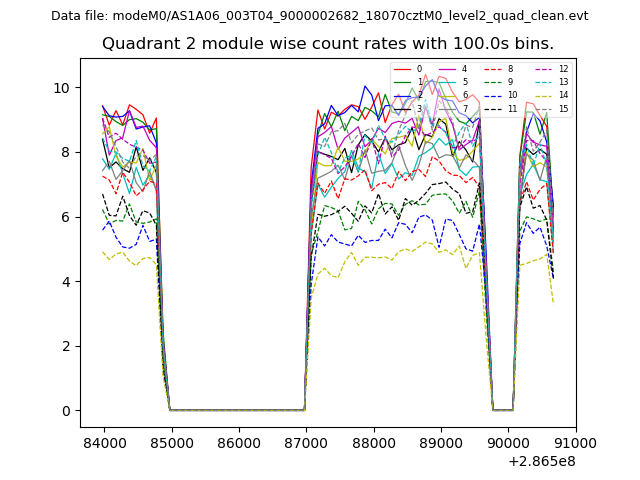
| Module-wise count rates for Quadrant B Data is divided into 100 sec bins |
 |
 |
| Module-wise count rates for Quadrant C Data is divided into 100 sec bins |
 |
 |
| Module-wise count rates for Quadrant D Data is divided into 100 sec bins |
 |
 |
| Parameter | Plot |
|---|---|
| CZT HV Monitor |  |
| D_VDD | 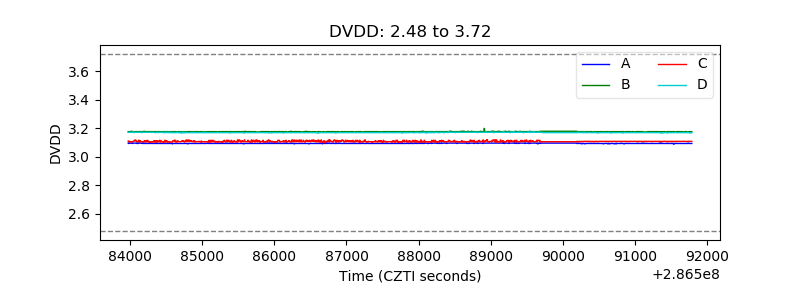 |
| Temperature 1 | 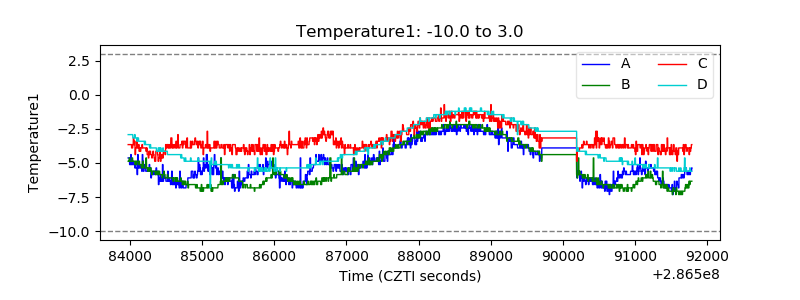 |
| Veto HV Monitor | 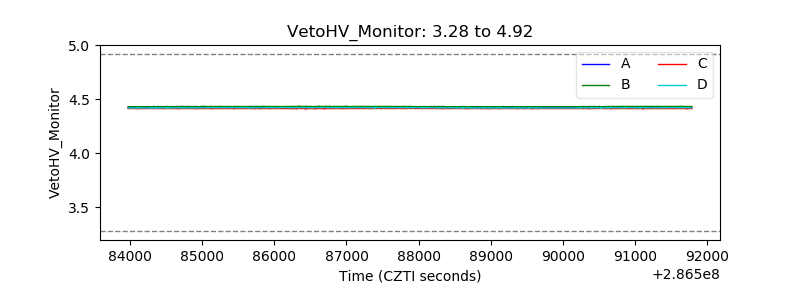 |
| Veto LLD |  |
| Alpha Counter | 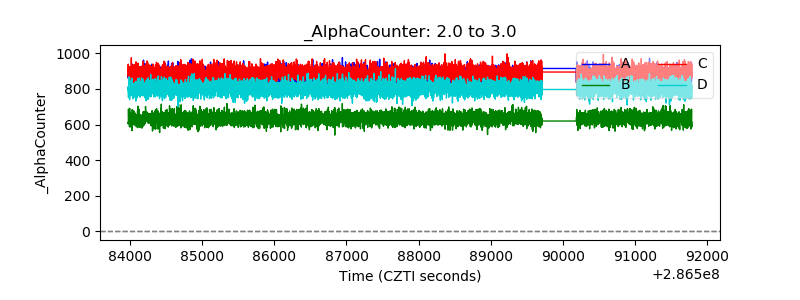 |
| _CPM_Rate | 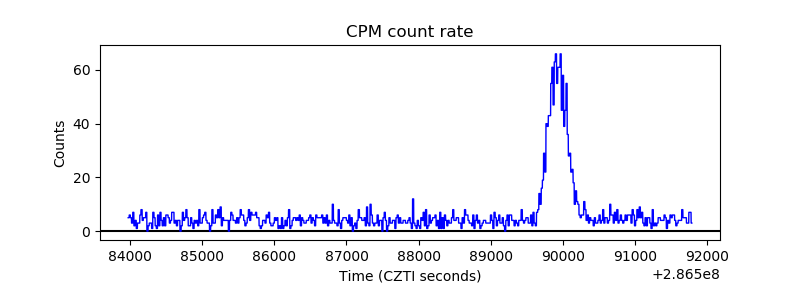 |
| CZT Counter | 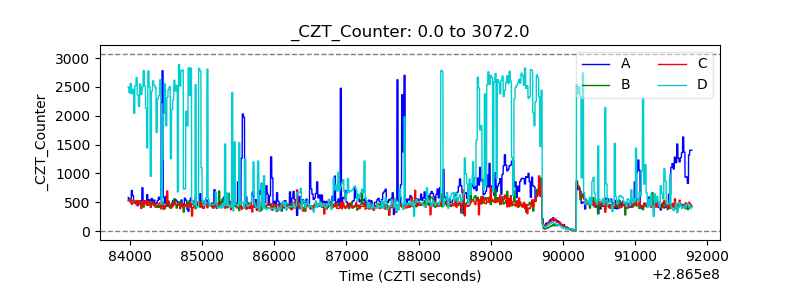 |
| +2.5 Volts monitor |  |
| +5 Volts monitor |  |
| _ROLL_ROT |  |
| _Roll_DEC | 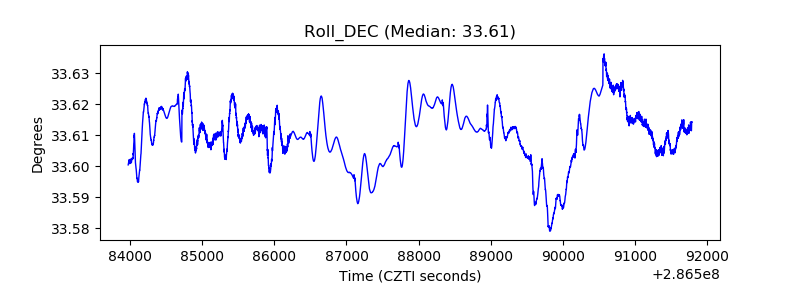 |
| _Roll_RA | 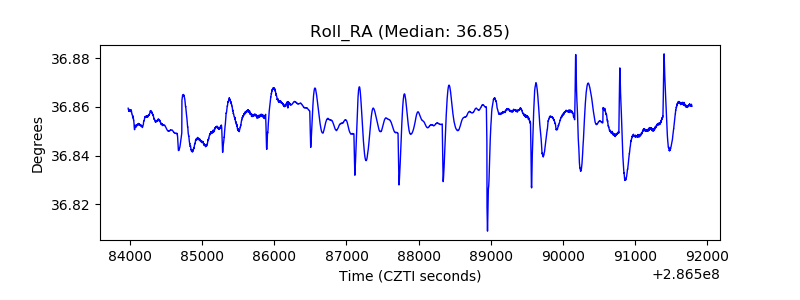 |
| Veto Counter | 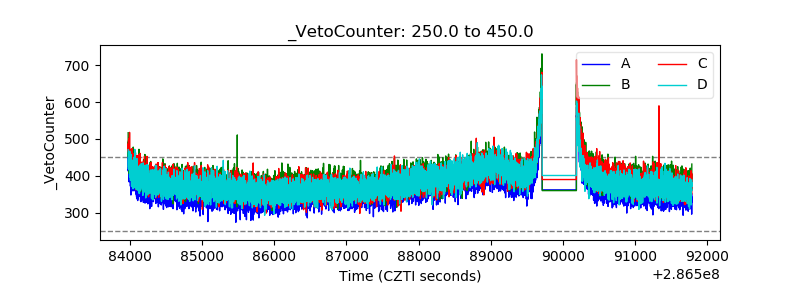 |