| Param | Original file | Final file |
|---|---|---|
| Filename | modeM0/AS1A06_003T04_9000002682_18072cztM0_level2.evt | modeM0/AS1A06_003T04_9000002682_18072cztM0_level2_quad_clean.evt |
| Size (bytes) | 169,632,000 | 16,346,880 |
| Size | 161.8 MB | 15.6 MB |
| Events in quadrant A | 1,353,132 | 92,530 |
| Events in quadrant B | 990,273 | 93,894 |
| Events in quadrant C | 995,739 | 88,233 |
| Events in quadrant D | 1,654,539 | 68,781 |
| Mode SS | |||
|---|---|---|---|
| Quadrant | BADHDUFLAG | Total packets | Discarded packets |
| A | 0 | 44 | 0 |
| B | 0 | 44 | 0 |
| C | 0 | 44 | 0 |
| D | 0 | 44 | 0 |
| Mode M0 | |||
|---|---|---|---|
| Quadrant | BADHDUFLAG | Total packets | Discarded packets |
| A | 0 | 5431 | 1 |
| B | 0 | 4325 | 1 |
| C | 0 | 4314 | 1 |
| D | 0 | 6322 | 1 |
| Mode M9 | |||
|---|---|---|---|
| Quadrant | BADHDUFLAG | Total packets | Discarded packets |
| A | 0 | 5 | 0 |
| B | 0 | 5 | 0 |
| C | 0 | 5 | 0 |
| D | 0 | 5 | 0 |
| Quadrant | Total seconds | Saturated seconds | Saturation percentage |
|---|---|---|---|
| A | 2074 | 193 | 9.305689% |
| B | 2075 | 49 | 2.361446% |
| C | 2075 | 50 | 2.409639% |
| D | 2075 | 269 | 12.963855% |
Noise dominated data is calculated using 1-second bins in cleaned event files. If a bin has >2000 counts, and if more than 50% of those come from <1% of pixels, then it is considered to be noise-dominated and hence unusable.
| Quadrant | # 1 sec bins | Bins with >0 counts | Bins with >2000 counts | High rate bins dominated by noise | Noise dominated (total time) | Noise dominated (detector-on time) | Marked lightcurve |
|---|---|---|---|---|---|---|---|
| A | 2549 | 2075 | 2 | 2 | 0.08% | 0.10% | 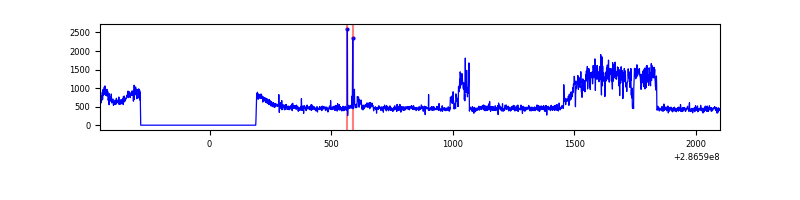 |
| B | 2550 | 2076 | 0 | 0 | 0.00% | 0.00% | 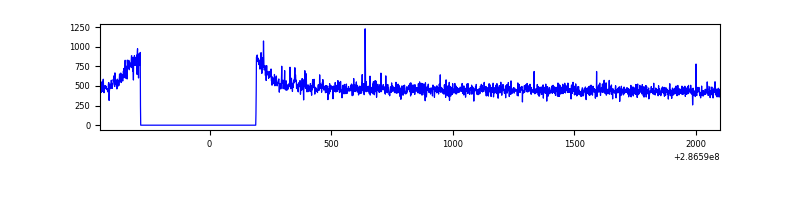 |
| C | 2550 | 2076 | 0 | 0 | 0.00% | 0.00% | 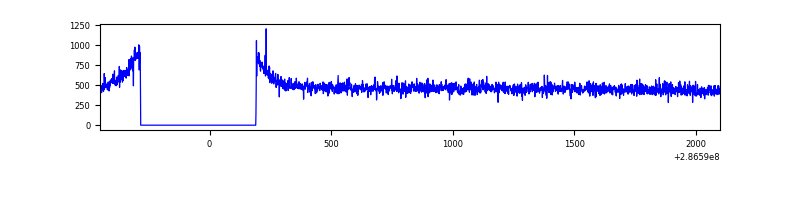 |
| D | 2550 | 2075 | 228 | 228 | 8.94% | 10.99% | 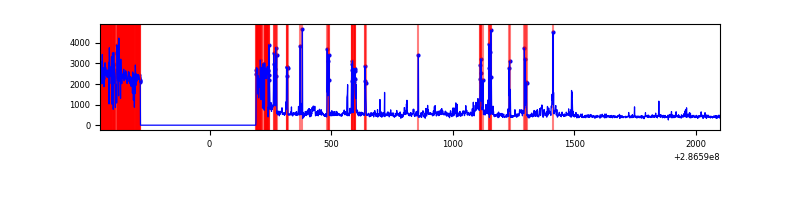 |
Top three noisy pixels from each quadrant. If the there are fewer than three noisy pixels in the level2.evt file, extra rows are filled as -1
| Pixel properties | Quadrant properties | ||||||
|---|---|---|---|---|---|---|---|
| Quadrant | DetID | PixID | Counts | Sigma | Mean | Median | Sigma |
| A | 14 | 111 | 357707 | 6930.18 | 245 | 240 | 51.6 |
| A | 15 | 174 | 47099 | 908.45 | 245 | 240 | 51.6 |
| A | 4 | 2 | 3129 | 56.01 | 245 | 240 | 51.6 |
| B | 12 | 111 | 6040 | 112.61 | 251 | 243 | 51.5 |
| B | 11 | 111 | 5300 | 98.23 | 251 | 243 | 51.5 |
| B | 0 | 230 | 5037 | 93.12 | 251 | 243 | 51.5 |
| C | 14 | 238 | 36944 | 617.1 | 244 | 245 | 59.5 |
| C | 3 | 233 | 2960 | 45.65 | 244 | 245 | 59.5 |
| C | 9 | 160 | 1918 | 28.13 | 244 | 245 | 59.5 |
| D | 7 | 238 | 694018 | 12412.49 | 221 | 215 | 55.9 |
| D | 5 | 222 | 57323 | 1021.69 | 221 | 215 | 55.9 |
| D | 11 | 176 | 45938 | 818.01 | 221 | 215 | 55.9 |
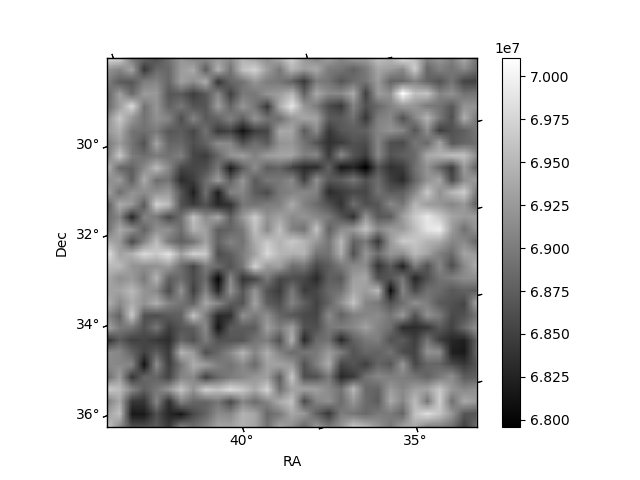
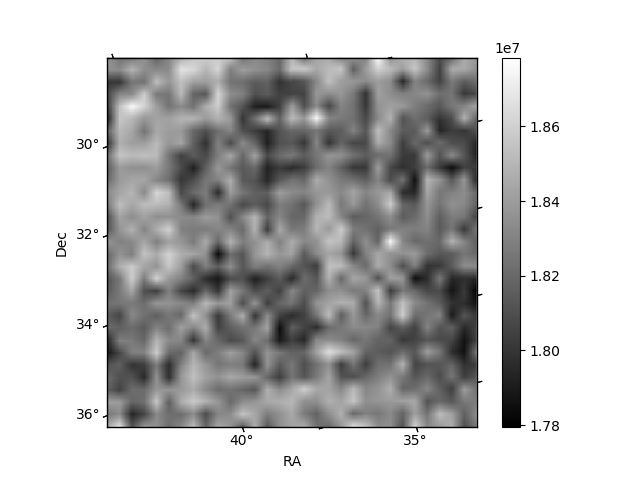
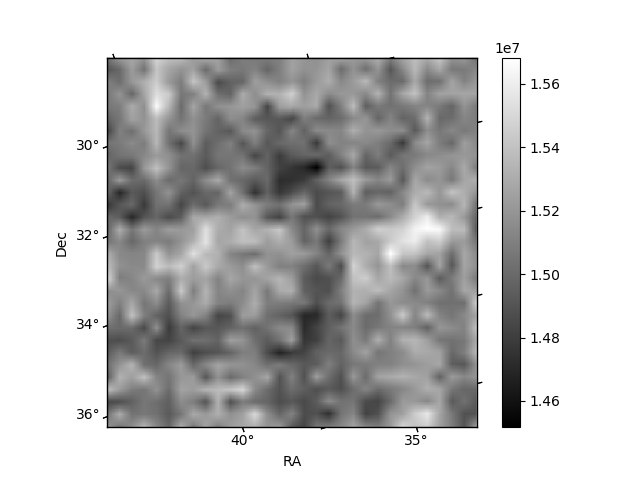
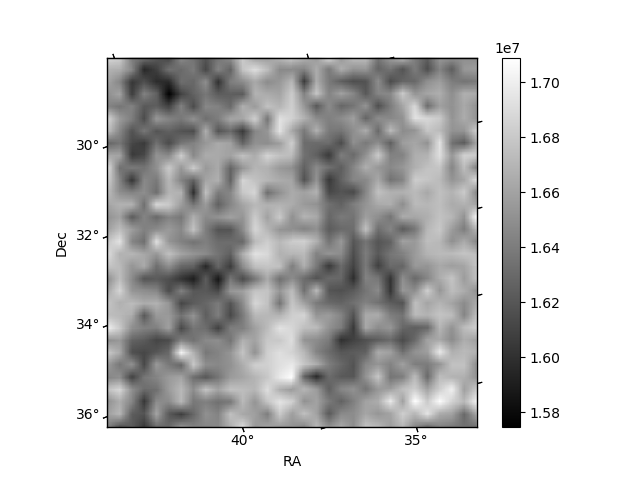
Histogram calculated using DETX and DETY for each event in the final _common_clean file
| Quadrant A | 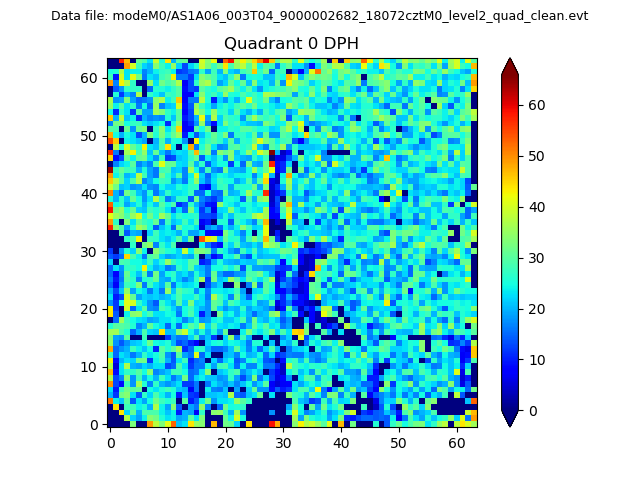 |
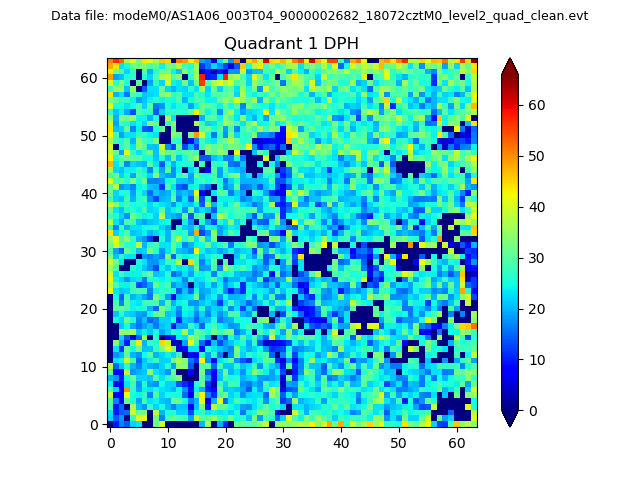 |
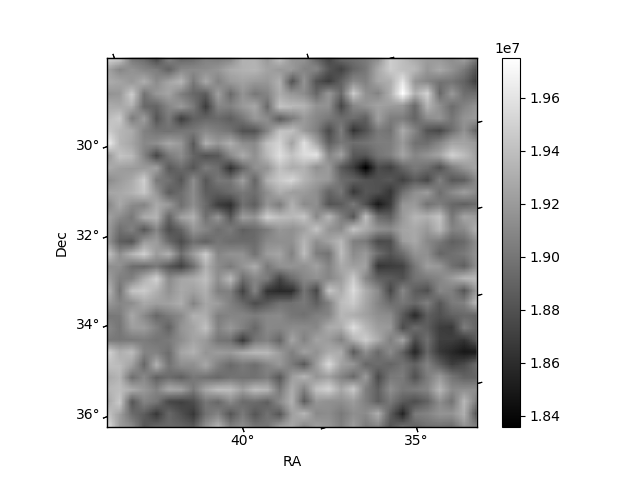
Quadrant B |
|---|---|---|---|
| Quadrant D | 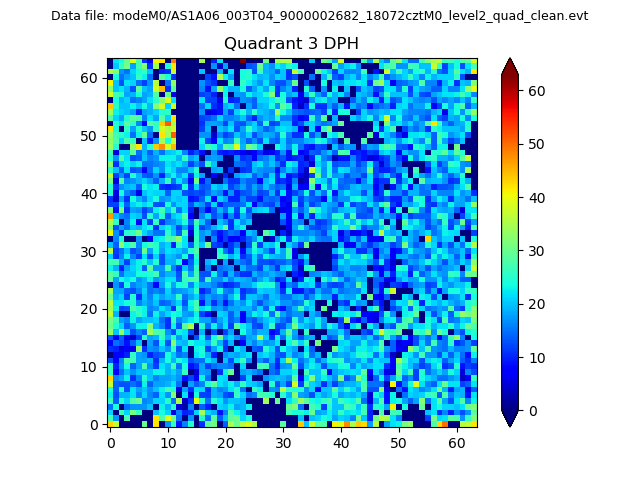 |
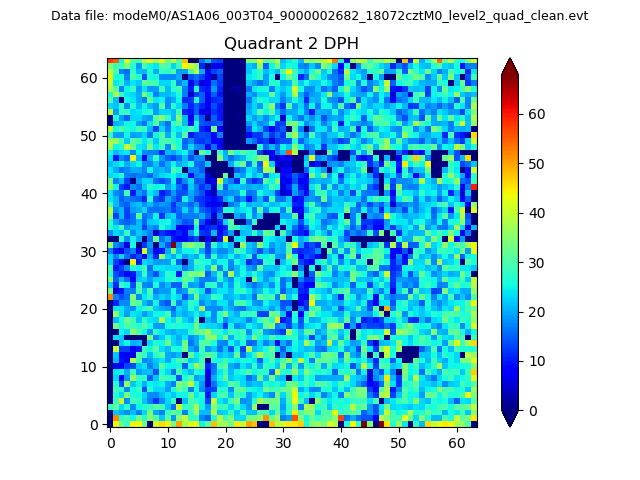 |
Quadrant C |
| Plot type | Count rate plots | Images |
|---|---|---|
| Comparison with Poisson distribution Blue bars denote a histogram of data divided into 1 sec bins. Red curve is a Poisson curve with rate = median count rate of data. |
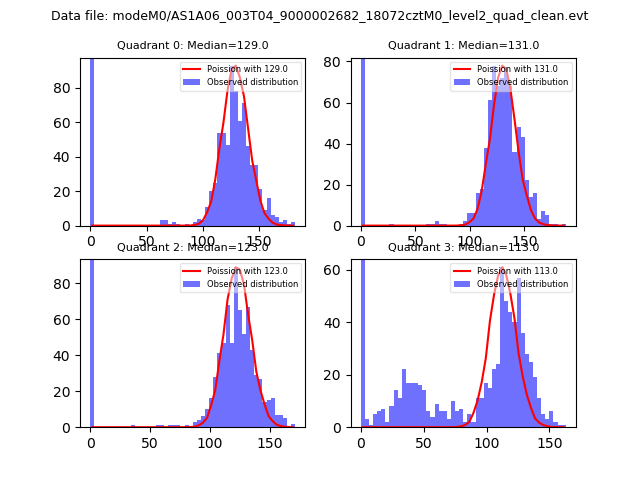 |
 |
| Quadrant-wise count rates Data is divided into 100 sec bins |
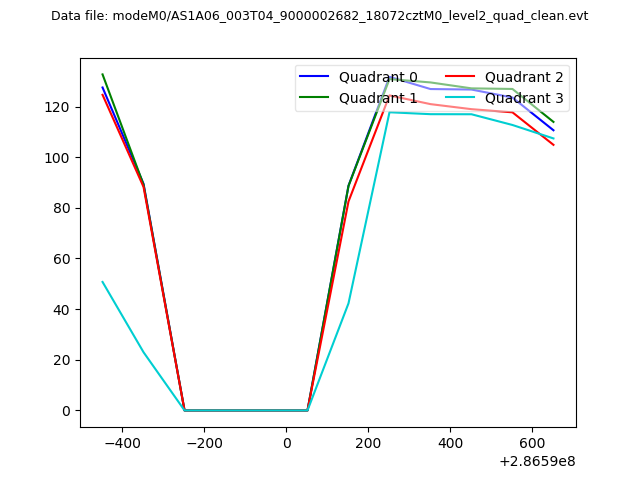 |
|
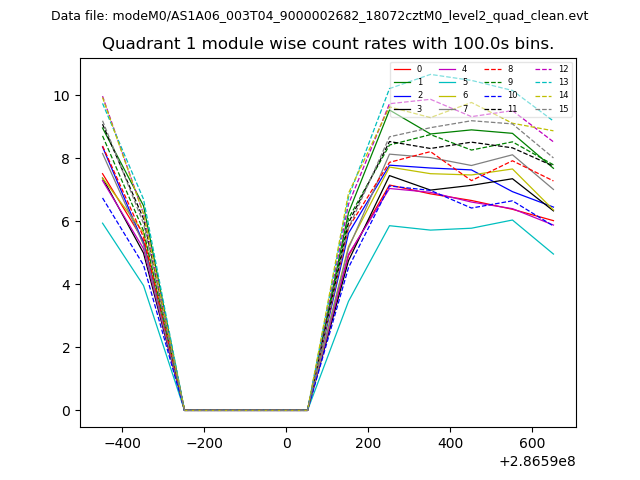
| Module-wise count rates for Quadrant A Data is divided into 100 sec bins |
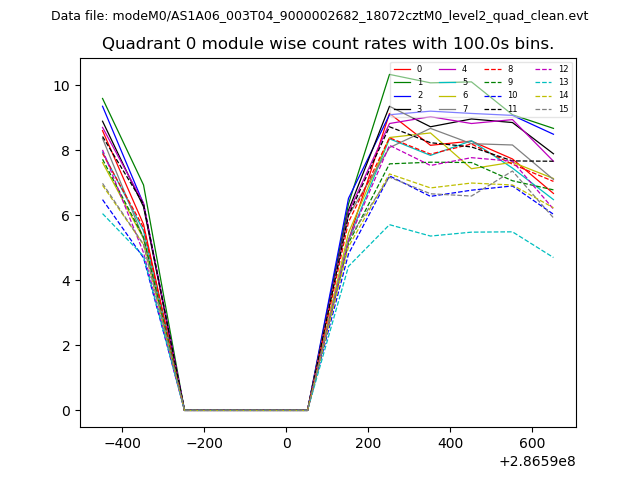 |
 |
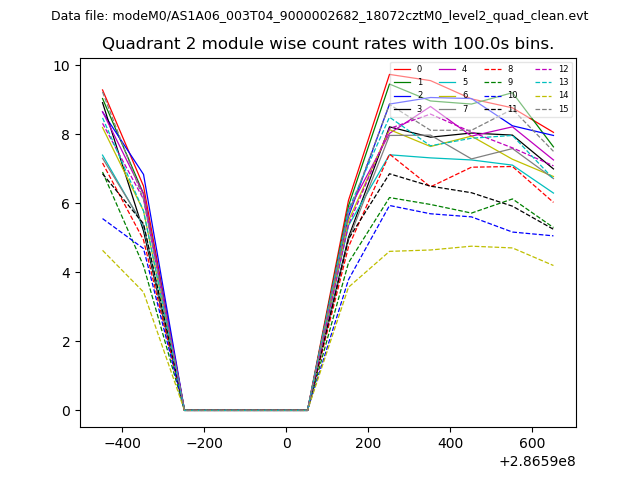
| Module-wise count rates for Quadrant B Data is divided into 100 sec bins |
 |
 |
| Module-wise count rates for Quadrant C Data is divided into 100 sec bins |
 |
 |
| Module-wise count rates for Quadrant D Data is divided into 100 sec bins |
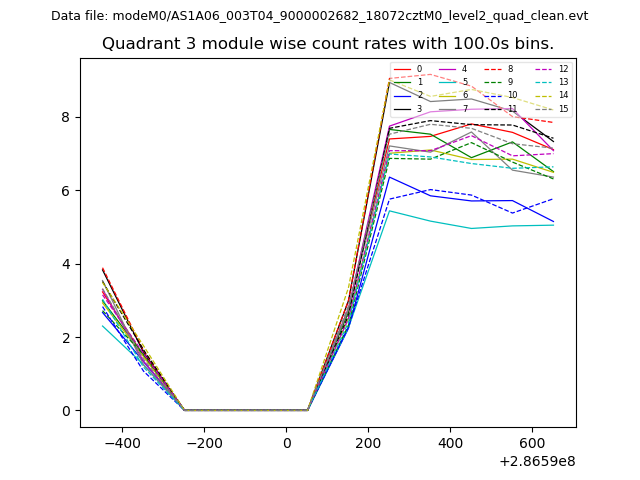 |
 |
| Parameter | Plot |
|---|---|
| CZT HV Monitor | 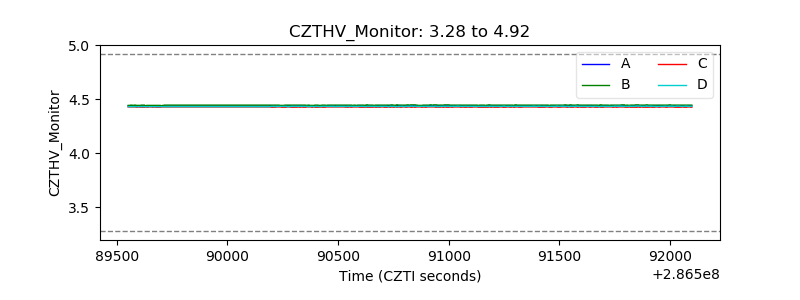 |
| D_VDD | 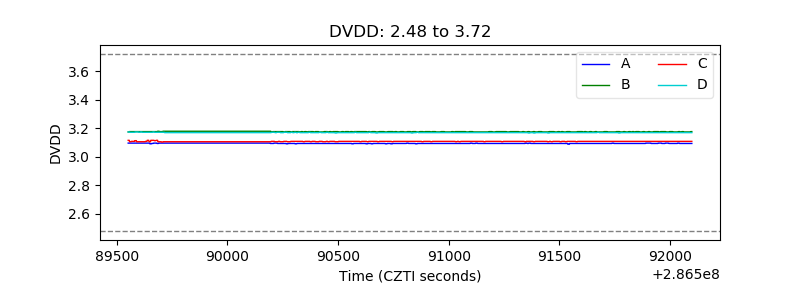 |
| Temperature 1 | 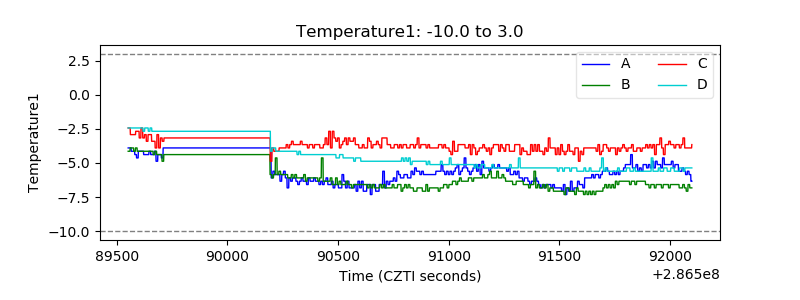 |
| Veto HV Monitor | 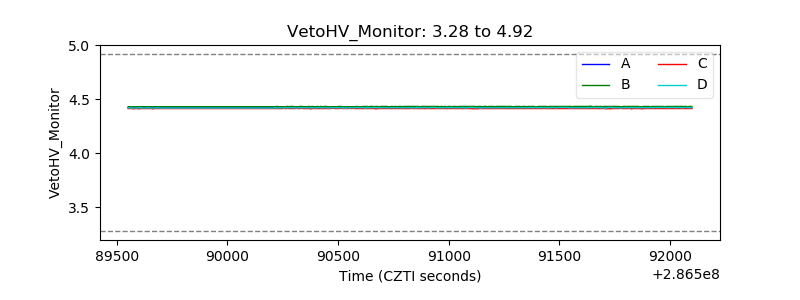 |
| Veto LLD | 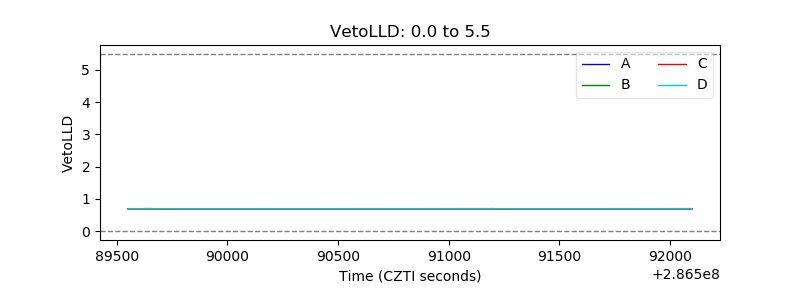 |
| Alpha Counter | 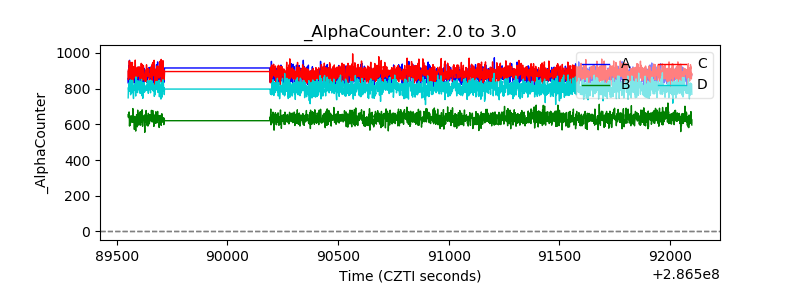 |
| _CPM_Rate | 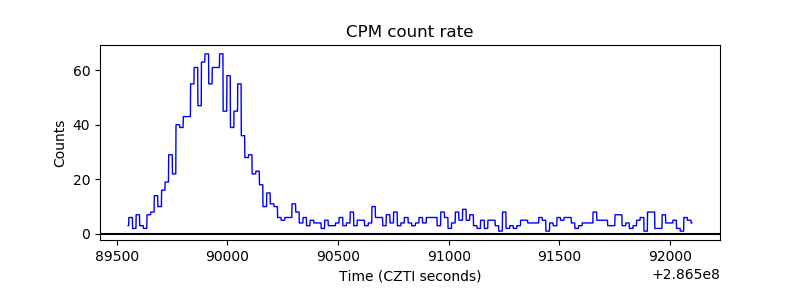 |
| CZT Counter | 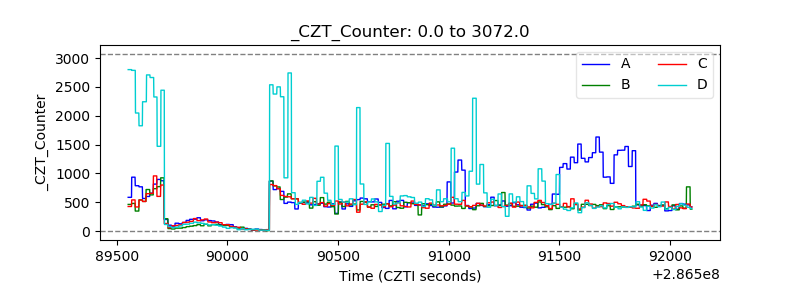 |
| +2.5 Volts monitor | 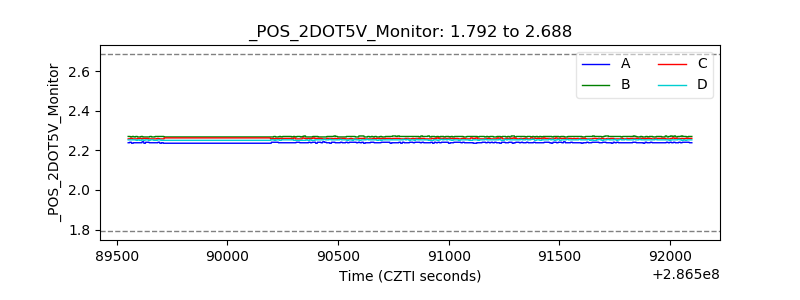 |
| +5 Volts monitor | 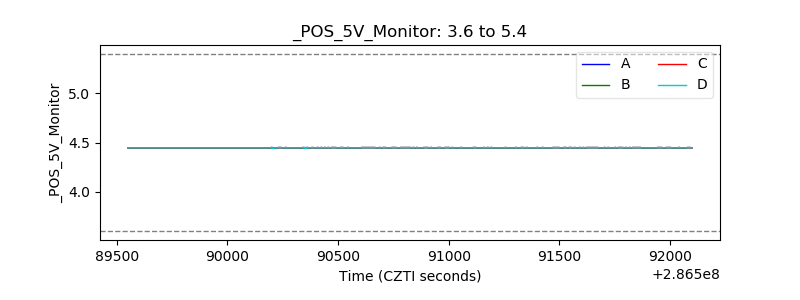 |
| _ROLL_ROT | 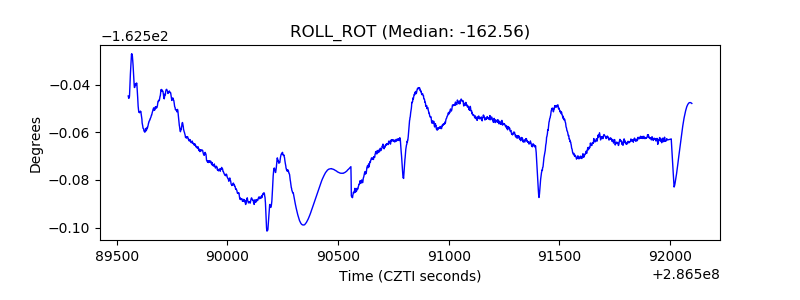 |
| _Roll_DEC | 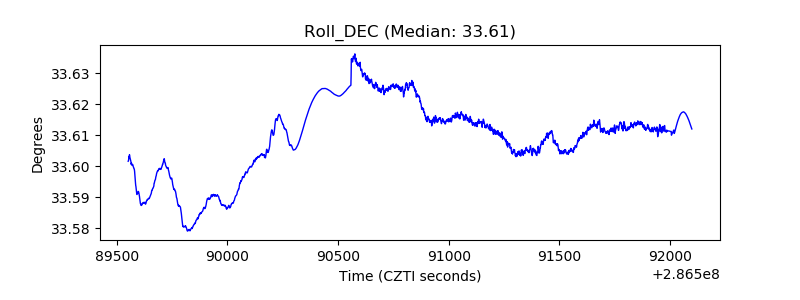 |
| _Roll_RA | 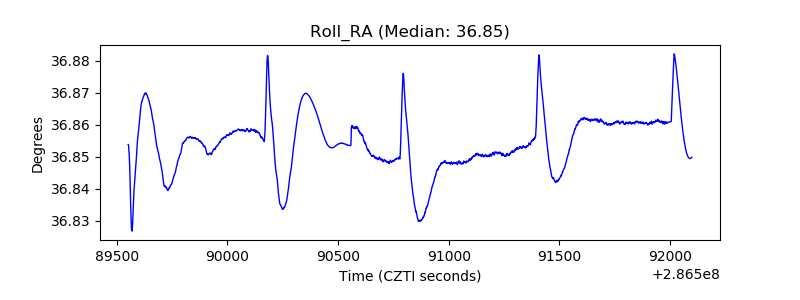 |
| Veto Counter | 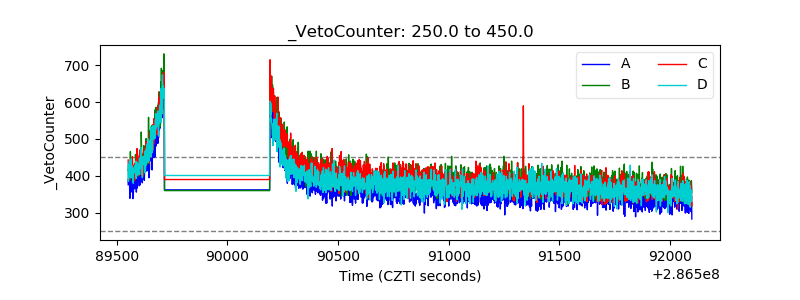 |