| Param | Original file | Final file |
|---|---|---|
| Filename | modeM0/AS1A06_006T01_9000002684cztM0_level2.fits | modeM0/AS1A06_006T01_9000002684cztM0_level2_quad_clean.evt |
| Size (bytes) | 716,351,040 | 649,995,840 |
| Size | 683.2 MB | 619.9 MB |
| Events in quadrant A | 4,391,518 | 3,743,600 |
| Events in quadrant B | 4,272,526 | 3,887,059 |
| Events in quadrant C | 4,314,956 | 3,727,747 |
| Events in quadrant D | 3,667,044 | 3,281,384 |
| Mode SS | |||
|---|---|---|---|
| Quadrant | BADHDUFLAG | Total packets | Discarded packets |
| A | 0 | 1502 | 0 |
| B | 0 | 1502 | 0 |
| C | 0 | 1502 | 0 |
| D | 0 | 1502 | 0 |
| Mode M9 | |||
|---|---|---|---|
| Quadrant | BADHDUFLAG | Total packets | Discarded packets |
| A | 0 | 121 | 0 |
| B | 0 | 121 | 0 |
| C | 0 | 121 | 0 |
| D | 0 | 121 | 0 |
| Mode M0 | |||
|---|---|---|---|
| Quadrant | BADHDUFLAG | Total packets | Discarded packets |
| A | 0 | 187513 | 0 |
| B | 0 | 158602 | 0 |
| C | 0 | 154110 | 0 |
| D | 0 | 231800 | 0 |
| Quadrant | Total seconds | Saturated seconds | Saturation percentage |
|---|---|---|---|
| A | 73561 | 5505 | 7.483585% |
| B | 73561 | 1102 | 1.498076% |
| C | 73561 | 1119 | 1.521186% |
| D | 73561 | 5884 | 7.998804% |
Noise dominated data is calculated using 1-second bins in cleaned event files. If a bin has >2000 counts, and if more than 50% of those come from <1% of pixels, then it is considered to be noise-dominated and hence unusable.
| Quadrant | # 1 sec bins | Bins with >0 counts | Bins with >2000 counts | High rate bins dominated by noise | Noise dominated (total time) | Noise dominated (detector-on time) | Marked lightcurve |
|---|---|---|---|---|---|---|---|
| A | 85636 | 73558 | 0 | 0 | 0.00% | 0.00% |  |
| B | 85636 | 73546 | 0 | 0 | 0.00% | 0.00% |  |
| C | 85636 | 73558 | 0 | 0 | 0.00% | 0.00% |  |
| D | 85635 | 73547 | 0 | 0 | 0.00% | 0.00% |  |
Top three noisy pixels from each quadrant. If the there are fewer than three noisy pixels in the level2.evt file, extra rows are filled as -1
| Pixel properties | Quadrant properties | ||||||
|---|---|---|---|---|---|---|---|
| Quadrant | DetID | PixID | Counts | Sigma | Mean | Median | Sigma |
| A | 0 | 29 | 4233 | 11.23 | 1144 | 1074 | 281.3 |
| A | 7 | 110 | 3641 | 9.12 | 1144 | 1074 | 281.3 |
| A | 9 | 19 | 3382 | 8.2 | 1144 | 1074 | 281.3 |
| B | 2 | 9 | 3414 | 10.45 | 1130 | 1079 | 223.4 |
| B | 2 | 8 | 2893 | 8.12 | 1130 | 1079 | 223.4 |
| B | 14 | 254 | 2743 | 7.45 | 1130 | 1079 | 223.4 |
| C | 1 | 81 | 3264 | 7.61 | 1138 | 1064 | 289.2 |
| C | 1 | 80 | 3228 | 7.48 | 1138 | 1064 | 289.2 |
| C | 12 | 241 | 3084 | 6.98 | 1138 | 1064 | 289.2 |
| D | 10 | 190 | 2736 | 6.36 | 1047 | 954 | 280.1 |
| D | 3 | 14 | 2707 | 6.26 | 1047 | 954 | 280.1 |
| D | 6 | 231 | 2600 | 5.88 | 1047 | 954 | 280.1 |
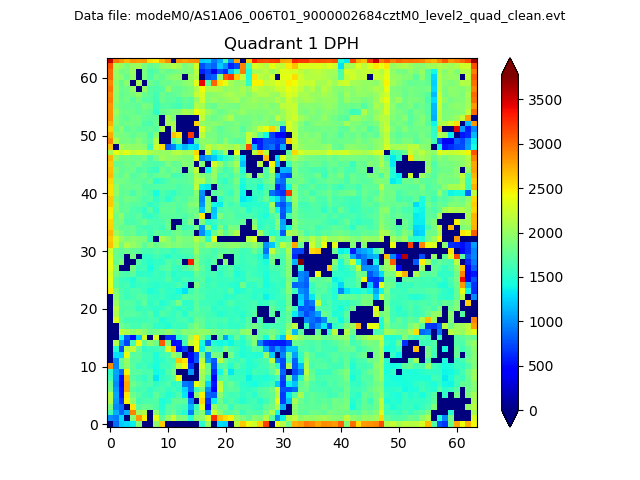
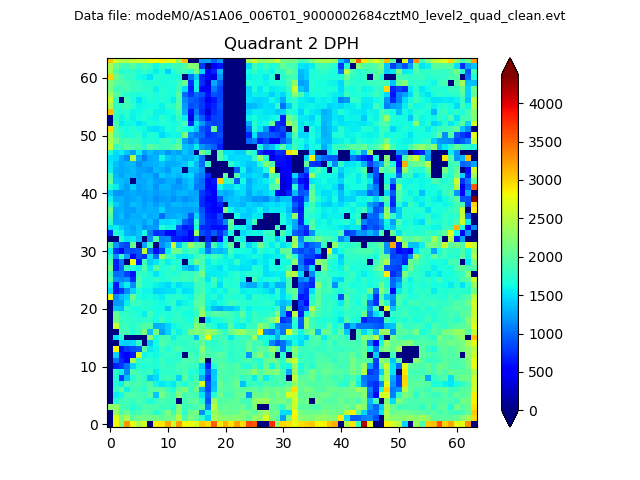
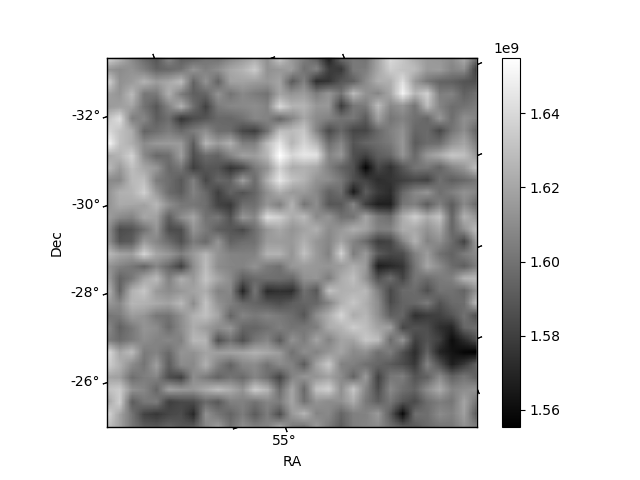
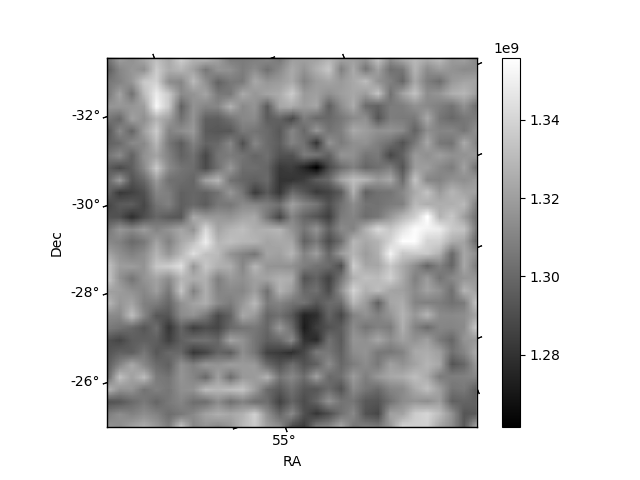
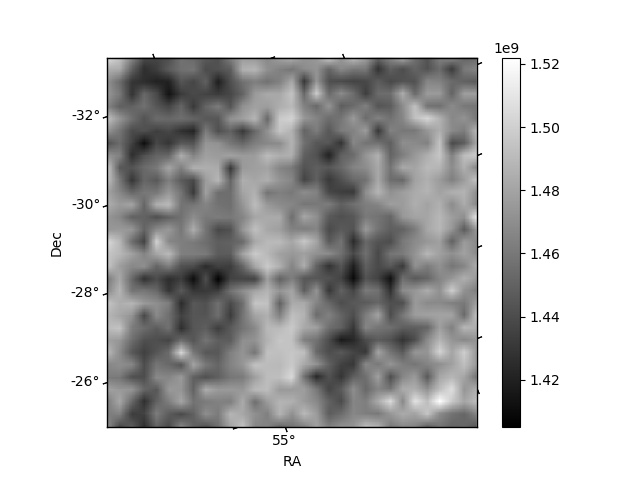
Histogram calculated using DETX and DETY for each event in the final _common_clean file
| Quadrant A |  |
 |
Quadrant B |
|---|---|---|---|
| Quadrant D | 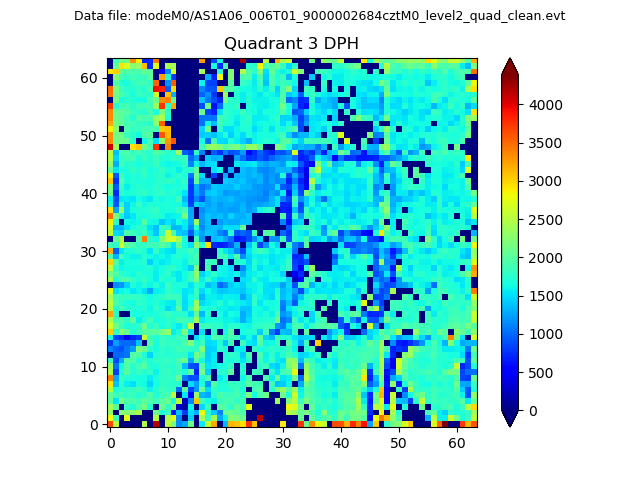 |
 |
Quadrant C |
| Plot type | Count rate plots | Images |
|---|---|---|
| Comparison with Poisson distribution Blue bars denote a histogram of data divided into 1 sec bins. Red curve is a Poisson curve with rate = median count rate of data. |
 |
 |
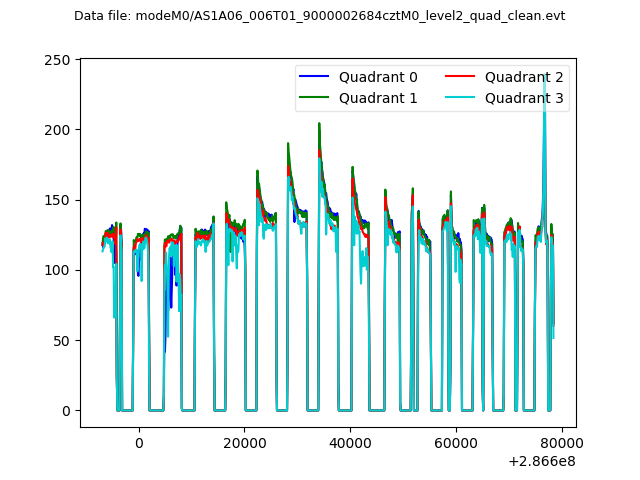
| Quadrant-wise count rates Data is divided into 100 sec bins |
 |
|
| Module-wise count rates for Quadrant A Data is divided into 100 sec bins |
 |
 |
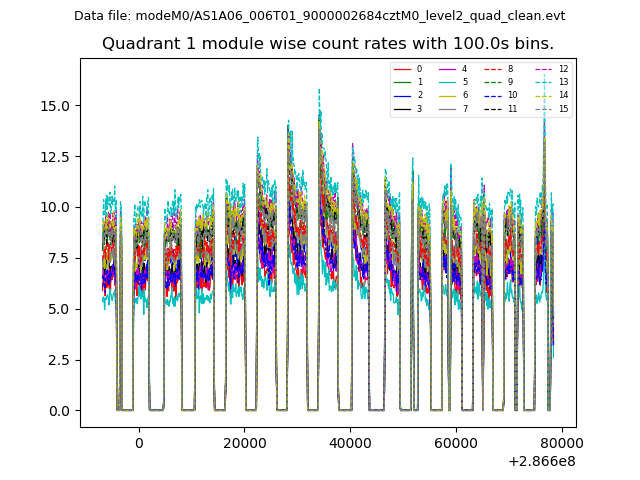
| Module-wise count rates for Quadrant B Data is divided into 100 sec bins |
 |
 |
| Module-wise count rates for Quadrant C Data is divided into 100 sec bins |
 |
 |
| Module-wise count rates for Quadrant D Data is divided into 100 sec bins |
 |
 |
| Parameter | Plot |
|---|---|
| CZT HV Monitor |  |
| D_VDD | 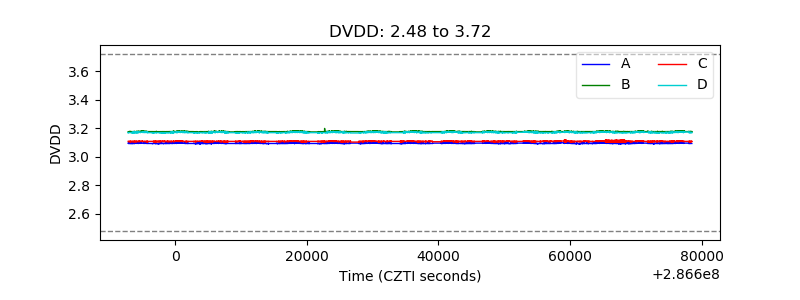 |
| Temperature 1 |  |
| Veto HV Monitor | 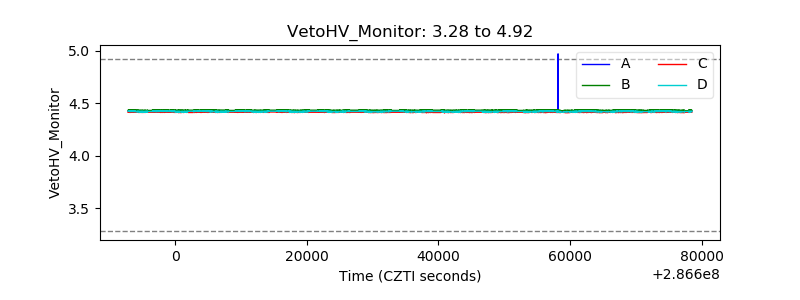 |
| Veto LLD | 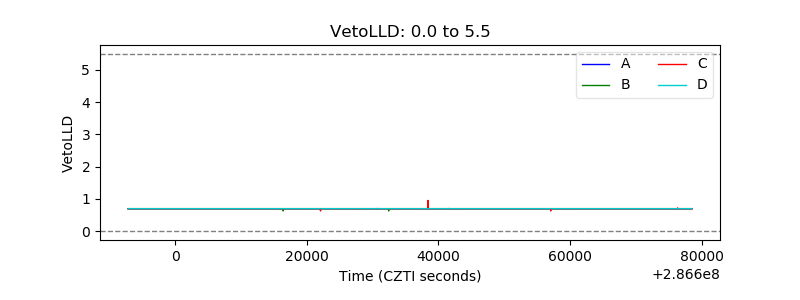 |
| Alpha Counter |  |
| _CPM_Rate |  |
| CZT Counter |  |
| +2.5 Volts monitor |  |
| +5 Volts monitor |  |
| _ROLL_ROT |  |
| _Roll_DEC |  |
| _Roll_RA | 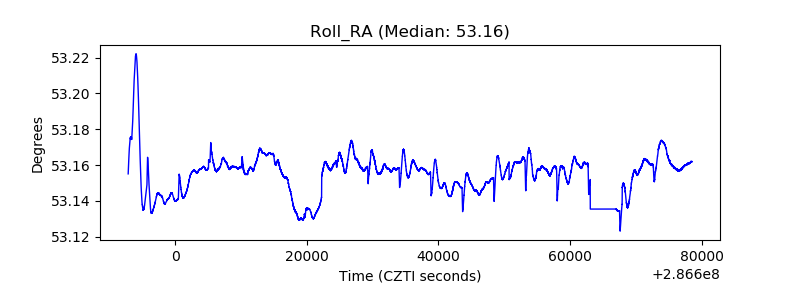 |
| Veto Counter |  |