| Param | Original file | Final file |
|---|---|---|
| Filename | modeM0/AS1A06_006T01_9000002684_18072cztM0_level2.evt | modeM0/AS1A06_006T01_9000002684_18072cztM0_level2_quad_clean.evt |
| Size (bytes) | 899,424,000 | 119,099,520 |
| Size | 857.8 MB | 113.6 MB |
| Events in quadrant A | 8,401,887 | 733,794 |
| Events in quadrant B | 4,765,633 | 760,851 |
| Events in quadrant C | 4,794,862 | 738,052 |
| Events in quadrant D | 8,604,251 | 684,096 |
| Mode SS | |||
|---|---|---|---|
| Quadrant | BADHDUFLAG | Total packets | Discarded packets |
| A | 0 | 204 | 0 |
| B | 0 | 204 | 0 |
| C | 0 | 204 | 0 |
| D | 0 | 204 | 0 |
| Mode M9 | |||
|---|---|---|---|
| Quadrant | BADHDUFLAG | Total packets | Discarded packets |
| A | 0 | 14 | 0 |
| B | 0 | 14 | 0 |
| C | 0 | 14 | 0 |
| D | 0 | 14 | 0 |
| Mode M0 | |||
|---|---|---|---|
| Quadrant | BADHDUFLAG | Total packets | Discarded packets |
| A | 0 | 31507 | 3 |
| B | 0 | 20454 | 2 |
| C | 0 | 20446 | 2 |
| D | 0 | 32310 | 2 |
| Quadrant | Total seconds | Saturated seconds | Saturation percentage |
|---|---|---|---|
| A | 9943 | 1443 | 14.512723% |
| B | 9943 | 116 | 1.166650% |
| C | 9943 | 145 | 1.458312% |
| D | 9943 | 1137 | 11.435181% |
Noise dominated data is calculated using 1-second bins in cleaned event files. If a bin has >2000 counts, and if more than 50% of those come from <1% of pixels, then it is considered to be noise-dominated and hence unusable.
| Quadrant | # 1 sec bins | Bins with >0 counts | Bins with >2000 counts | High rate bins dominated by noise | Noise dominated (total time) | Noise dominated (detector-on time) | Marked lightcurve |
|---|---|---|---|---|---|---|---|
| A | 11353 | 9945 | 294 | 294 | 2.59% | 2.96% | 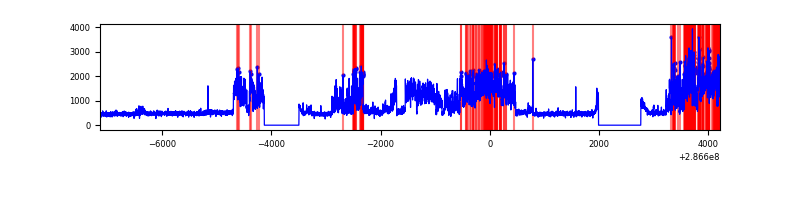 |
| B | 11353 | 9945 | 3 | 3 | 0.03% | 0.03% | 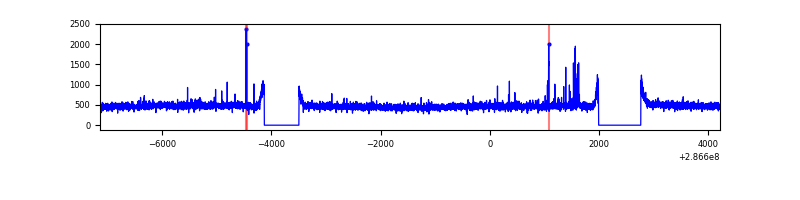 |
| C | 11353 | 9945 | 1 | 1 | 0.01% | 0.01% | 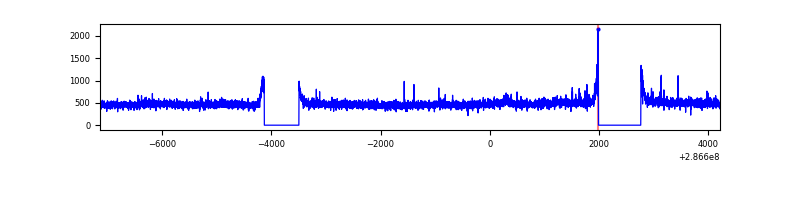 |
| D | 11353 | 9945 | 953 | 953 | 8.39% | 9.58% | 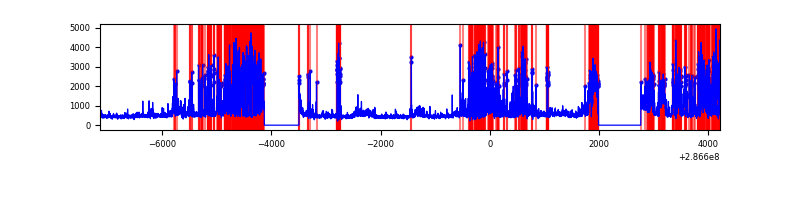 |
Top three noisy pixels from each quadrant. If the there are fewer than three noisy pixels in the level2.evt file, extra rows are filled as -1
| Pixel properties | Quadrant properties | ||||||
|---|---|---|---|---|---|---|---|
| Quadrant | DetID | PixID | Counts | Sigma | Mean | Median | Sigma |
| A | 14 | 111 | 3363578 | 14349.46 | 1161 | 1139 | 234.3 |
| A | 15 | 174 | 571909 | 2435.8 | 1161 | 1139 | 234.3 |
| A | 0 | 226 | 9904 | 37.41 | 1161 | 1139 | 234.3 |
| B | 0 | 189 | 31163 | 131.7 | 1194 | 1165 | 227.8 |
| B | 12 | 111 | 28086 | 118.2 | 1194 | 1165 | 227.8 |
| B | 0 | 197 | 25355 | 106.2 | 1194 | 1165 | 227.8 |
| C | 14 | 238 | 175398 | 643.87 | 1144 | 1148 | 270.6 |
| C | 3 | 233 | 132695 | 486.07 | 1144 | 1148 | 270.6 |
| C | 9 | 160 | 13584 | 45.95 | 1144 | 1148 | 270.6 |
| D | 7 | 238 | 2231175 | 8243.52 | 1112 | 1080 | 270.5 |
| D | 5 | 222 | 1976752 | 7303.05 | 1112 | 1080 | 270.5 |
| D | 11 | 176 | 87358 | 318.92 | 1112 | 1080 | 270.5 |
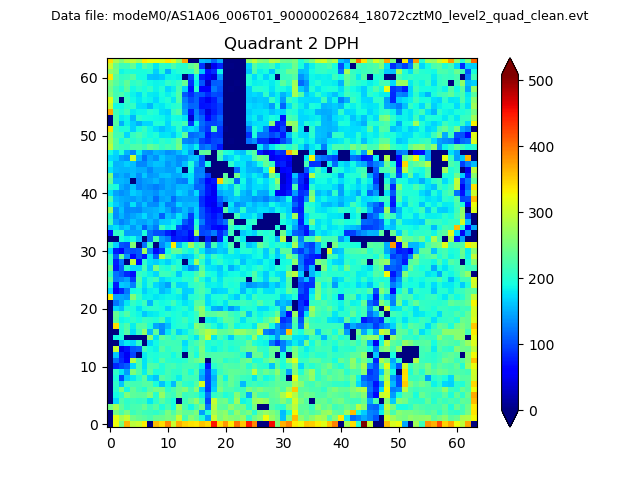
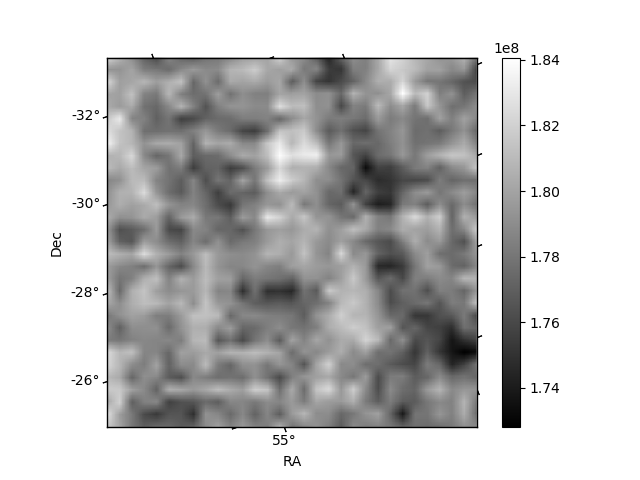
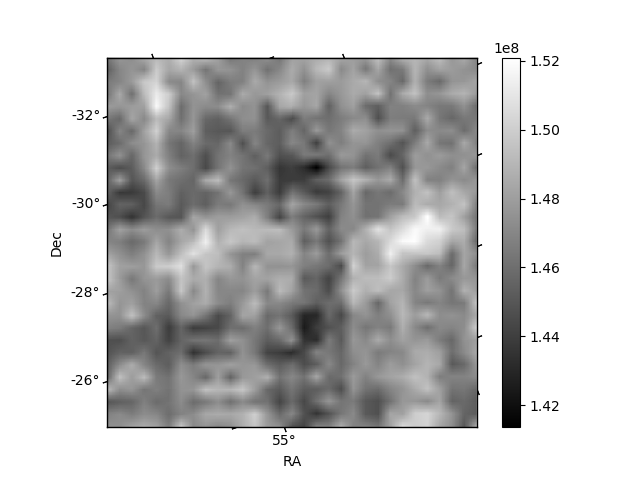
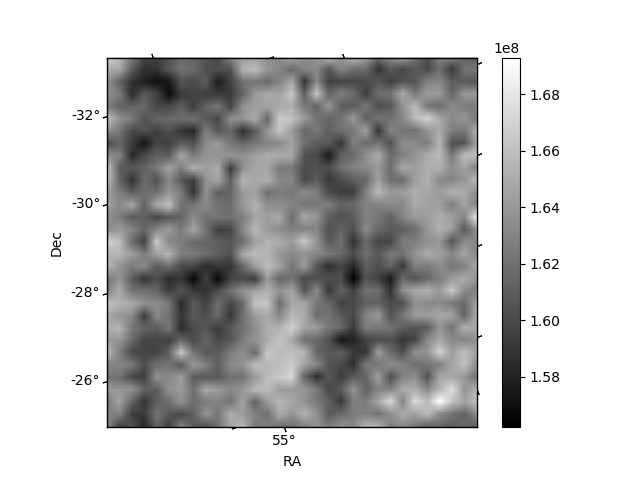
Histogram calculated using DETX and DETY for each event in the final _common_clean file
| Quadrant A | 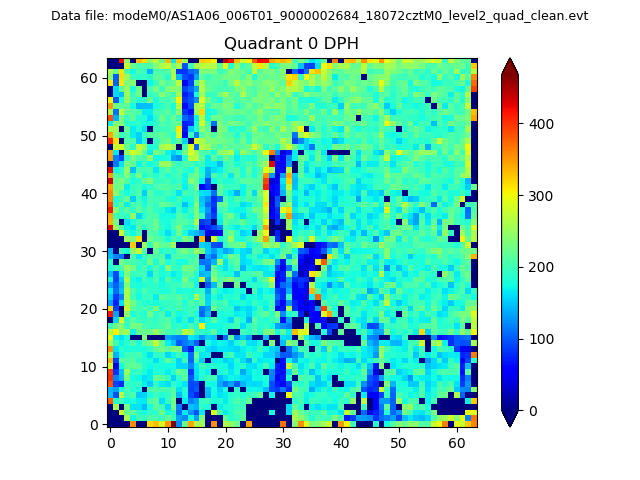 |
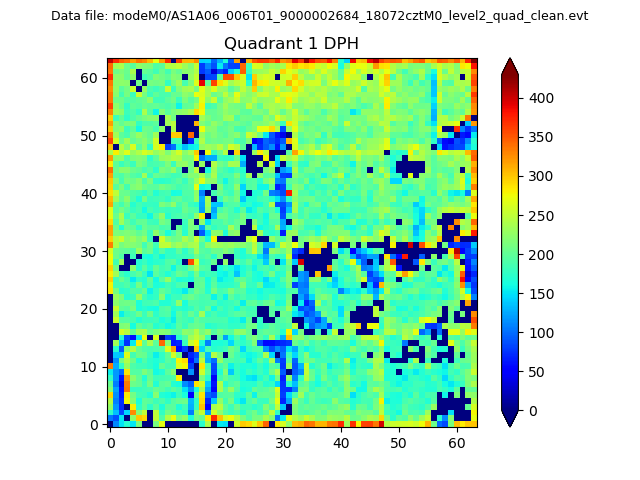 |
Quadrant B |
|---|---|---|---|
| Quadrant D | 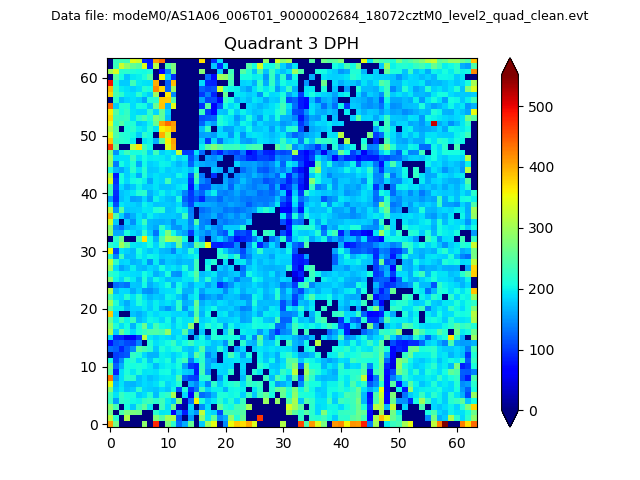 |
 |
Quadrant C |
| Plot type | Count rate plots | Images |
|---|---|---|
| Comparison with Poisson distribution Blue bars denote a histogram of data divided into 1 sec bins. Red curve is a Poisson curve with rate = median count rate of data. |
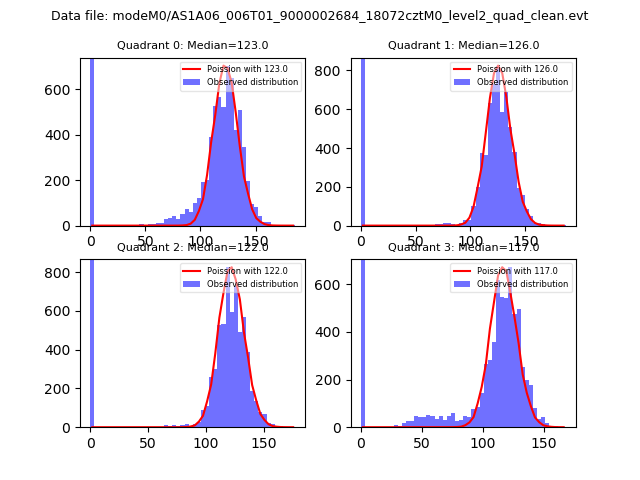 |
 |
| Quadrant-wise count rates Data is divided into 100 sec bins |
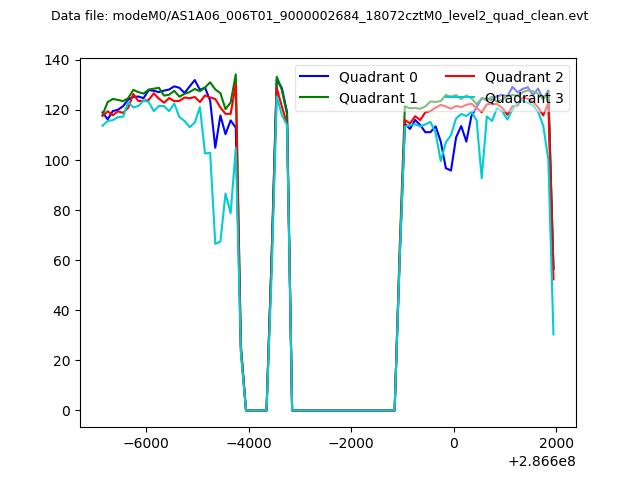 |
|
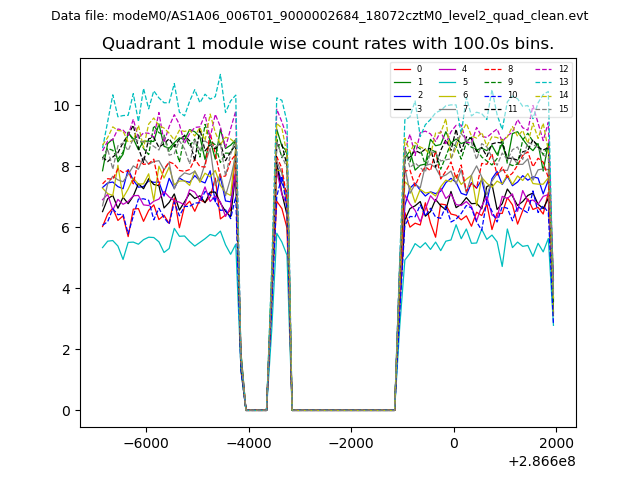
| Module-wise count rates for Quadrant A Data is divided into 100 sec bins |
 |
 |
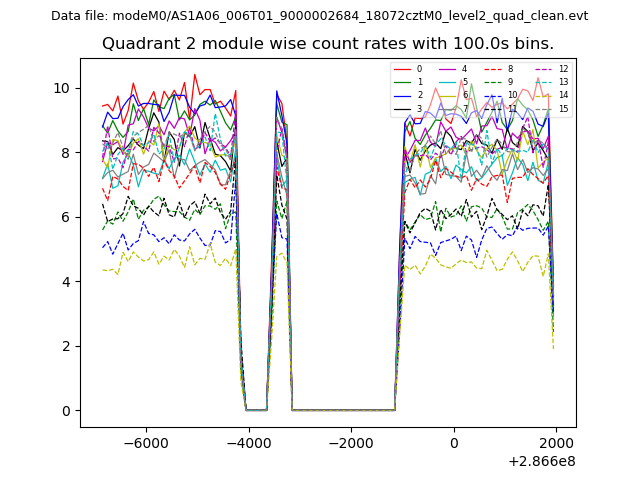
| Module-wise count rates for Quadrant B Data is divided into 100 sec bins |
 |
 |
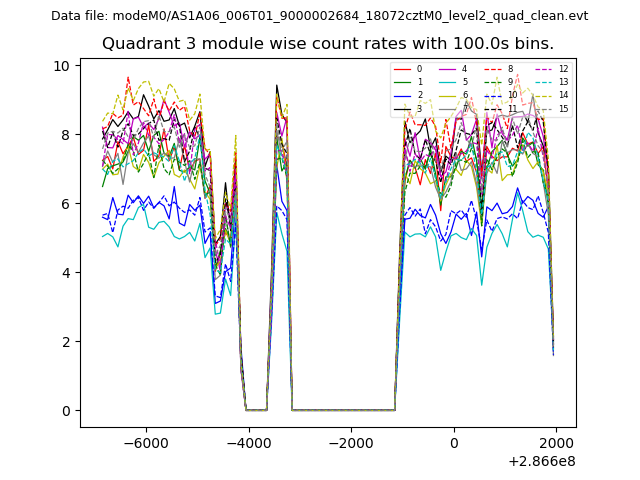
| Module-wise count rates for Quadrant C Data is divided into 100 sec bins |
 |
 |
| Module-wise count rates for Quadrant D Data is divided into 100 sec bins |
 |
 |
| Parameter | Plot |
|---|---|
| CZT HV Monitor |  |
| D_VDD | 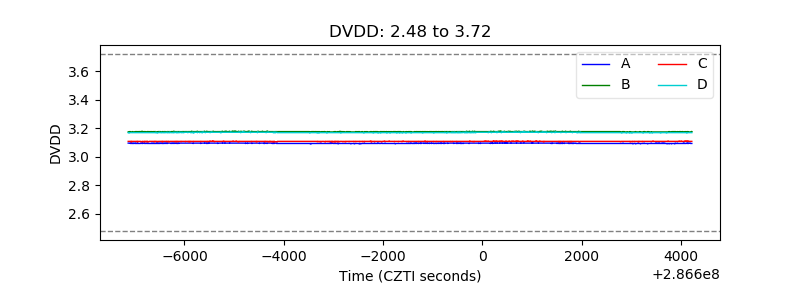 |
| Temperature 1 | 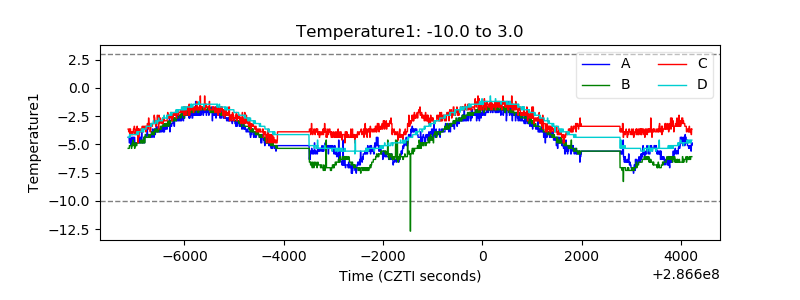 |
| Veto HV Monitor | 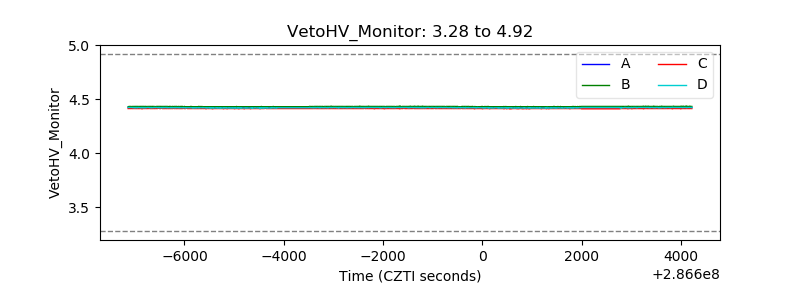 |
| Veto LLD | 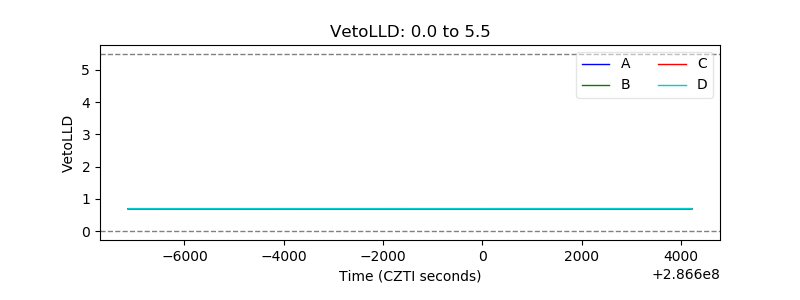 |
| Alpha Counter | 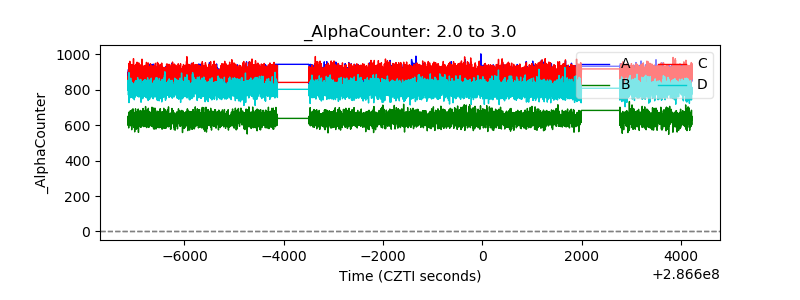 |
| _CPM_Rate | 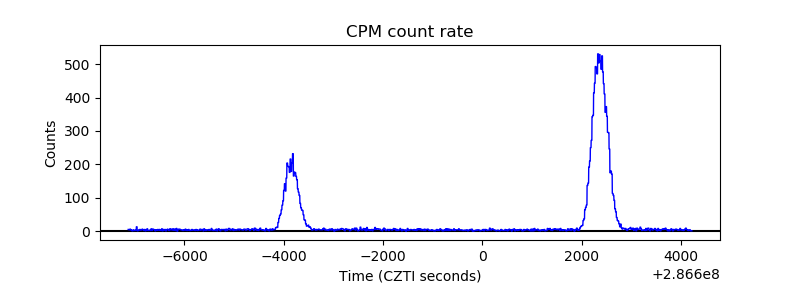 |
| CZT Counter | 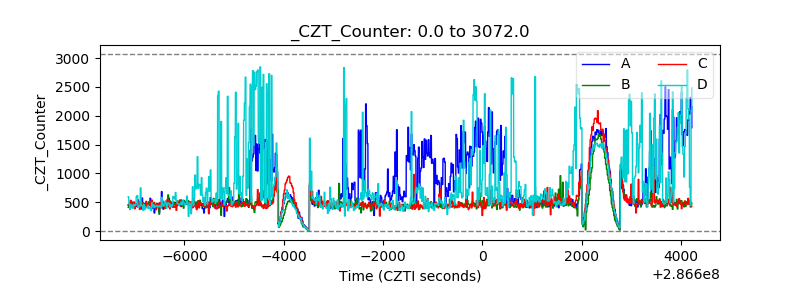 |
| +2.5 Volts monitor |  |
| +5 Volts monitor |  |
| _ROLL_ROT | 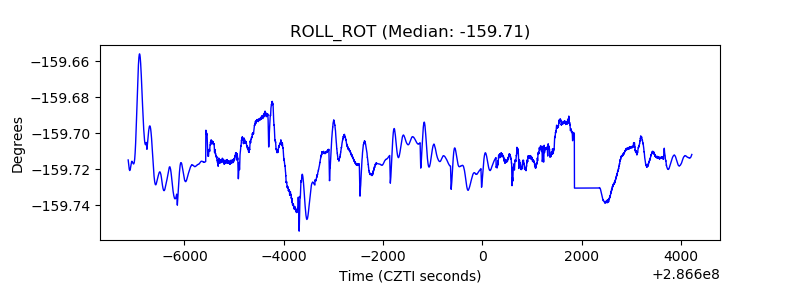 |
| _Roll_DEC | 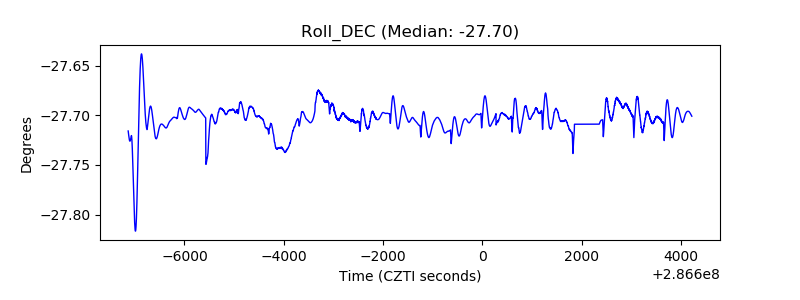 |
| _Roll_RA | 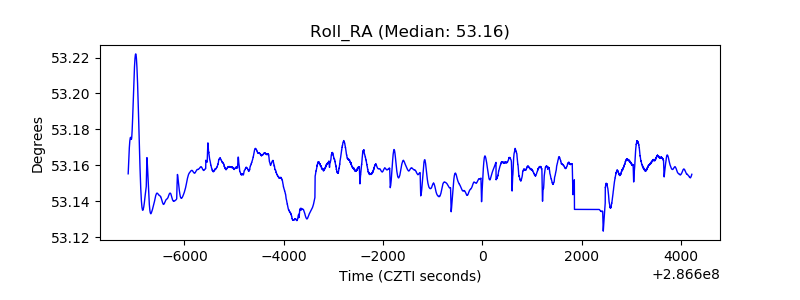 |
| Veto Counter | 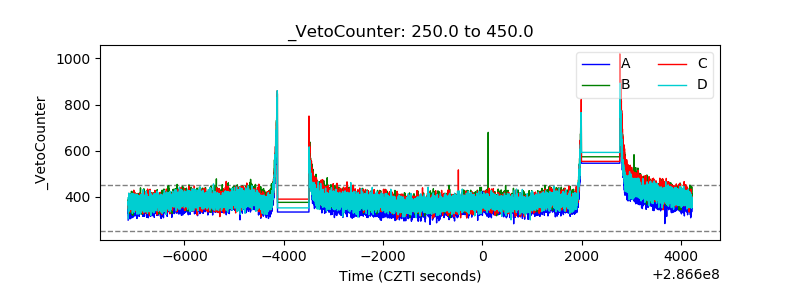 |