| Param | Original file | Final file |
|---|---|---|
| Filename | modeM0/AS1A06_006T01_9000002684_18073cztM0_level2.evt | modeM0/AS1A06_006T01_9000002684_18073cztM0_level2_quad_clean.evt |
| Size (bytes) | 741,473,280 | 64,082,880 |
| Size | 707.1 MB | 61.1 MB |
| Events in quadrant A | 7,833,015 | 331,231 |
| Events in quadrant B | 3,202,886 | 411,841 |
| Events in quadrant C | 3,201,233 | 398,994 |
| Events in quadrant D | 7,775,166 | 340,229 |
| Mode SS | |||
|---|---|---|---|
| Quadrant | BADHDUFLAG | Total packets | Discarded packets |
| A | 0 | 132 | 0 |
| B | 0 | 132 | 0 |
| C | 0 | 132 | 0 |
| D | 0 | 132 | 0 |
| Mode M9 | |||
|---|---|---|---|
| Quadrant | BADHDUFLAG | Total packets | Discarded packets |
| A | 0 | 10 | 0 |
| B | 0 | 10 | 0 |
| C | 0 | 10 | 0 |
| D | 0 | 10 | 0 |
| Mode M0 | |||
|---|---|---|---|
| Quadrant | BADHDUFLAG | Total packets | Discarded packets |
| A | 0 | 27571 | 1 |
| B | 0 | 13538 | 1 |
| C | 0 | 13648 | 1 |
| D | 0 | 27587 | 1 |
| Quadrant | Total seconds | Saturated seconds | Saturation percentage |
|---|---|---|---|
| A | 6550 | 2731 | 41.694656% |
| B | 6551 | 61 | 0.931156% |
| C | 6551 | 87 | 1.328042% |
| D | 6551 | 1411 | 21.538696% |
Noise dominated data is calculated using 1-second bins in cleaned event files. If a bin has >2000 counts, and if more than 50% of those come from <1% of pixels, then it is considered to be noise-dominated and hence unusable.
| Quadrant | # 1 sec bins | Bins with >0 counts | Bins with >2000 counts | High rate bins dominated by noise | Noise dominated (total time) | Noise dominated (detector-on time) | Marked lightcurve |
|---|---|---|---|---|---|---|---|
| A | 7500 | 6550 | 545 | 545 | 7.27% | 8.32% | 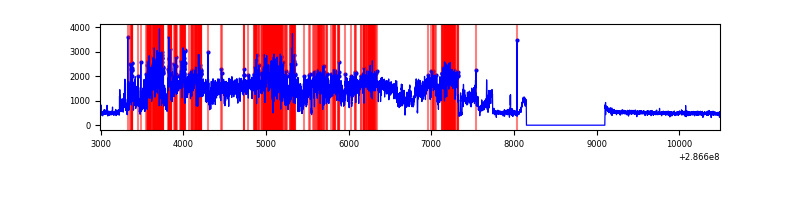 |
| B | 7501 | 6551 | 2 | 2 | 0.03% | 0.03% | 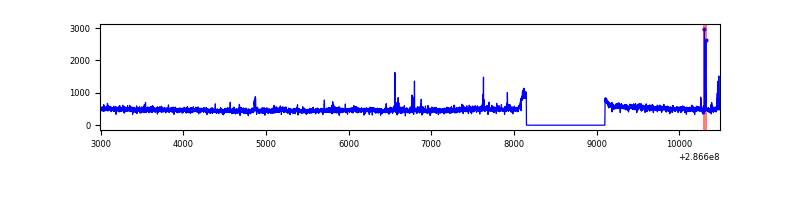 |
| C | 7501 | 6551 | 0 | 0 | 0.00% | 0.00% |  |
| D | 7501 | 6551 | 1140 | 1140 | 15.20% | 17.40% | 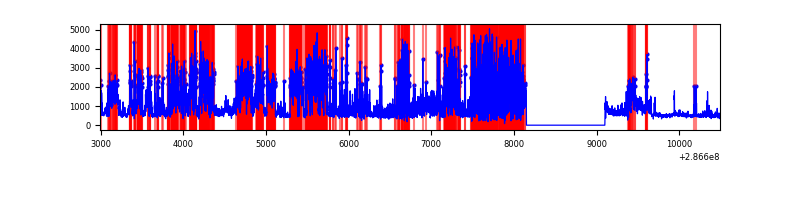 |
Top three noisy pixels from each quadrant. If the there are fewer than three noisy pixels in the level2.evt file, extra rows are filled as -1
| Pixel properties | Quadrant properties | ||||||
|---|---|---|---|---|---|---|---|
| Quadrant | DetID | PixID | Counts | Sigma | Mean | Median | Sigma |
| A | 14 | 111 | 4208124 | 29851.4 | 700 | 685 | 140.9 |
| A | 15 | 174 | 883138 | 6260.92 | 700 | 685 | 140.9 |
| A | 4 | 2 | 53886 | 377.45 | 700 | 685 | 140.9 |
| B | 0 | 189 | 52788 | 342.69 | 793 | 771 | 151.8 |
| B | 3 | 64 | 18934 | 119.66 | 793 | 771 | 151.8 |
| B | 12 | 111 | 18362 | 115.89 | 793 | 771 | 151.8 |
| C | 14 | 238 | 117661 | 650.45 | 764 | 768 | 179.7 |
| C | 3 | 233 | 93441 | 515.68 | 764 | 768 | 179.7 |
| C | 5 | 218 | 6414 | 31.42 | 764 | 768 | 179.7 |
| D | 5 | 222 | 4510263 | 26010.53 | 711 | 689 | 173.4 |
| D | 1 | 52 | 243352 | 1399.64 | 711 | 689 | 173.4 |
| D | 7 | 238 | 209821 | 1206.24 | 711 | 689 | 173.4 |
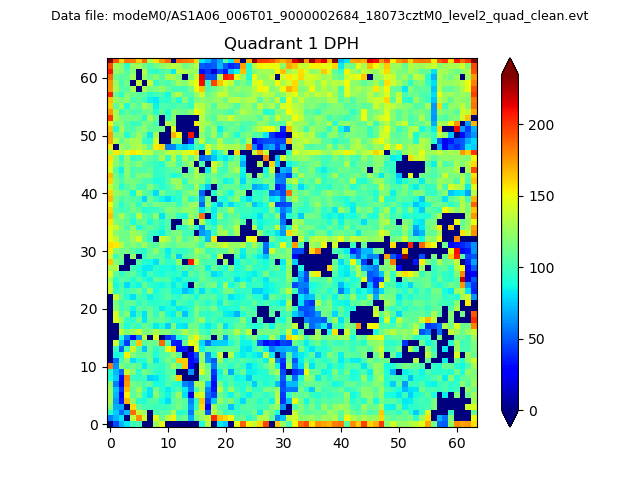
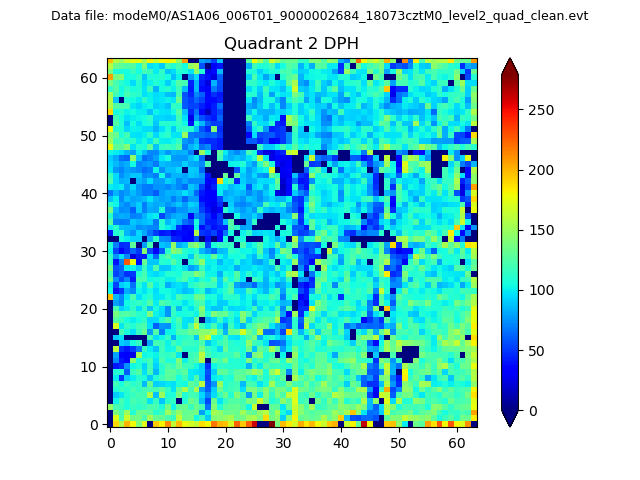
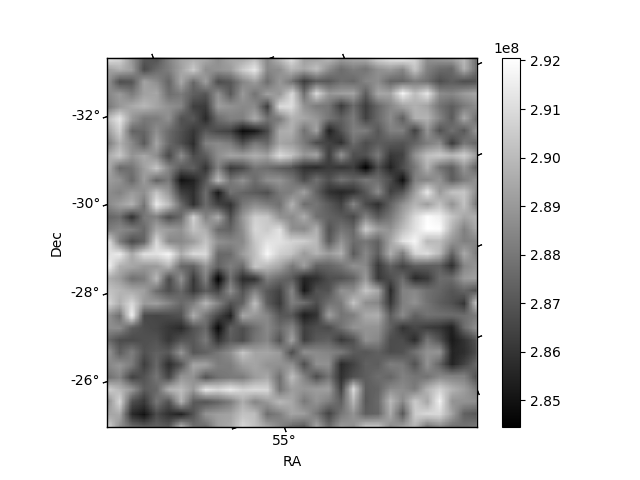
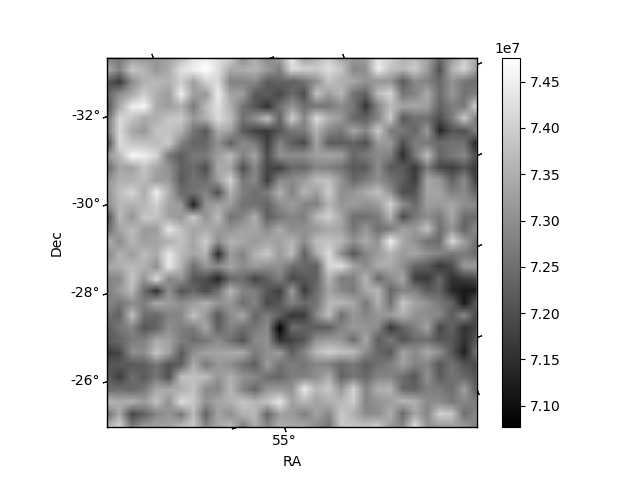
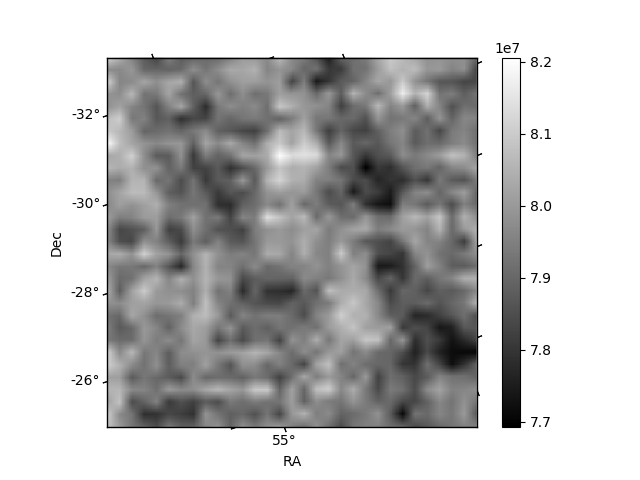
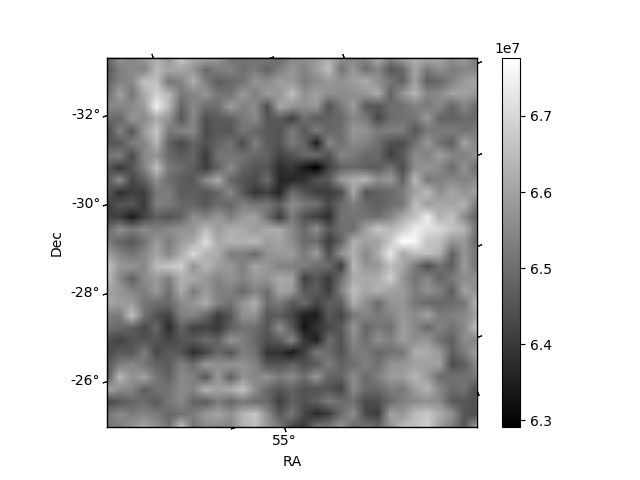
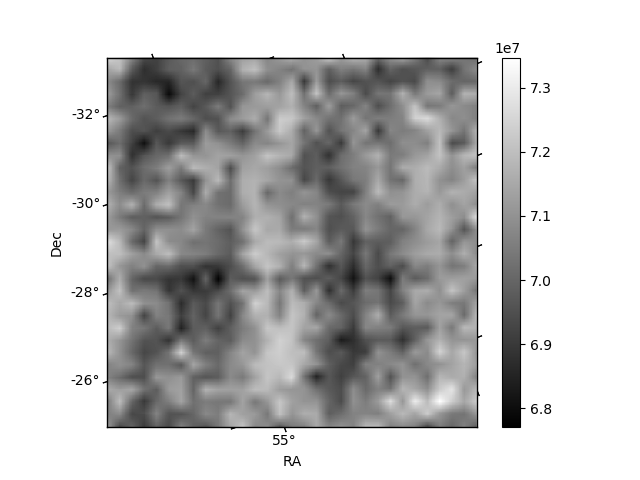
Histogram calculated using DETX and DETY for each event in the final _common_clean file
| Quadrant A | 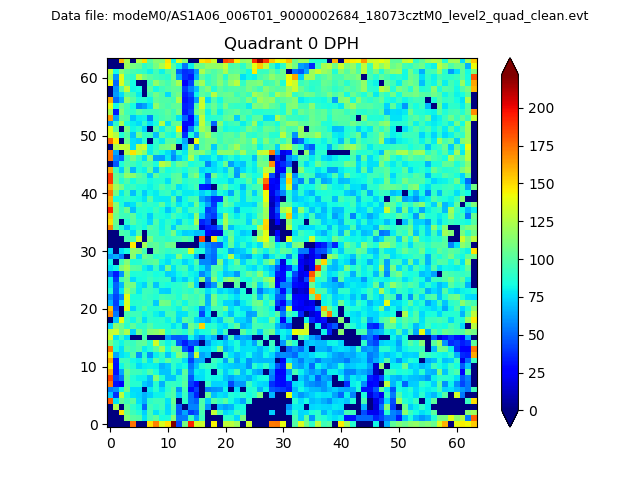 |
 |
Quadrant B |
|---|---|---|---|
| Quadrant D | 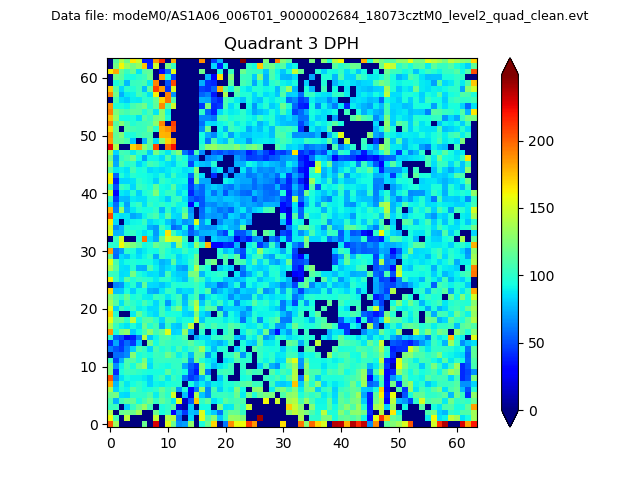 |
 |
Quadrant C |
| Plot type | Count rate plots | Images |
|---|---|---|
| Comparison with Poisson distribution Blue bars denote a histogram of data divided into 1 sec bins. Red curve is a Poisson curve with rate = median count rate of data. |
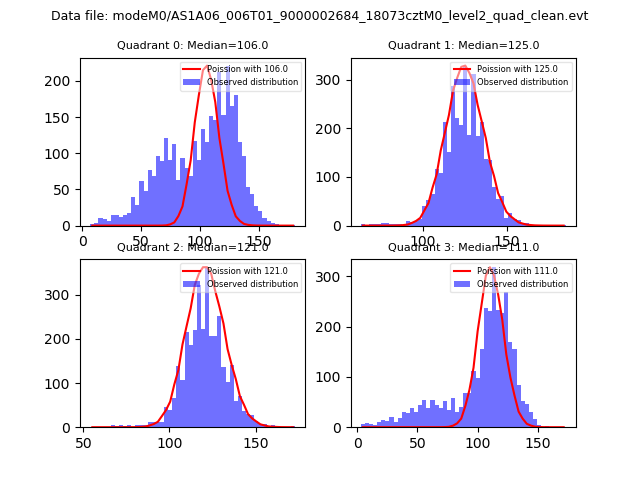 |
 |
| Quadrant-wise count rates Data is divided into 100 sec bins |
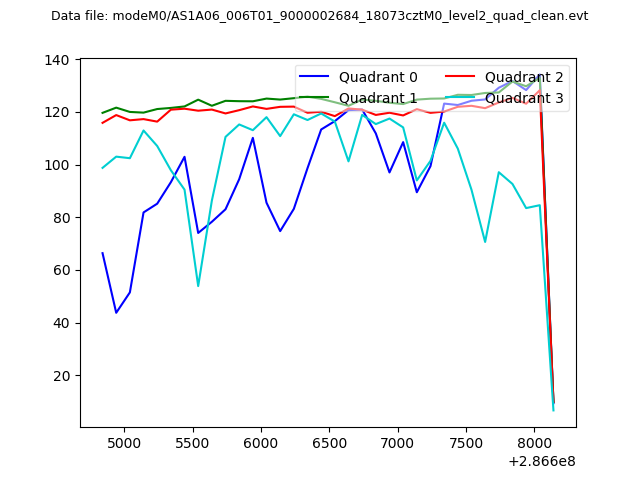 |
|
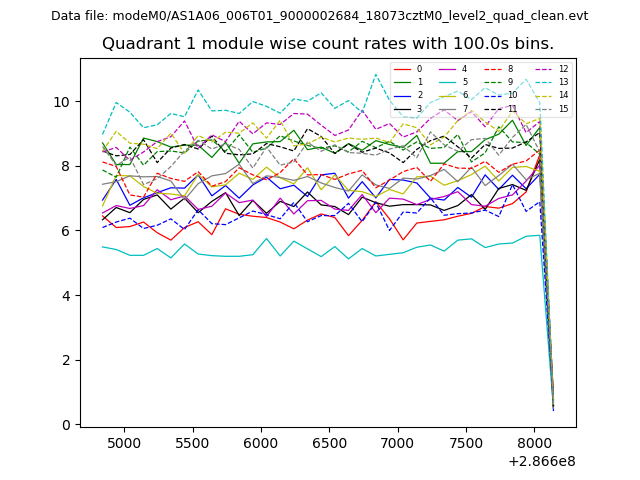
| Module-wise count rates for Quadrant A Data is divided into 100 sec bins |
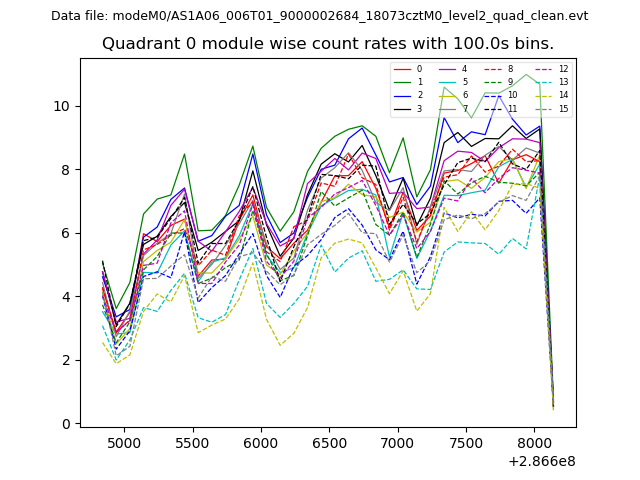 |
 |
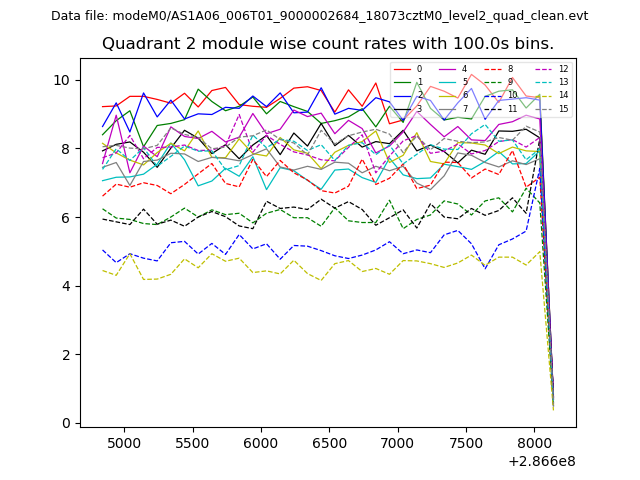
| Module-wise count rates for Quadrant B Data is divided into 100 sec bins |
 |
 |
| Module-wise count rates for Quadrant C Data is divided into 100 sec bins |
 |
 |
| Module-wise count rates for Quadrant D Data is divided into 100 sec bins |
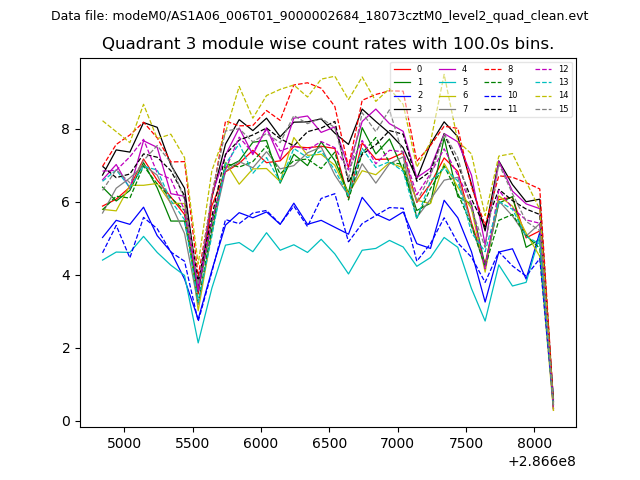 |
 |
| Parameter | Plot |
|---|---|
| CZT HV Monitor | 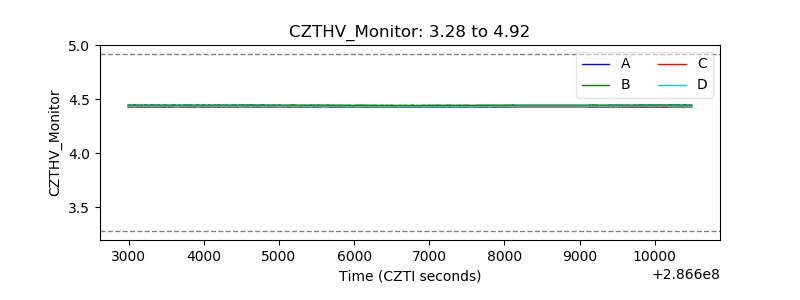 |
| D_VDD | 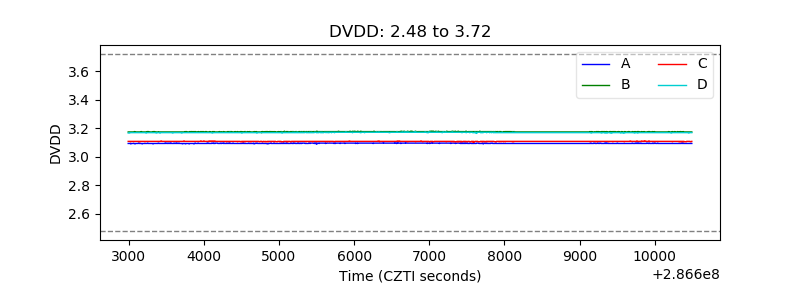 |
| Temperature 1 |  |
| Veto HV Monitor |  |
| Veto LLD | 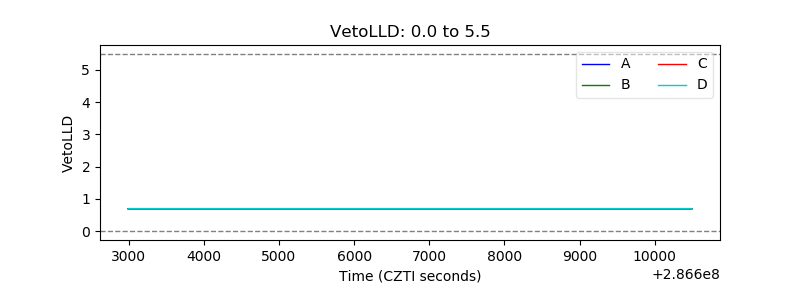 |
| Alpha Counter | 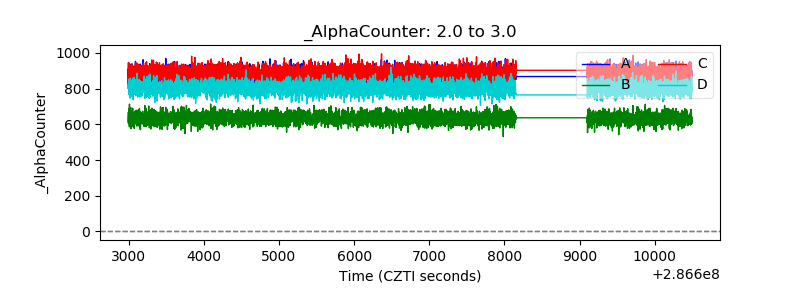 |
| _CPM_Rate | 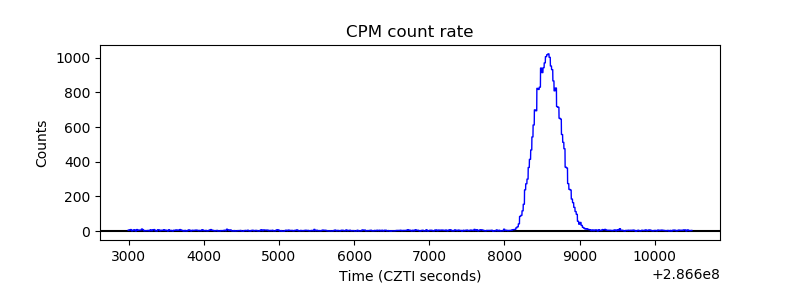 |
| CZT Counter | 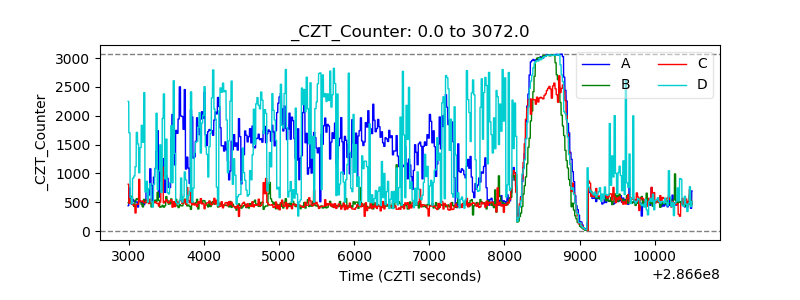 |
| +2.5 Volts monitor |  |
| +5 Volts monitor |  |
| _ROLL_ROT | 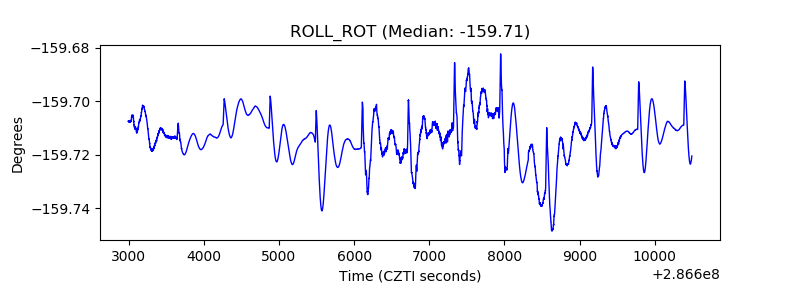 |
| _Roll_DEC | 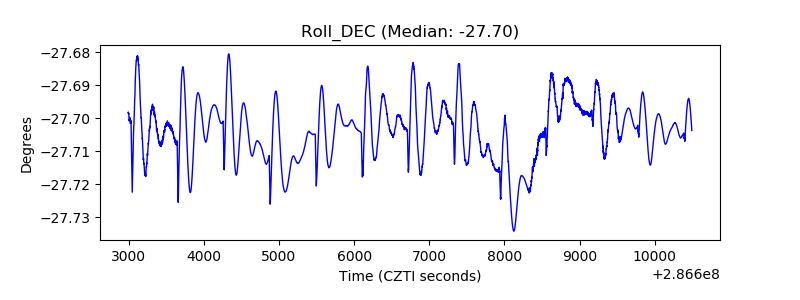 |
| _Roll_RA | 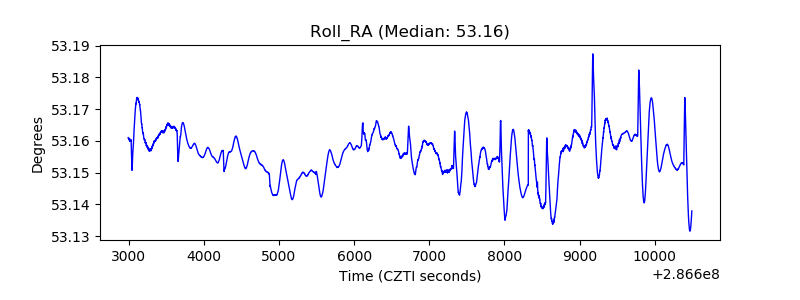 |
| Veto Counter | 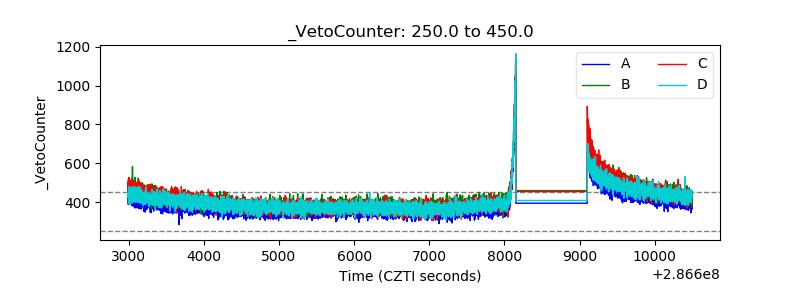 |