| Param | Original file | Final file |
|---|---|---|
| Filename | modeM0/AS1A06_006T01_9000002684_18074cztM0_level2.evt | modeM0/AS1A06_006T01_9000002684_18074cztM0_level2_quad_clean.evt |
| Size (bytes) | 502,816,320 | 78,641,280 |
| Size | 479.5 MB | 75.0 MB |
| Events in quadrant A | 3,579,963 | 489,141 |
| Events in quadrant B | 3,353,691 | 493,458 |
| Events in quadrant C | 3,265,388 | 477,390 |
| Events in quadrant D | 4,586,352 | 466,621 |
| Mode SS | |||
|---|---|---|---|
| Quadrant | BADHDUFLAG | Total packets | Discarded packets |
| A | 0 | 132 | 0 |
| B | 0 | 132 | 0 |
| C | 0 | 132 | 0 |
| D | 0 | 132 | 0 |
| Mode M9 | |||
|---|---|---|---|
| Quadrant | BADHDUFLAG | Total packets | Discarded packets |
| A | 0 | 11 | 0 |
| B | 0 | 11 | 0 |
| C | 0 | 11 | 0 |
| D | 0 | 11 | 0 |
| Mode M0 | |||
|---|---|---|---|
| Quadrant | BADHDUFLAG | Total packets | Discarded packets |
| A | 0 | 14897 | 2 |
| B | 0 | 13993 | 2 |
| C | 0 | 13886 | 2 |
| D | 0 | 18020 | 2 |
| Quadrant | Total seconds | Saturated seconds | Saturation percentage |
|---|---|---|---|
| A | 6519 | 320 | 4.908728% |
| B | 6520 | 91 | 1.395706% |
| C | 6520 | 86 | 1.319018% |
| D | 6520 | 235 | 3.604294% |
Noise dominated data is calculated using 1-second bins in cleaned event files. If a bin has >2000 counts, and if more than 50% of those come from <1% of pixels, then it is considered to be noise-dominated and hence unusable.
| Quadrant | # 1 sec bins | Bins with >0 counts | Bins with >2000 counts | High rate bins dominated by noise | Noise dominated (total time) | Noise dominated (detector-on time) | Marked lightcurve |
|---|---|---|---|---|---|---|---|
| A | 7609 | 6520 | 0 | 0 | 0.00% | 0.00% | 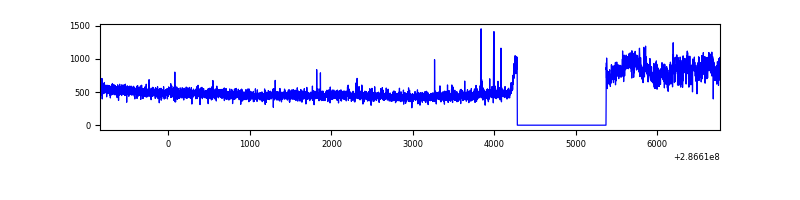 |
| B | 7610 | 6521 | 13 | 13 | 0.17% | 0.20% | 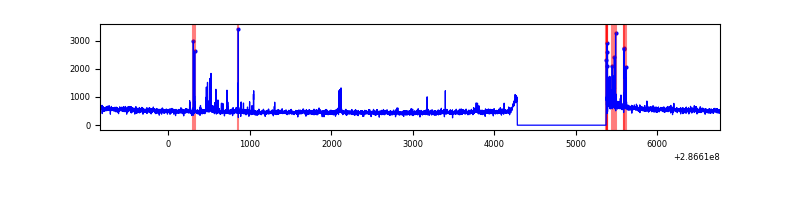 |
| C | 7610 | 6521 | 0 | 0 | 0.00% | 0.00% | 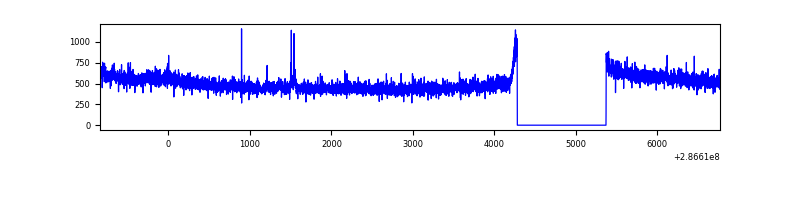 |
| D | 7610 | 6521 | 141 | 141 | 1.85% | 2.16% | 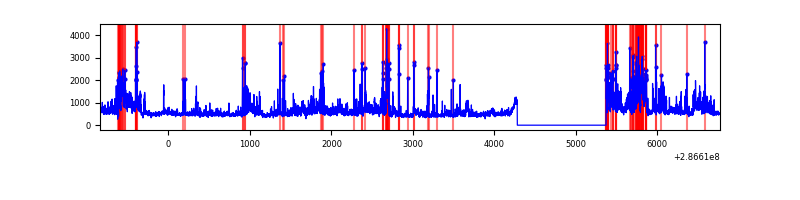 |
Top three noisy pixels from each quadrant. If the there are fewer than three noisy pixels in the level2.evt file, extra rows are filled as -1
| Pixel properties | Quadrant properties | ||||||
|---|---|---|---|---|---|---|---|
| Quadrant | DetID | PixID | Counts | Sigma | Mean | Median | Sigma |
| A | 14 | 111 | 415071 | 2529.43 | 817 | 801 | 163.8 |
| A | 15 | 174 | 12654 | 72.37 | 817 | 801 | 163.8 |
| A | 4 | 2 | 12333 | 70.41 | 817 | 801 | 163.8 |
| B | 3 | 64 | 113655 | 728.14 | 817 | 799 | 155.0 |
| B | 0 | 189 | 29149 | 182.91 | 817 | 799 | 155.0 |
| B | 12 | 111 | 18446 | 113.86 | 817 | 799 | 155.0 |
| C | 14 | 238 | 123951 | 671.34 | 789 | 796 | 183.4 |
| C | 3 | 233 | 48545 | 260.29 | 789 | 796 | 183.4 |
| C | 9 | 160 | 6428 | 30.7 | 789 | 796 | 183.4 |
| D | 7 | 238 | 821487 | 4228.18 | 792 | 770 | 194.1 |
| D | 5 | 222 | 312093 | 1603.88 | 792 | 770 | 194.1 |
| D | 1 | 52 | 153309 | 785.85 | 792 | 770 | 194.1 |
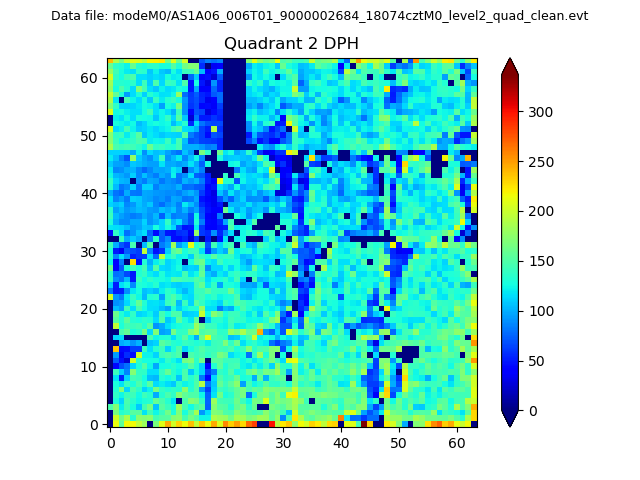
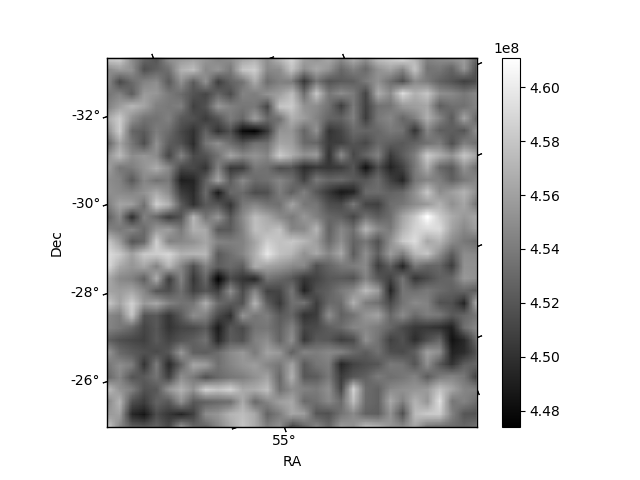
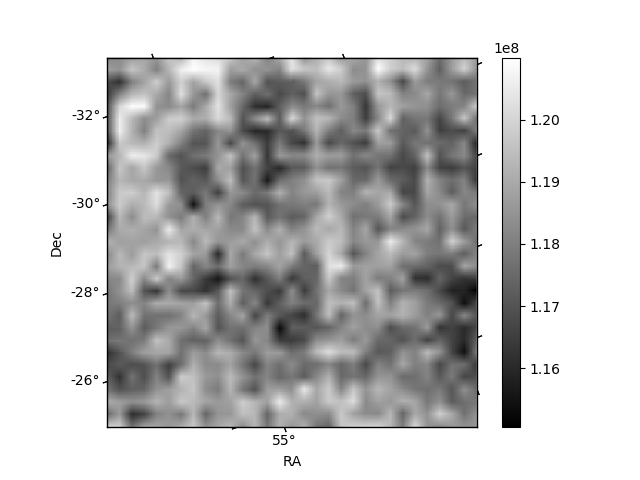
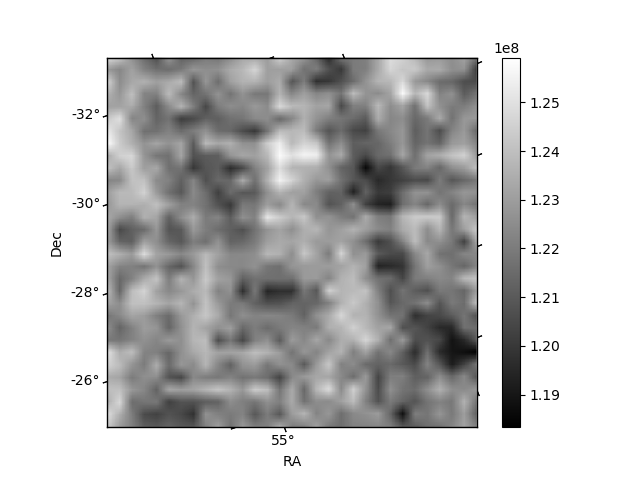
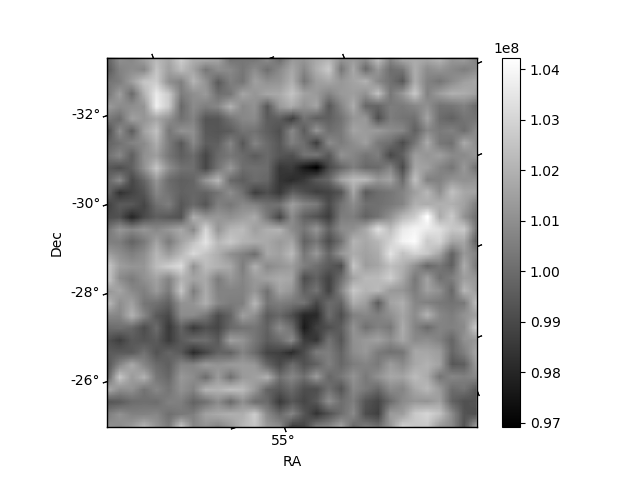
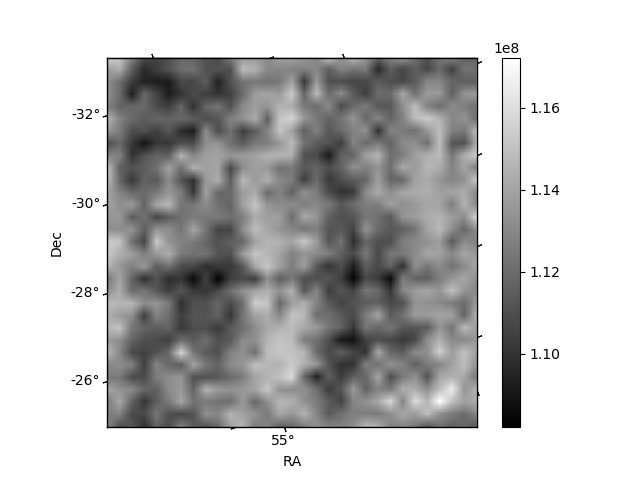
Histogram calculated using DETX and DETY for each event in the final _common_clean file
| Quadrant A | 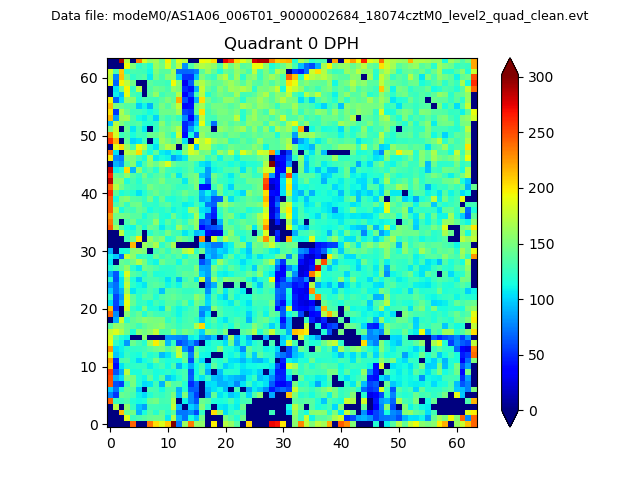 |
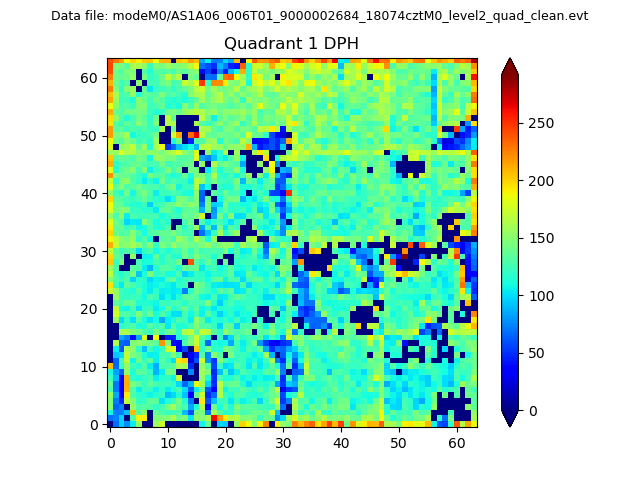 |
Quadrant B |
|---|---|---|---|
| Quadrant D | 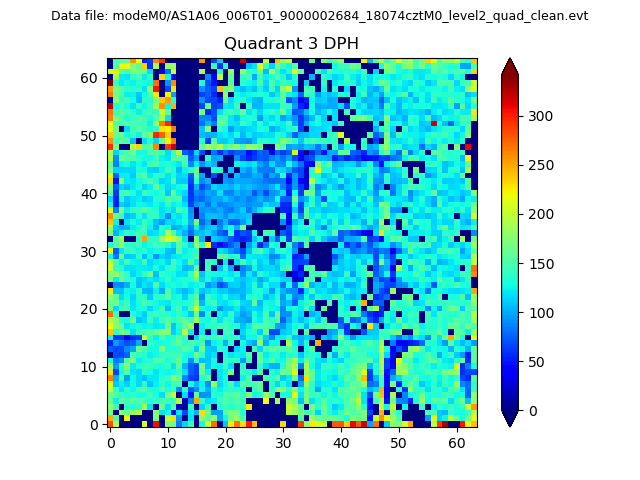 |
 |
Quadrant C |
| Plot type | Count rate plots | Images |
|---|---|---|
| Comparison with Poisson distribution Blue bars denote a histogram of data divided into 1 sec bins. Red curve is a Poisson curve with rate = median count rate of data. |
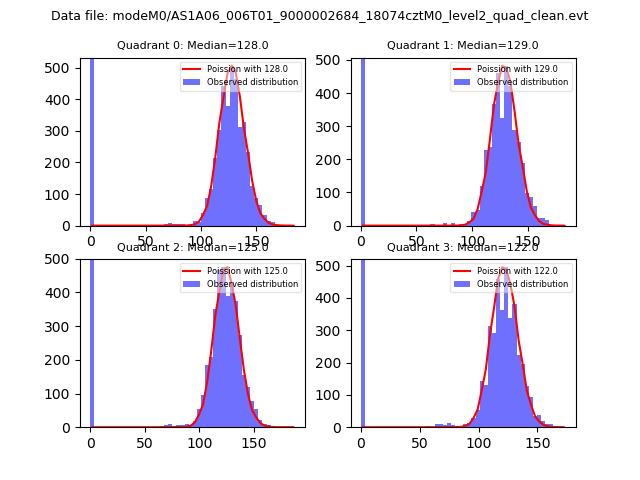 |
 |
| Quadrant-wise count rates Data is divided into 100 sec bins |
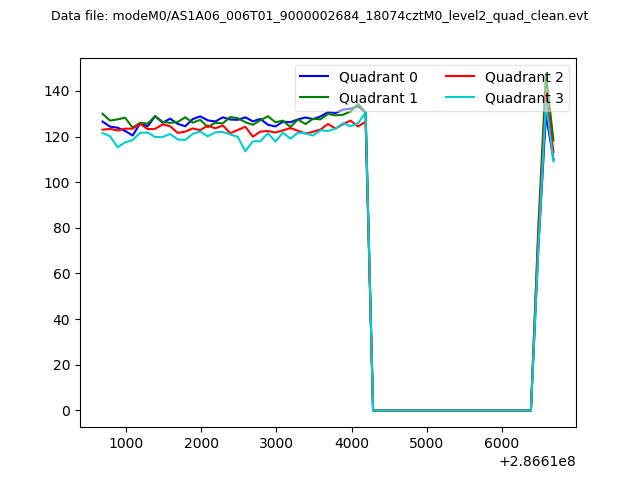 |
|
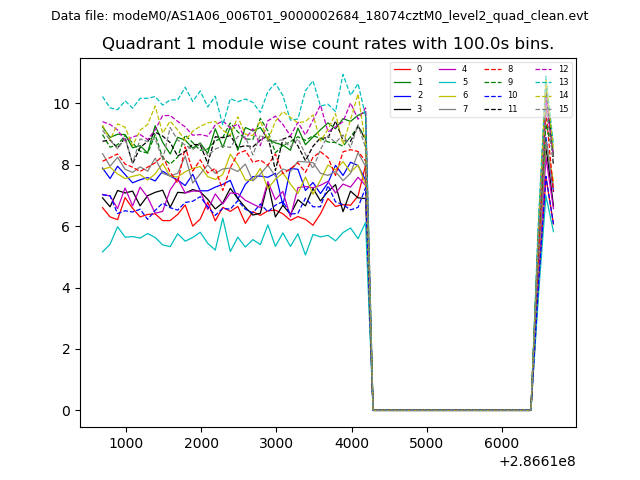
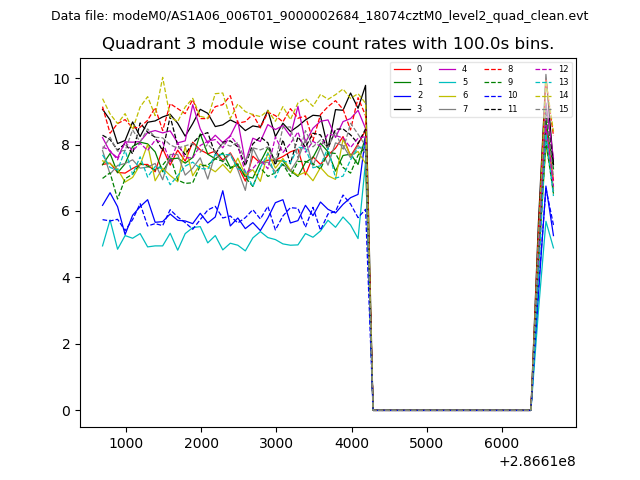
| Module-wise count rates for Quadrant A Data is divided into 100 sec bins |
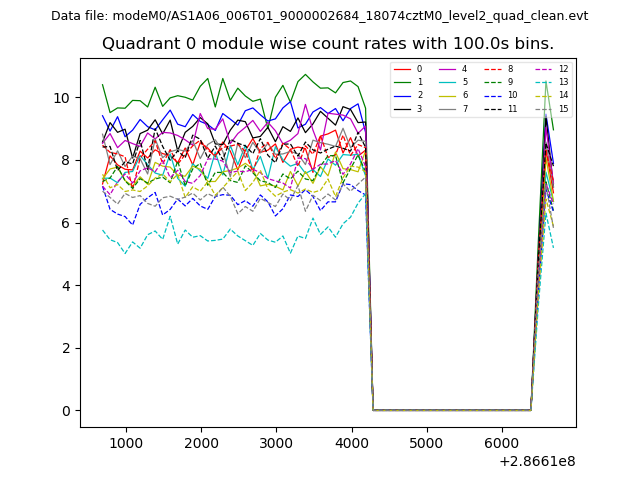 |
 |
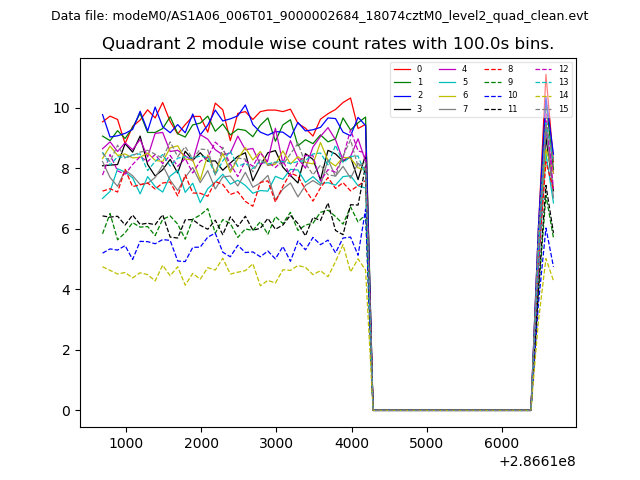
| Module-wise count rates for Quadrant B Data is divided into 100 sec bins |
 |
 |
| Module-wise count rates for Quadrant C Data is divided into 100 sec bins |
 |
 |
| Module-wise count rates for Quadrant D Data is divided into 100 sec bins |
 |
 |
| Parameter | Plot |
|---|---|
| CZT HV Monitor | 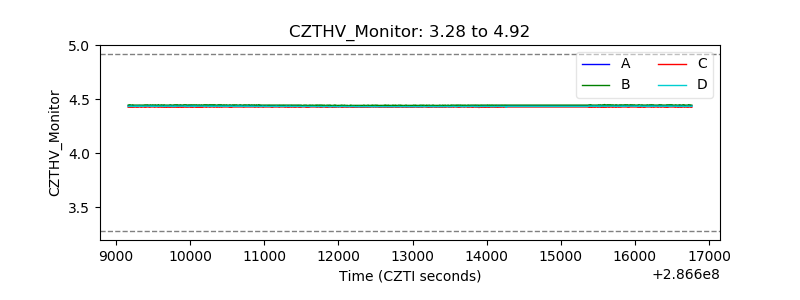 |
| D_VDD | 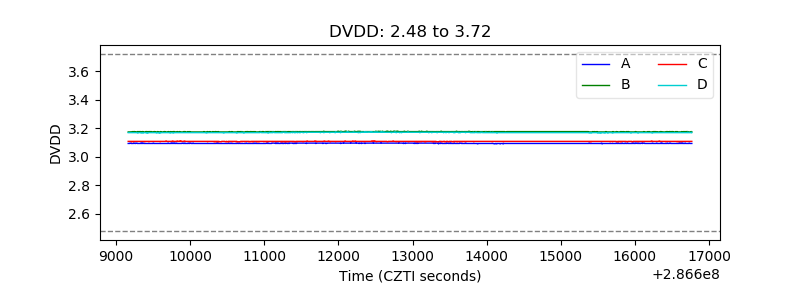 |
| Temperature 1 |  |
| Veto HV Monitor | 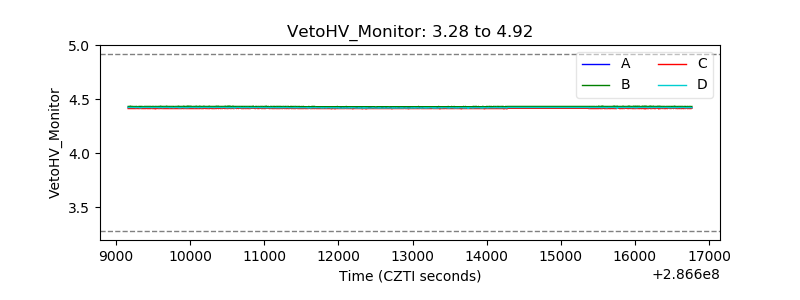 |
| Veto LLD | 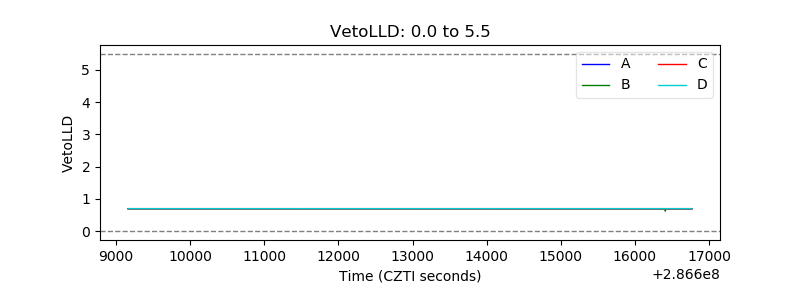 |
| Alpha Counter | 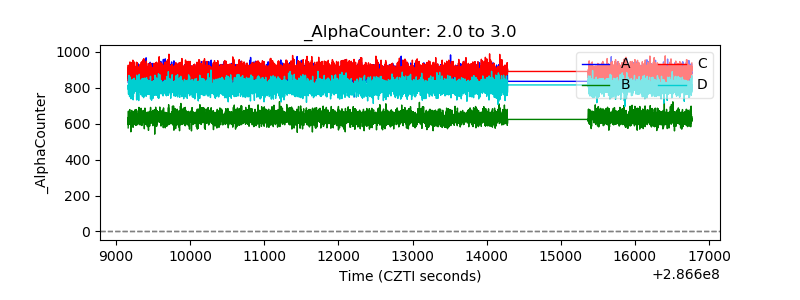 |
| _CPM_Rate | 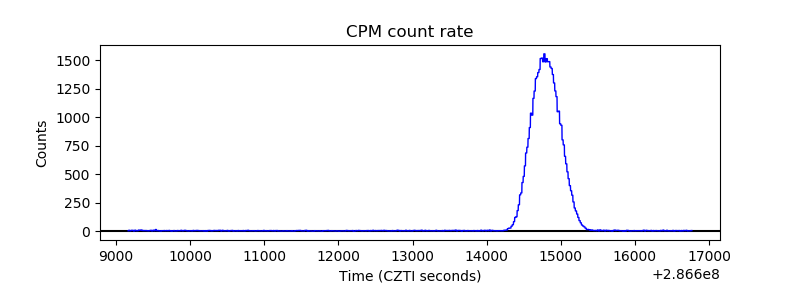 |
| CZT Counter | 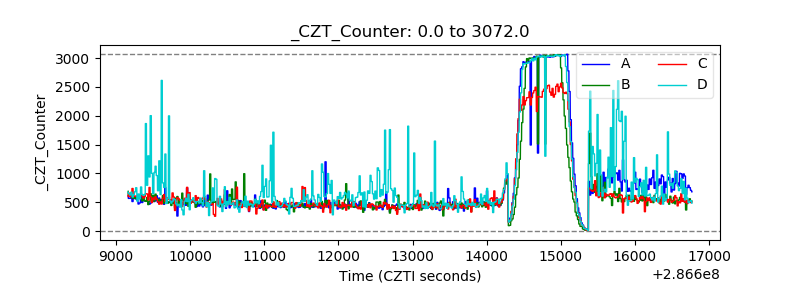 |
| +2.5 Volts monitor |  |
| +5 Volts monitor |  |
| _ROLL_ROT | 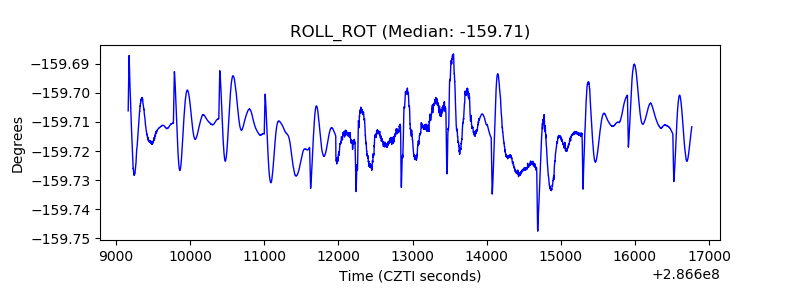 |
| _Roll_DEC | 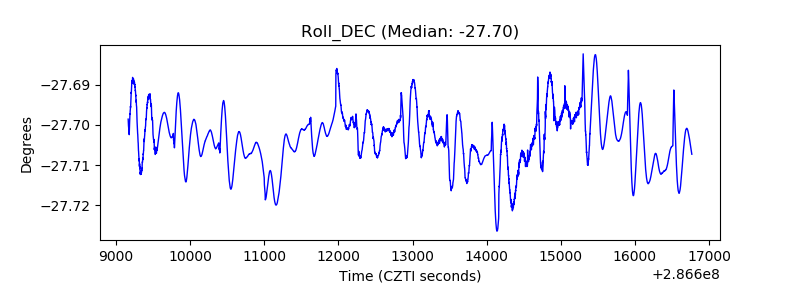 |
| _Roll_RA | 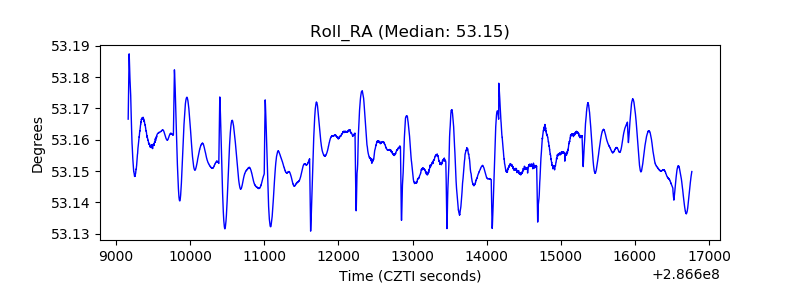 |
| Veto Counter | 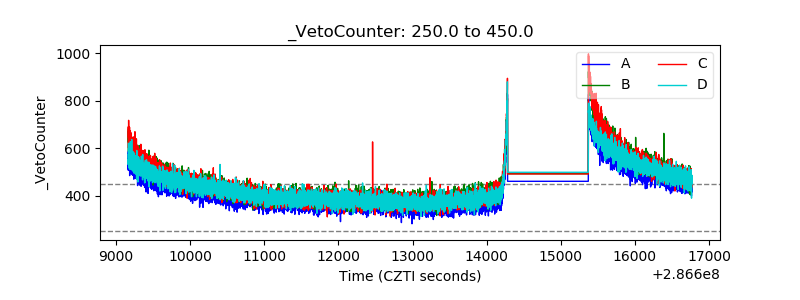 |