| Param | Original file | Final file |
|---|---|---|
| Filename | modeM0/AS1A06_006T01_9000002684_18076cztM0_level2.evt | modeM0/AS1A06_006T01_9000002684_18076cztM0_level2_quad_clean.evt |
| Size (bytes) | 607,561,920 | 90,161,280 |
| Size | 579.4 MB | 86.0 MB |
| Events in quadrant A | 4,997,627 | 570,483 |
| Events in quadrant B | 3,694,471 | 592,675 |
| Events in quadrant C | 3,362,766 | 573,867 |
| Events in quadrant D | 5,909,726 | 544,427 |
| Mode SS | |||
|---|---|---|---|
| Quadrant | BADHDUFLAG | Total packets | Discarded packets |
| A | 0 | 132 | 0 |
| B | 0 | 132 | 0 |
| C | 0 | 132 | 0 |
| D | 0 | 132 | 0 |
| Mode M9 | |||
|---|---|---|---|
| Quadrant | BADHDUFLAG | Total packets | Discarded packets |
| A | 0 | 16 | 0 |
| B | 0 | 17 | 0 |
| C | 0 | 17 | 0 |
| D | 0 | 17 | 0 |
| Mode M0 | |||
|---|---|---|---|
| Quadrant | BADHDUFLAG | Total packets | Discarded packets |
| A | 0 | 19394 | 2 |
| B | 0 | 15106 | 2 |
| C | 0 | 14181 | 2 |
| D | 0 | 22014 | 4 |
| Quadrant | Total seconds | Saturated seconds | Saturation percentage |
|---|---|---|---|
| A | 6425 | 949 | 14.770428% |
| B | 6425 | 149 | 2.319066% |
| C | 6425 | 111 | 1.727626% |
| D | 6424 | 489 | 7.612080% |
Noise dominated data is calculated using 1-second bins in cleaned event files. If a bin has >2000 counts, and if more than 50% of those come from <1% of pixels, then it is considered to be noise-dominated and hence unusable.
| Quadrant | # 1 sec bins | Bins with >0 counts | Bins with >2000 counts | High rate bins dominated by noise | Noise dominated (total time) | Noise dominated (detector-on time) | Marked lightcurve |
|---|---|---|---|---|---|---|---|
| A | 7620 | 6426 | 4 | 4 | 0.05% | 0.06% | 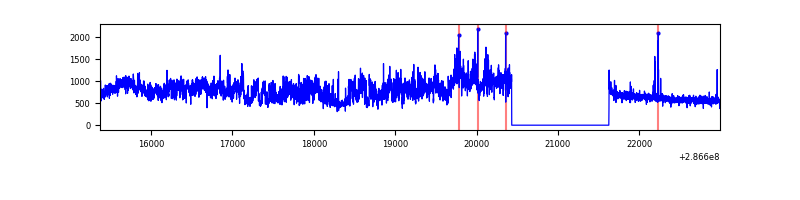 |
| B | 7620 | 6426 | 38 | 38 | 0.50% | 0.59% | 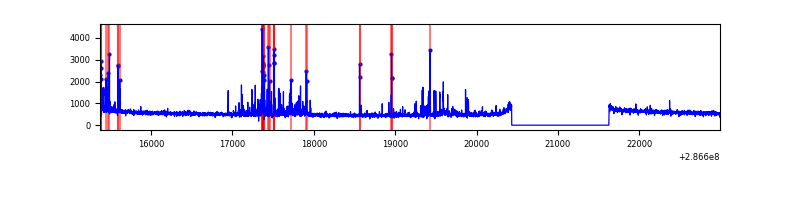 |
| C | 7620 | 6426 | 0 | 0 | 0.00% | 0.00% | 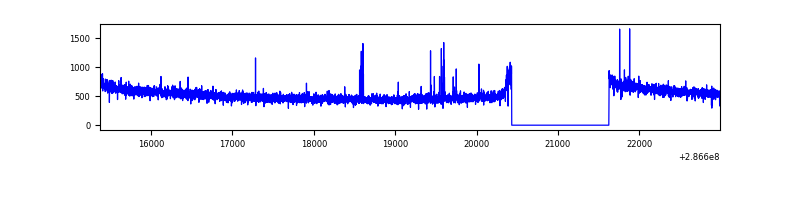 |
| D | 7619 | 6425 | 362 | 362 | 4.75% | 5.63% | 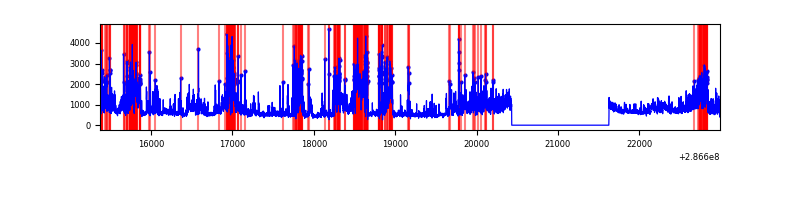 |
Top three noisy pixels from each quadrant. If the there are fewer than three noisy pixels in the level2.evt file, extra rows are filled as -1
| Pixel properties | Quadrant properties | ||||||
|---|---|---|---|---|---|---|---|
| Quadrant | DetID | PixID | Counts | Sigma | Mean | Median | Sigma |
| A | 14 | 111 | 1735806 | 10400.24 | 839 | 825 | 166.8 |
| A | 15 | 174 | 37553 | 220.16 | 839 | 825 | 166.8 |
| A | 0 | 226 | 7342 | 39.07 | 839 | 825 | 166.8 |
| B | 3 | 64 | 278107 | 1762.25 | 847 | 830 | 157.3 |
| B | 7 | 220 | 45949 | 286.76 | 847 | 830 | 157.3 |
| B | 0 | 229 | 22808 | 139.68 | 847 | 830 | 157.3 |
| C | 14 | 238 | 129844 | 689.8 | 814 | 821 | 187.0 |
| C | 9 | 160 | 22981 | 118.48 | 814 | 821 | 187.0 |
| C | 9 | 176 | 17453 | 88.92 | 814 | 821 | 187.0 |
| D | 5 | 222 | 1165567 | 5888.68 | 814 | 792 | 197.8 |
| D | 7 | 238 | 916626 | 4630.12 | 814 | 792 | 197.8 |
| D | 11 | 176 | 462904 | 2336.27 | 814 | 792 | 197.8 |
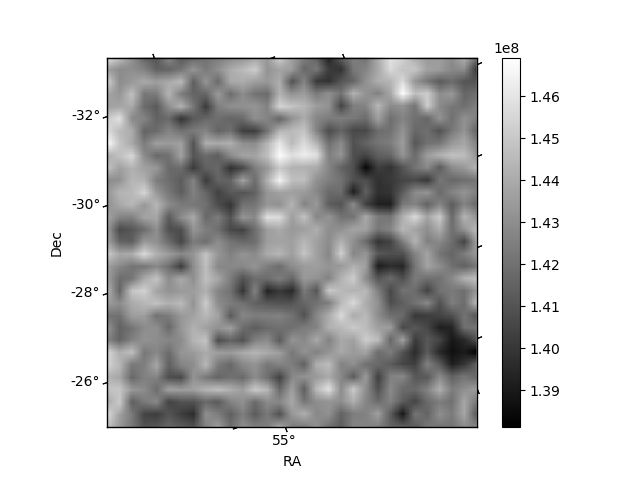
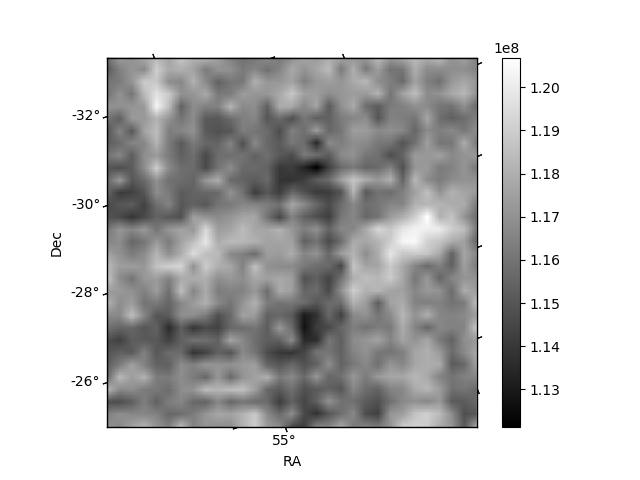
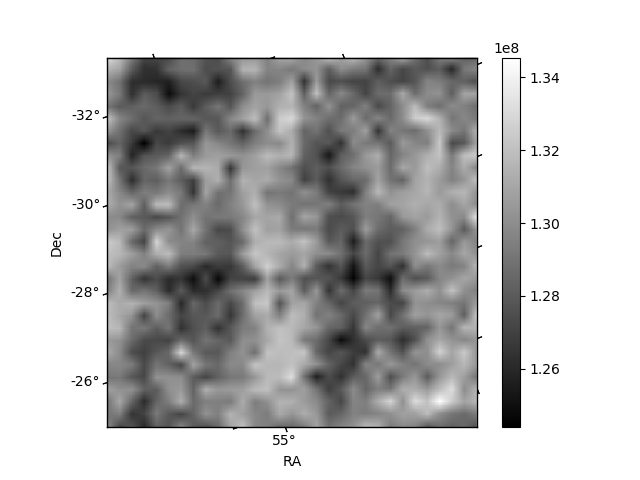
Histogram calculated using DETX and DETY for each event in the final _common_clean file
| Quadrant A | 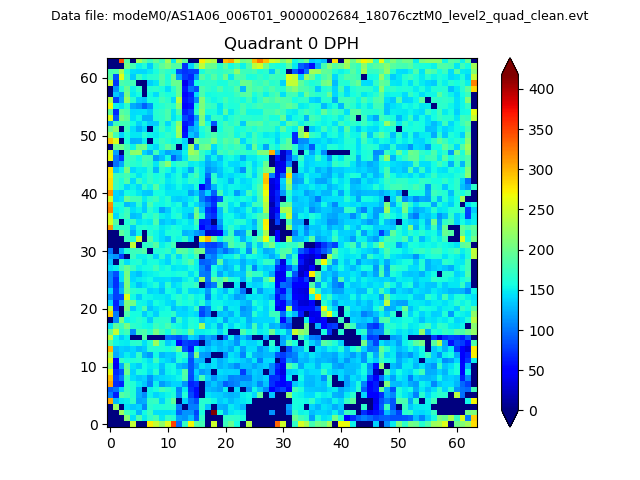 |
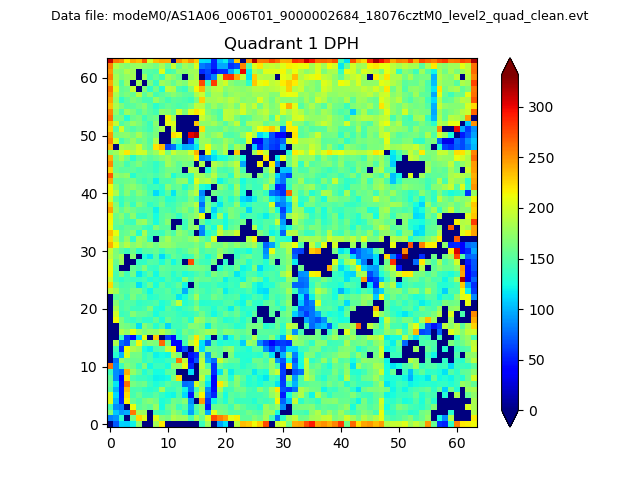 |
Quadrant B |
|---|---|---|---|
| Quadrant D | 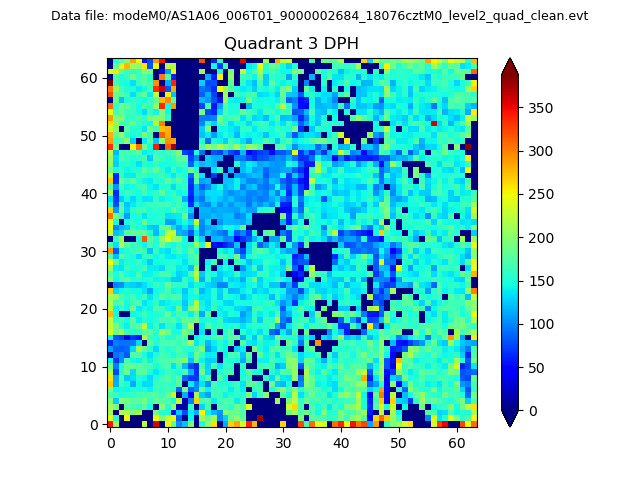 |
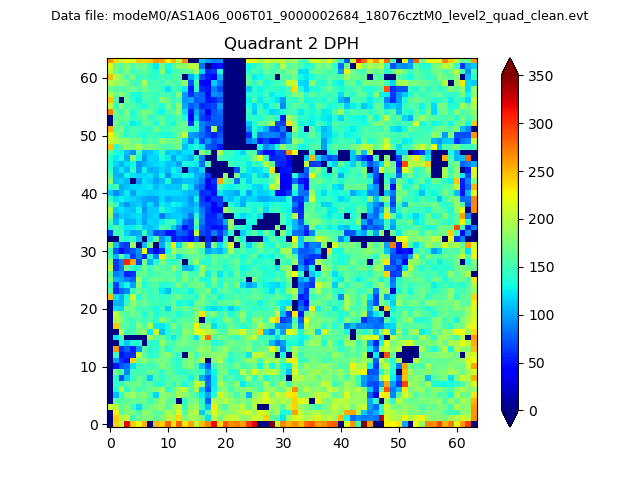 |
Quadrant C |
| Plot type | Count rate plots | Images |
|---|---|---|
| Comparison with Poisson distribution Blue bars denote a histogram of data divided into 1 sec bins. Red curve is a Poisson curve with rate = median count rate of data. |
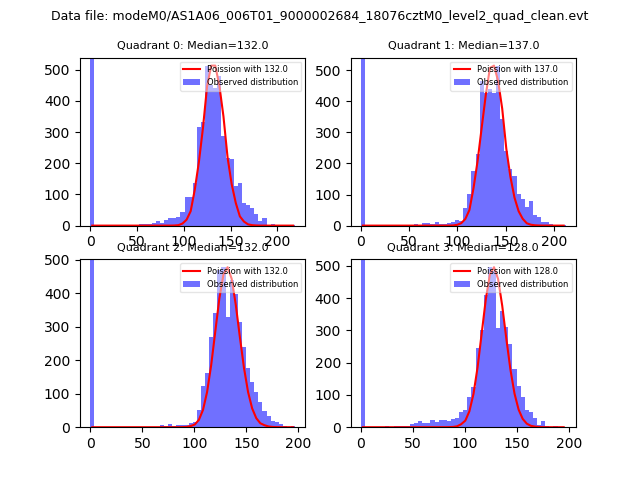 |
 |
| Quadrant-wise count rates Data is divided into 100 sec bins |
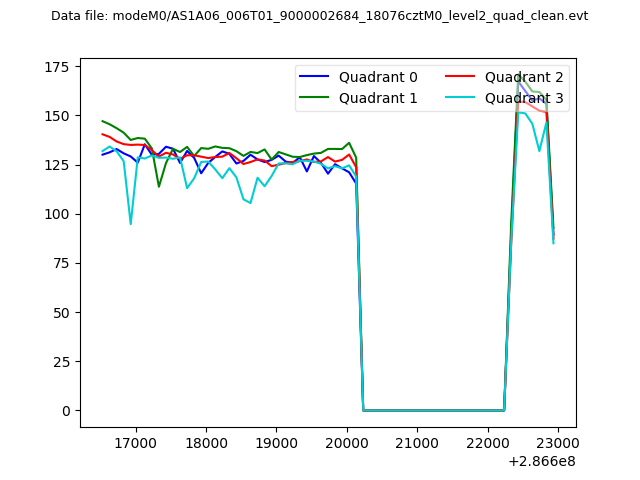 |
|
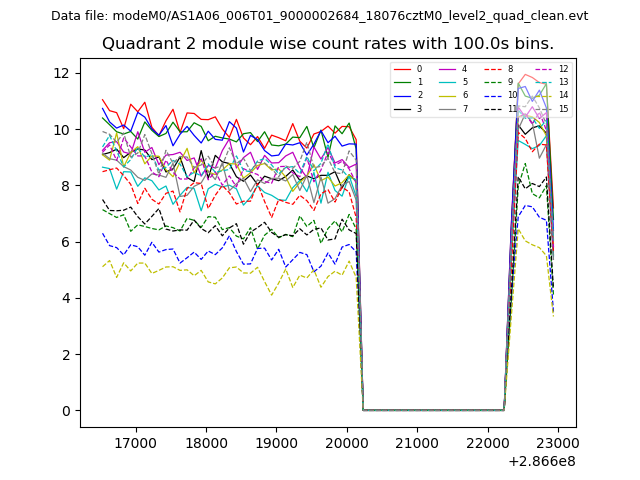
| Module-wise count rates for Quadrant A Data is divided into 100 sec bins |
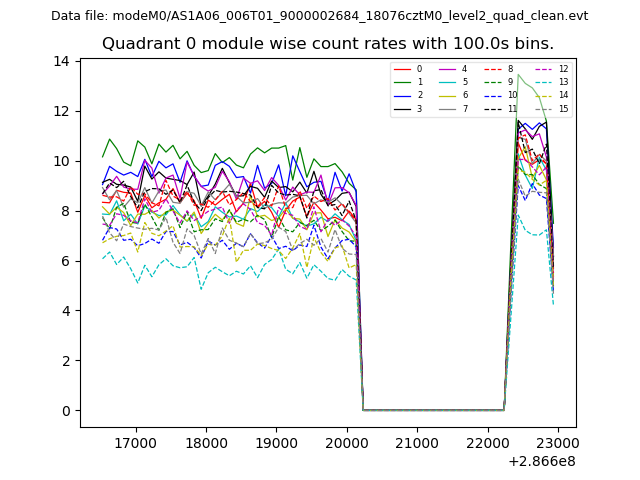 |
 |
| Module-wise count rates for Quadrant B Data is divided into 100 sec bins |
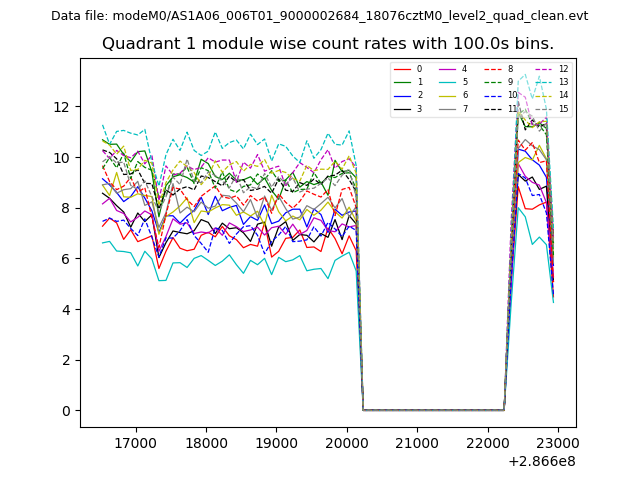 |
 |
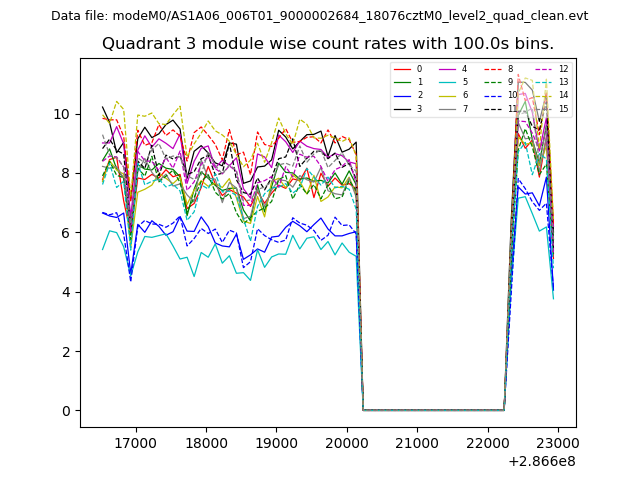
| Module-wise count rates for Quadrant C Data is divided into 100 sec bins |
 |
 |
| Module-wise count rates for Quadrant D Data is divided into 100 sec bins |
 |
 |
| Parameter | Plot |
|---|---|
| CZT HV Monitor | 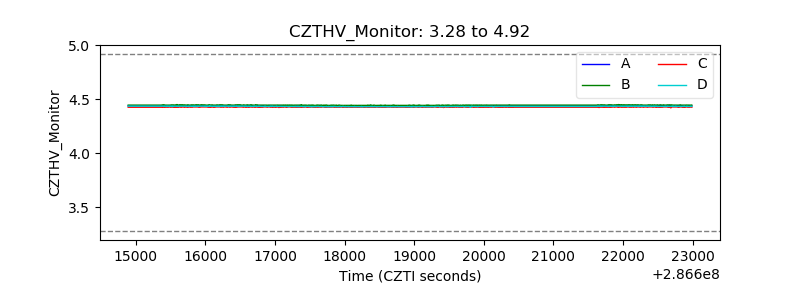 |
| D_VDD | 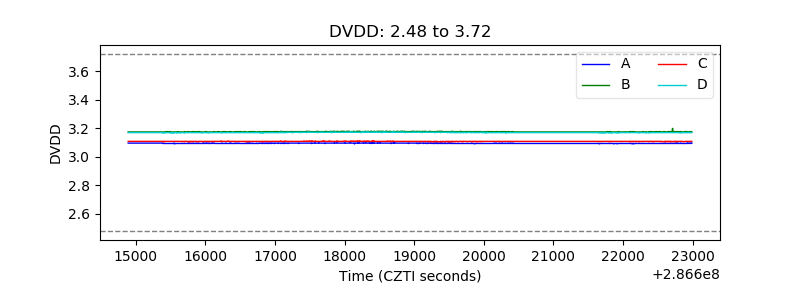 |
| Temperature 1 | 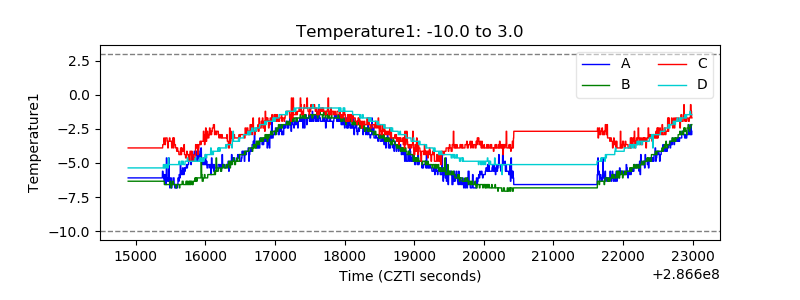 |
| Veto HV Monitor | 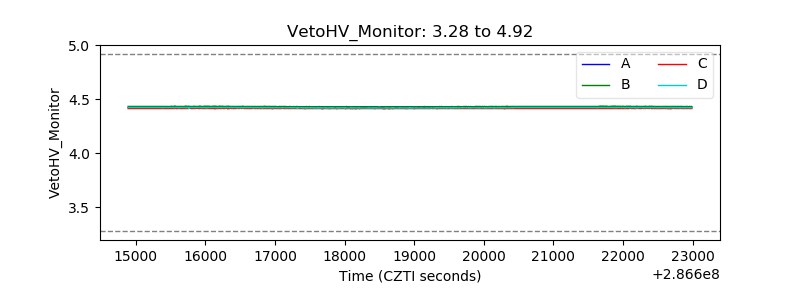 |
| Veto LLD | 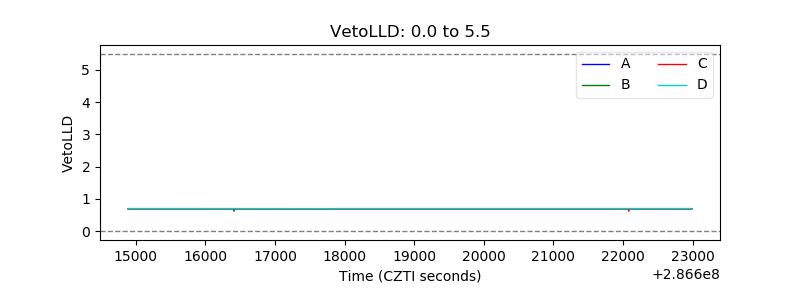 |
| Alpha Counter | 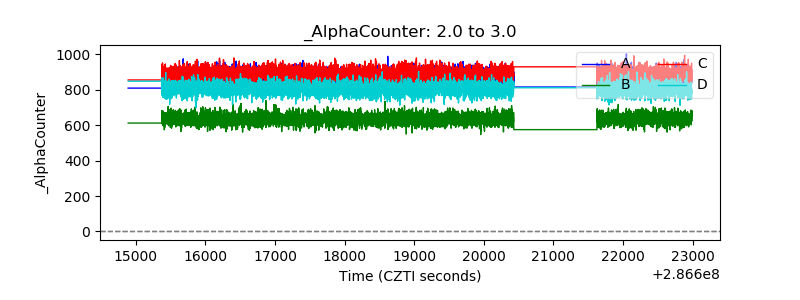 |
| _CPM_Rate | 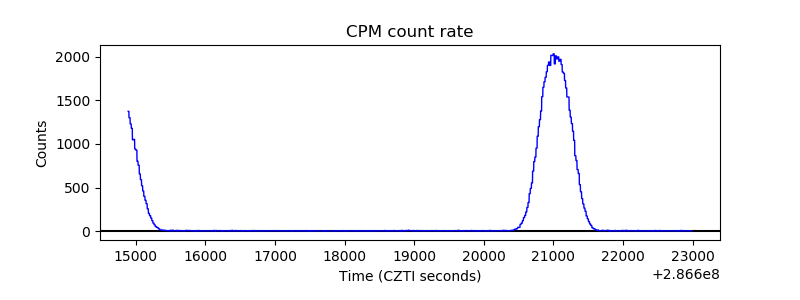 |
| CZT Counter | 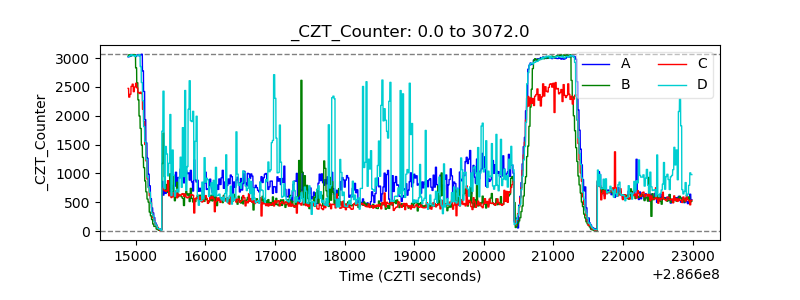 |
| +2.5 Volts monitor |  |
| +5 Volts monitor |  |
| _ROLL_ROT | 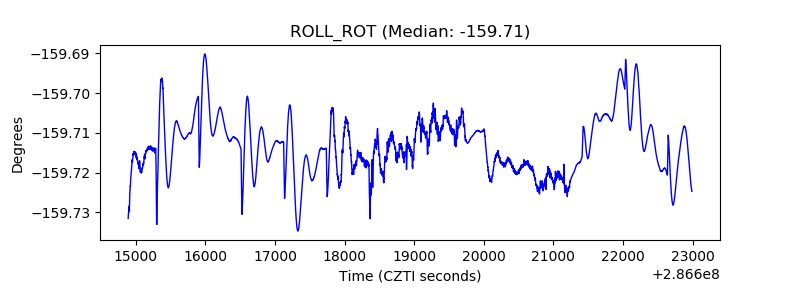 |
| _Roll_DEC | 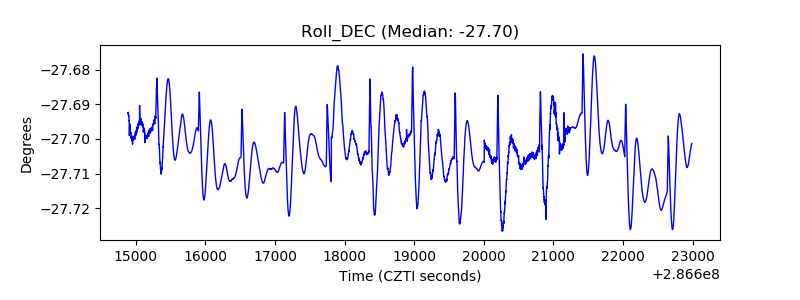 |
| _Roll_RA | 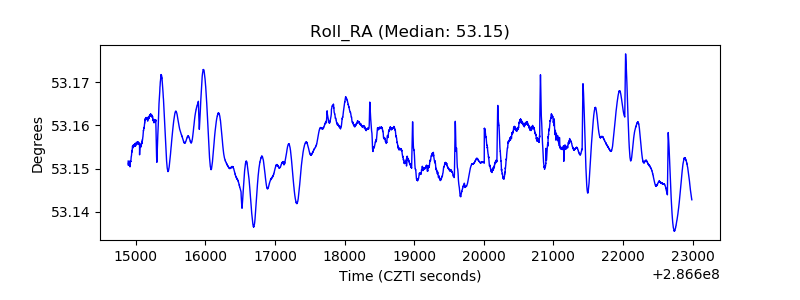 |
| Veto Counter | 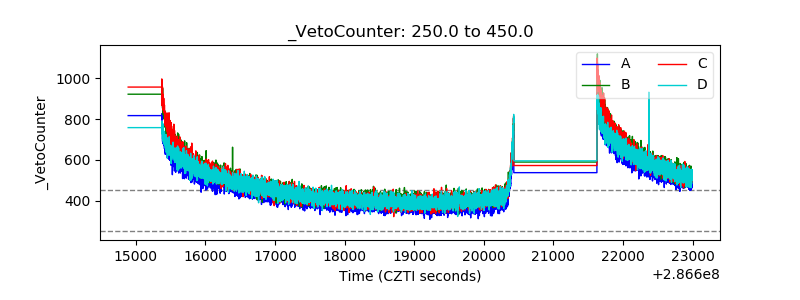 |